On My Radar: Abenomics Part II

October 10, 2025
By Steve Blumenthal
“The beatings will continue until the morale improves around here.”
– Author, unknown
It’s October: the leaves are changing, it's cool nights, and Major League Baseball playoff season is here. The stadium lights are bright, the crowd’s roaring, and every at-bat carries the weight of the season. Last night's Phillies - Dodgers game was just that.
This week, Japan is particularly top of mind, not because of the Dodgers’ phenomenon Shohei Ohtani, but because of another Japanese player: newly elected Prime Minister Sanae Takaichi. As I watched last night’s playoff game, I somehow drifted in thought back to the dark years of steroid use in baseball and the odd parallel to the years of aggressive monetary easing under former Japanese Prime Minister Shinzo Abe - known as Abenomics.
Abenomics was built on “three arrows:”
Aggressive monetary easing (to fight deflation),
Fiscal stimulus (government spending), and
Structural reforms (to boost productivity and growth).
If a player took steroids, they were known to be “on the juice.” It gave baseball players a temporary edge, inflating stats and thrilling fans, but at a long-term cost. The global financial system has its own version of that juice: it’s called money printing.
On October 4, Japan called up a new slugger to the plate. Prime Minister Sanae Takaichi is stepping in with a bat carved from Abenomics’ old wood - aggressive fiscal spending and ultra-loose monetary policy. Her plan? More stimulus, more liquidity, more “juice” for Japan’s economy.
The immediate effect may be powerful: a weaker yen, stronger exports, and another wave in the global carry trade. But like baseball’s steroid era, it’s worth considering how long the gains can last before the side effects (stagflation) kick in.
Japan’s new Prime Minister, Sanae Takaichi, is reviving Abenomics’ aggressive fiscal spending and ultra-loose monetary policy. More money printing. More stimulus. The yen will likely weaken, Japanese exports will strengthen, and the global carry trade will likely get another boost of adrenaline. The question is, how much juice can the system handle before the side effects hit?
Grab your coffee, find your favorite chair.
On My Radar:
Abeonomics Part II
AI, Robots, and Quantum Computing
Trade Signals: October 9, 2025
Personal Note: Penn State
OMR is for informational and educational purposes only. No consideration is given to your specific investment needs, objectives, or tolerances.
Please see the Important Disclosures at the bottom of this page. Reminder: This is not a recommendation to buy or sell any security. My views may change at any time. The information is for discussion and educational purposes only.
If you like what you are reading, you can subscribe for free.

Abenomics Part II
Hopes for a massive injection of global liquidity came with the election of Sanae Takaichi as prime minister on October 4. Japan’s Parliament is expected to convene next week to formally confirm her as prime minister, making her Japan's first female PM.
Takaichi is pro-growth. She is a vocal supporter of "Abenomics" (aggressive fiscal spending and loose monetary policy). Takaichi has criticized the Bank of Japan's recent rate hikes.
If confirmed by Parliament, which is not a 100% certainty, expect more stimulus. This has a global impact which we’ll discuss.
On the news, the Yen shot lower and the Japanese bond yield rose higher. You can think of this as a massive injection of liquidity into the global financial system. As we’ve come to experience, money printing is a short-term sugar injection into the economy. Still, it comes with higher debt (Japan's already tops global charts at ~260% of GDP) and devalues one’s currency. Source
In short, a declining Yen is bullish for global liquidity. A rising Yen is bearish. Following is a look at the trend (the green arrow bottom right points to the current Weekly MACD signal. Note the steep drop in the Yen this week):

Source: StockCharts.com, CMG Investment Research, Trade Signals
We don’t yet know at which point various countries reach the end of their long-term debt accumulation cycles (the point at which some form of restructuring of the system takes place). But we do know what the step process might look like, what to watch, and how this helps us assess probable outcomes.
Prime Minister Sanae Takaichi is a predictable development for us to see in the step process. To better understand this, I recommend you read The Price of Time: The Real Costs of Cheap Money (2022), by Edward Chancellor.
Chancellor examines the consequences of prolonged low interest rates and easy monetary policies, arguing that they distort markets, inflate asset bubbles, and exacerbate wealth inequality. Drawing on historical examples and economic theory, he traces how central banks’ post-2008 interventions —keeping rates near zero and flooding economies with liquidity - fueled speculative excesses, misallocated capital, and undermined long-term economic stability. Chancellor warns that suppressing the "price of time" (interest rates as the cost of borrowing) creates a false sense of prosperity, risking severe financial crises when the bubble bursts.
In the book, Chancellor concludes that, over the past 5,000 years, from ancient Mesopotamian debt jubilees and biblical clean slates to medieval defaults, 18th-century schemes like John Law's Mississippi Bubble, and modern crises like the 2008 financial meltdown, leading nations have overwhelmingly resorted to inflating their way out of massive debt burdens rather than repaying them outright.
This "easy money" path, while politically expedient, distorts markets and fails to address underlying malinvestments. And that’s the main point: will the masses elect the person who runs on the platform telling us to spend less, pay down debt, cut benefits, or will they elect the person injecting us with more juice?
The problem is debt. The problem is debt in the developed world. Japan sits high up on the debt problem list and they just elected a new Prime Minister who is promising more juice.
Let’s next take a look at the size of the problem: Total domestic debt-to-GDP (government and private debt) across the developed world. Focus on the “As a % of GDP” column. This IS THE BIG ELEPHANT IN THE MACRO ECONOMIC ROOM.
Further below, we’ll look at what this means to global liquidity. Do you remember the Yen Carry Trade? It’s back in play. More leverage - more juice. We watch…
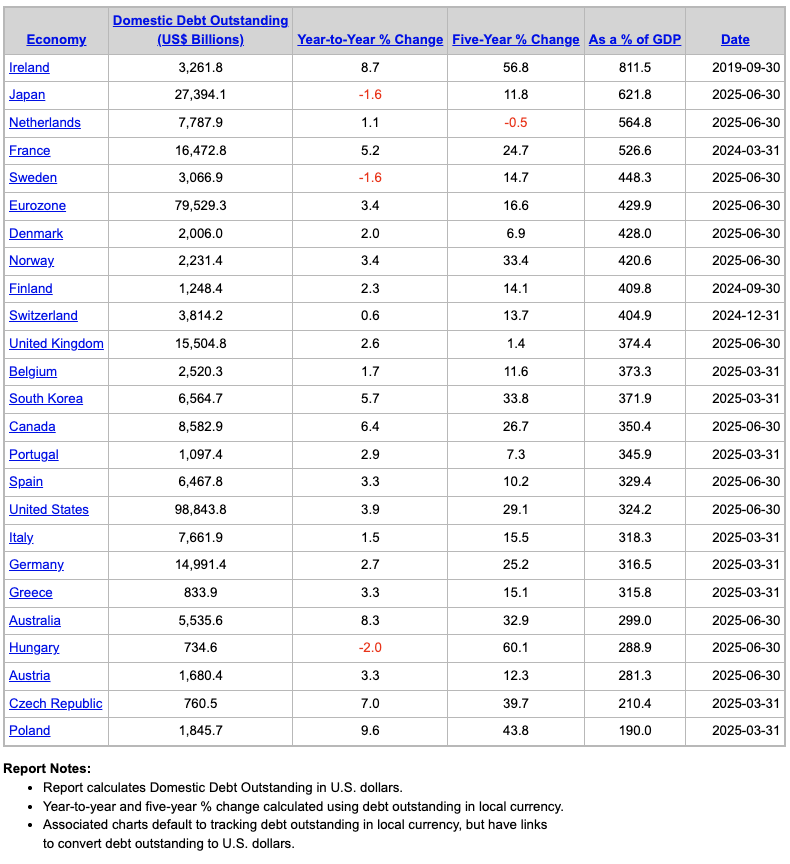
Source: NDR
Government Debt
The U.S. debt-to-GDP ratio is estimated to be 128%. It was 124% at the end of December 2024. To put the current numbers into perspective, total public debt relative to the economy's annual output has fluctuated significantly over time, reflecting wars, economic crises, and policy shifts.
Here's an overview of U.S. historical trends:
Early Republic (1790s–1860): The ratio started high at ~30% post-Revolutionary War but dropped to near 0% by the 1830s under fiscal restraint. It remained low, averaging under 10%, until the Civil War.
Civil War (1861–1865): Debt surged to ~30% by 1865 due to war financing, but declined steadily to ~10% by 1900 as the economy grew and surpluses reduced debt.
World War I and Interwar Period (1914–1939): The ratio spiked to 33% by 1919 due to war bonds, then fell to ~16% by 1929. The Great Depression and New Deal spending pushed it to ~40% by 1939.
World War II (1941–1945): The ratio peaked at 112.7% in 1945, driven by massive war expenditures, but rapid post-war growth and inflation cut it to ~50% by the early 1950s.
Post-War to 1980s: Strong economic growth kept the ratio low, dipping to 31.8% in 1974. Reagan-era tax cuts and military spending raised it to ~50% by the late 1980s.
1990s–2000s: Fiscal discipline under Clinton reduced it to 55.5% by 2000. However, tax cuts, wars in Iraq and Afghanistan, and the 2008 financial crisis drove it to 82.4% by 2009.
From the Post-2008 Great Financial Crisis to 2020 (TARP programs, QE infinity, Zero interest rate policy), combined with a slow economic recovery, pushed the ratio to 100.1% by 2012. It stayed around 100–105% until the COVID-19 pandemic, when massive relief spending spiked it to 123.4% in 2020.
2020–2025: As of December 2024, the ratio stood at 124.3%. Current projections for 2025 estimate 128–130% due to persistent deficits and policies like the 2024 One Big Beautiful Bill Act, which lifted the debt ceiling by another $5 trillion.
Long-term forecasts from the Congressional Budget Office suggest the debt-to-GDP ratio could hit 166% by 2054 without reforms. Source: CBO
Let’s pray not, but there are some significant economic headwinds, such as aging demographics.
Key drivers include war spending, economic downturns, tax policies, and entitlement growth. When you factor in poor demographics (aging populations) in much of the developed world, the pressure mounts. However, AI and Robots are coming, which could accelerate growth. No opinion on this yet… We watch, measure, and position.
Compared to Japan’s ~260%, the U.S. ratio is high but not seemingly as dire. I’ve long said that the U.S. is following Japan’s footprints. The path they take is the path the U.S. will most likely follow. Not a guarantee, just my observations.
I believe the masses will vote for the politicians promising more sugar. 5,000 years of human behavior give us a sense of probable outcome—a playbook of sorts. Last week’s election of a new Prime Minister in Japan should not come as a surprise.
Debt is the problem. The money printing continues until we reach a point where inflation and higher interest rates cause enough pain for a restructuring to occur. Until then, there exists no political will to change the course.
There is a funny line, “the beatings will continue until the morale improves around here.” It’s an ironic one-liner that highlights a self-defeating, authoritarian approach: punishing people and expecting morale to rise. Meaning: “I’ll keep punishing people until they feel better” — intentionally backwards, so it’s sarcastic. In the current story, I believe the beating will continue. The punishment is inflation or worse, stagflation. Half the population already doesn’t fully understand what is hitting them.
A Fed Chairman Paul Volcker moment will come
Paul Volcker, Federal Reserve Chairman from 1979 to 1987, is revered for his decisive role in taming the rampant inflation that gripped the U.S. economy in the late 1970s and early 1980s, earning him a reputation as one of the most impactful central bankers in history. Facing "stagflation"—double-digit inflation (peaking at 14.8% in 1980) combined with high unemployment and stagnant growth—Volcker implemented a bold and controversial monetary policy. He sharply raised the federal funds rate, peaking at 20% in 1981, to crush inflation expectations, prioritizing long-term price stability over short-term economic pain. This "Volcker Shock" triggered a severe recession (1980–1982), with unemployment hitting 10.8%, but successfully reduced inflation to ~3% by 1983, laying the foundation for decades of economic stability.
When will she or he arrive? On our current course, my best guess is 2028. But it really is just a guess.
Watch Japan. The U.S. is following just a few steps behind. Next week’s confirmation is an important marker.
Conclusion
When Japan prints, the world feels it. It’s not just Japanese juicing the system. A weaker yen tends to push global liquidity higher as investors borrow cheaply in yen and invest in higher-yielding assets abroad—the classic “yen carry trade.” That flow can lift risk assets from U.S. equities to emerging markets, giving markets an extra tailwind even as fundamentals soften elsewhere.
But the flip side is system-wide leverage. When the yen strengthens, those trades can unwind fast—pulling liquidity out of the system and amplifying volatility.
For now, the message from Tokyo is clear: more juice, more liquidity, more risk-on. The bigger question is how long Japan can keep swinging before markets start testing what’s real and what’s artificially enhanced.
I’m keeping a close eye on the Dollar/Yen chart. A declining Yen is bullish for global liquidity.
NDR, Inc. (NDR), d.b.a. Ned Davis Research Inc., any NDR affiliates or employees, or any third-party data provider, shall not have any liability for any loss sustained by anyone who has relied on the information contained in any NDR publication. The data and analysis contained herein are provided "as is." NDR disclaims any and all express or implied warranties, including, but not limited to, any warranties of merchantability, suitability or fitness for a particular purpose or use. NDR's past recommendations and model results are not a guarantee of future results. This communication reflects our analysts' opinions as of the date of this communication and will not necessarily be updated as views or information change. All opinions expressed herein are subject to change without notice. NDR or its affiliated companies or their respective shareholders, directors, officers and/or employees, may have long or short positions in the securities discussed herein and may purchase or sell such securities without notice. For NDR's important additional disclaimers, refer to www.ndr.com/invest/public/copyright.html. Further distribution prohibited without prior permission. Copyright 2025 © NDR, Inc. All rights reserved.
Paul Tudor Jones on CNBC
Paul Tudor Jones was a guest on CNBC this week. He says ingredients are in place for a massive rally before a 'blow off.' Adding, “today’s market is reminiscent of the setup leading up to the burst of the dot-com bubble in late 1999.” You can watch the six minute clip - click on the photo.
Source: CNBC
From CNBC: Billionaire hedge fund manager Paul Tudor Jones believes the conditions are set for a powerful surge in stock prices before the bull market tops out.
“My guess is that I think all the ingredients are in place for some kind of a blow off,” Jones said Monday on CNBC’s “Squawk Box.” “History rhymes a lot, so I would think some version of it is going to happen again. If anything, now is so much more potentially explosive than 1999.”
The founder and chief investment officer of Tudor Investment said today’s market is reminiscent of the setup leading up to the burst of the dot-com bubble in late 1999, with dramatic rallies in technology shares and heightened speculative behavior. Jones said the circular deals or vendor financing happening in the artificial intelligence space today also made him “nervous.”
The tech-heavy Nasdaq Composite has bounced 55% from its April bottom to consecutive record highs. The rally has been driven by megacap tech giants, which have invested billions in AI and are being valued richly on the potential of this emerging era.
Trade Signals: Update - October 9, 2025
Trade Signals is Organized in the Following Sections:
*Trade Signals basics: The Market Commentary section summarizes notable changes in the core key indicators: Investor sentiment, market breadth, stocks, treasury yields, the dollar, and gold. The Dashboard of Indicators provides a detailed view of all Trade Signals indicators.
Key Macro Indicators - Investor Sentiment, Market Breadth, The S&P 500 Index (Stocks), The 10-year Treasury Yield (Bonds), and the Dollar
About Trade Signals
Trade Signals is a paid subscription service that posts the daily, weekly, and monthly trends in the markets (and more). Free for CMG clients. Not a recommendation to buy or sell any security. For discussion purposes only.
“Extreme patience combined with extreme decisiveness. You may call that our investment process.
Yes, it’s that simple.”
– Charlie Munger

TRADE SIGNALS SUBSCRIPTION ACKNOWLEDGEMENT / IMPORTANT DISCLOSURES
The views expressed herein are solely those of Steve Blumenthal as of the date of this report and are subject to change without notice. Not a recommendation to buy or sell any security.
Please note that the information provided is not recommended for buying or selling any security and is provided for discussion purposes only. Current viewpoints are subject to change. Please note that the information provided is not recommended for buying or selling any security and is provided for discussion purposes only.
Personal Note: Penn State Homecoming
Before I conclude today’s note, the China - U.S. trade war has taken a turn for the worse. Yesterday, China’s Ministry of Commerce said that foreign entities must now obtain a license to export products that contain more than 0.1% of rare earth sourced from that country, or that are manufactured using Chinese extraction, refining, magnet-making, or recycling technology. The new rules in rare earths exports are set to take effect on Dec. 1. Source: CNBC
Obtaining a license may mean “no soup for you.” China controls 70% of the rare earth metals. In response, Trump threatened in a social media post to cancel his upcoming meeting with Chinese President Xi Jinping because of the dispute. An “Art of the deal” maneuver by Xi? The world is in a very difficult place.
I’m holding peace in the Middle East in my prayers (Israel and Hamas agreement to the peace deal). This would be a significant step forward and a great success for the Trump administration if it holds. Just calling balls and strikes. I dislike much of President Trump’s behavior and process, but this is something no one believed could be accomplished. I pray it sticks.
Sadly, my Phillies were tied 1-1 with the Dodgers in the bottom of the 11th inning. The Dodgers were at the plate with two outs and the bases loaded. A broken bat grounder to the pitcher, followed by a poor decision, ended the Phillies’ season.
Rushing to hit the send button so I can make it to the Friars’ 4 p.m. game against Penn Charter. Coach Sue’s Malvern Prep squad sits at seven wins, four losses, and two ties—having dropped two of their last three by a narrow 0–1 margin. The toughest stretch of the season is upon us. I’ll be back on the sidelines with my beautiful wife this afternoon for what feels like a must-win. Let’s go, Friars!
Coaching alongside Susan has been an excellent (and much-needed) distraction from my day job. The quality of soccer and character of the boys on this year’s team are a joy to be around. It’s a joy to experience.
Homecoming weekend at Penn State kicks off tomorrow. Our daughter Brianna is home, and we’re driving to State College for the game, looking forward to reconnecting with old friends. I’ll be visiting family and tailgating with fraternity brothers. A few bottles of good red are already boxed and ready for the trip. And no, I don’t want to talk about Penn State’s play calling against UCLA last week. Ugh, but as with all things in life and sports: ever forward.
Really looking forward to catching up with my fraternity brothers, and hope you find your way to an old friend.
Have a great week!
Warm regards,
Steve
CLICK HERE TO SUBSCRIBE TO ON MY RADAR - IT’S FREE
You can share this letter on X by clicking here.
You can share this letter on LinkedIn by clicking here.
Subscribe to OMR for free by clicking the photo.
Stephen B. Blumenthal
Executive Chairman & CIO
CMG Capital Management Group, Inc.
75 Valley Stream Parkway, Suite 201, Malvern, PA 19355
Private Wealth Client Website
CMG Customer Relationship Summary (Form CRS)
Metric-Financial, LLC Customer Relationship Summary (Form CRS)

Stephen Blumenthal founded CMG Capital Management Group in 1992 and serves today as its Executive Chairman and CIO. Steve authors a free weekly e-letter entitled, “On My Radar.” Steve shares his views on macroeconomic research, valuations, portfolio construction, asset allocation and risk management. Author of Forbes Book: On My Radar, Navigating Stock Market Cycles.
Follow Steve on X @SBlumenthalCMG and LinkedIn.
IMPORTANT DISCLOSURE INFORMATION
This document is prepared by CMG Capital Management Group, Inc. (“CMG”) and is circulated for informational and educational purposes only. There is no consideration given to the specific investment needs, objectives, or tolerances of any of the recipients. Additionally, CMG’s actual investment positions may, and often will, vary from its conclusions discussed herein based on any number of factors, such as client investment restrictions, portfolio rebalancing, and transaction costs, among others. Recipients should consult their own advisors, including tax advisors, before making any investment decision. This material is for informational and educational purposes only and is not an offer to sell or the solicitation of an offer to buy the securities or other instruments mentioned. This material does not constitute a personal recommendation or take into account the particular investment objectives, financial situations, or needs of individual investors which are necessary considerations before making any investment decision. Investors should consider whether any advice or recommendation in this research is suitable for their particular circumstances and, where appropriate, seek professional advice, including legal, tax, accounting, investment, or other advice. The views expressed herein are solely those of Steve Blumenthal as of the date of this report and are subject to change without notice.
Investing involves risk.
This letter may contain forward-looking statements relating to the objectives, opportunities, and future performance of the various investment markets, indices, and investments. Forward-looking statements may be identified by the use of such words as; “believe,” anticipate,” “planned,” “potential,” and other similar terms. Examples of forward-looking statements include, but are not limited to, estimates with respect to financial condition, results of operations, and success or lack of success of any particular market, index, investment, or investment strategy. All are subject to various factors, including, but not limited to, general and local economic conditions, changing levels of competition within certain industries and markets, changes in legislation or regulation, Federal Reserve policy, and other economic, competitive, governmental, regulatory, and technological factors affecting markets, indices, investments, investment strategy and portfolio positioning that could cause actual results to differ materially from projected results. Such statements are forward-looking in nature and involve a number of known and unknown risks, uncertainties, and other factors, and accordingly, actual results may differ materially from those reflected or contemplated in such forward-looking statements. Investors are cautioned not to place undue reliance on any forward-looking statements or examples. All statements made herein speak only as of the date that they were made. Investing is inherently risky and all investing involves the potential risk of loss.
Past performance does not guarantee or indicate future results. Different types of investments involve varying degrees of risk, and there can be no assurance that the future performance of any specific investment, investment strategy, or product (including the investments and/or investment strategies recommended or undertaken by CMG), or any non-investment related content, made reference to directly or indirectly in this commentary will be profitable, equal any corresponding indicated historical performance level(s), be suitable for your portfolio or individual situation or prove successful. Due to various factors, including changing market conditions and/or applicable laws, the content may no longer be reflective of current opinions or positions. Moreover, you should not assume that any discussion or information contained in this commentary serves as the receipt of, or as a substitute for, personalized investment advice from CMG. Please remember to contact CMG, in writing, if there are any changes in your personal/financial situation or investment objectives for the purpose of reviewing/evaluating/revising our previous recommendations and/or services, or if you would like to impose, add, or to modify any reasonable restrictions to our investment advisory services. Unless, and until, you notify us, in writing, to the contrary, we shall continue to provide services as we do currently. CMG is neither a law firm, nor a certified public accounting firm, and no portion of the commentary content should be construed as legal or accounting advice.
No portion of the content should be construed as an offer or solicitation for the purchase or sale of any security. References to specific securities, investment programs or funds are for illustrative purposes only and are not intended to be, and should not be interpreted as recommendations to purchase or sell such securities.
This presentation does not discuss, directly or indirectly, the amount of the profits or losses realized or unrealized, by any CMG client from any specific funds or securities. Please note: In the event that CMG references performance results for an actual CMG portfolio, the results are reported net of advisory fees and inclusive of dividends. The performance referenced is that as determined and/or provided directly by the referenced funds and/or publishers, has not been independently verified, and does not reflect the performance of any specific CMG client. CMG clients may have experienced materially different performance based upon various factors during the corresponding time periods. See in links provided citing limitations of hypothetical back-tested information. Past performance cannot predict or guarantee future performance. Not a recommendation to buy or sell. Please talk to your advisor.
Information herein has been obtained from sources believed to be reliable, but we do not warrant its accuracy. This document is general communication and is provided for informational and/or educational purposes only. None of the content should be viewed as a suggestion that you take or refrain from taking any action nor as a recommendation for any specific investment product, strategy, or other such purposes.
In a rising interest rate environment, the value of fixed-income securities generally declines, and conversely, in a falling interest rate environment, the value of fixed-income securities generally increases. High-yield securities may be subject to heightened market, interest rate, or credit risk and should not be purchased solely because of the stated yield. Ratings are measured on a scale that ranges from AAA or Aaa (highest) to D or C (lowest). Investment-grade investments are those rated from highest down to BBB- or Baa3.
NOT FDIC INSURED. MAY LOSE VALUE. NO BANK GUARANTEE.
Certain information contained herein has been obtained from third-party sources believed to be reliable, but we cannot guarantee its accuracy or completeness.
In the event that there has been a change in an individual’s investment objective or financial situation, he/she is encouraged to consult with his/her investment professional.
Written Disclosure Statement. CMG is an SEC-registered investment adviser located in Malvern, Pennsylvania. Stephen B. Blumenthal is CMG’s founder and CEO. Please note: The above views are those of CMG and its CEO, Stephen Blumenthal, and do not reflect those of any sub-advisor that CMG may engage to manage any CMG strategy, or exclusively determines any internal strategy employed by CMG. A copy of CMG’s current written disclosure statement discussing advisory services and fees is available upon request or via CMG’s internet web site at www.cmgwealth.com/disclosures. CMG is committed to protecting your personal information. Click here to review CMG’s privacy policies.