On My Radar: The Yen Carry Trade - Part II

August 7, 2026
By Steve Blumenthal
“There is no means of avoiding the final collapse of a boom brought about by credit expansion. The alternative is only whether the crisis should come sooner as the result of voluntary abandonment of further credit expansion, or later as a final and total catastrophe of the currency system involved.”
- Ludwig von Mises, Human Action, 1949
Thursday night, July 30, in Tokyo. Most of Wall Street was already home for the night.
In the span of about an hour, with no press conference and no confirmation from anyone in the Japanese government, the yen moved from ¥162.80 to the ¥157 mark against the dollar. A currency that trades trillions of dollars a day simply doesn't move that fast on its own (Source: The Japan Times).
It moved that fast because someone with an enormous checkbook decided it was time to act.
We now know Japan spent an estimated $53 billion, or ¥8.45 trillion, defending its currency that day, likely the largest single-day currency intervention in history (Source: Bloomberg, via Global Markets Investor).
The very next day, Friday, the U.S. Treasury joined in. The New York Fed sold euros to buy yen on the Treasury's behalf, working through Goldman Sachs and Morgan Stanley (Source: Financial Times, Reuters, CNBC). By most counts, it was the first time in nearly thirty years that Washington and Tokyo have intervened in this market side by side.
Two governments, acting together, spending tens of billions of dollars in the span of two days, to defend a currency that has been sliding for years. That is not a small thing. I want to walk you through what happened, why it happened, and why I think it matters far more than the size of the intervention alone suggests.
Grab your coffee, find your favorite chair. This one is important.
On My Radar:
Gradually, Then Suddenly: What the Yen Intervention Really Means
OMR is for informational and educational purposes only. No consideration is given to your specific investment needs, objectives, or tolerances.
Please see the Important Disclosures at the bottom of this page. Reminder: This is not a recommendation to buy or sell any security. My views may change at any time. The information is for discussion and educational purposes only.
If you like what you are reading, you can subscribe for free.

Gradually, Then Suddenly: What the Yen Intervention Really Means
Two weeks ago, I wrote about the yen carry trade and laid out three signals I was watching for the moment it came under real stress: high-yield credit spreads, emerging market default insurance costs, and the yen itself. See: On My Radar: The Yen Carry Trade, Margin Debt, Oil and Inflation. At the time, all three signals sat at the calm end of their range. A week ago, the third one moved. Hard.
Before I jump in, I want to explain something that tends to trip up almost everyone. When I say the yen went up in price when the exchange rate went from ¥162.80 to ¥157, it’s confusing. How did it decline in price yet, in the same breath, say the yen moved up? It depends on whether we are looking at the value of the yen-to-dollars or dollars converted to yen.
It isn't the price of a yen; it's how many yen you get for one dollar. So when that number goes down, it means your dollar buys fewer yen than before. Each yen has become more expensive, more valuable. The number and the value move in opposite directions.
It's simply an artifact of which currency is on top of the fraction. Another way to say it plainly, if it helps: fewer yen per dollar means the dollar is buying less, and the yen is the one gaining strength relative to it.
Back to the problem
A quick refresher, because this matters and it's worth being clear on. Japan has kept interest rates near zero for the better part of three decades. That makes the yen the cheapest major currency in the world to borrow. Investors everywhere (hedge funds, banks, insurers) borrow yen for almost nothing, convert it to dollars, and invest in higher-yielding assets: Treasuries, corporate bonds, stocks. They pocket the spread. Borrow for near 0%, invest in a US Treasury Bill yielding 3.625%, and wash-rinse-repeat (or other bonds, stocks, the Mag 7, etc.).
In total, this is one of the largest, least visible sources of leverage in the global financial system, and nobody knows its true size because so much of it lives off-balance-sheet.
The trade works as long as two things hold: the rate gap between Japan and the U.S. stays wide, and the yen doesn't strengthen unexpectedly. This week, the yen strengthened very unexpectedly.
Why Now?
The yen had broken through ¥163 to the dollar last week, a four-decade low, pressured by safe-haven dollar buying tied to Middle East tensions and by a Fed that has kept rates higher for longer. Japan's finance ministry had spent months issuing verbal warnings without following through. This time, they did.
Nicholas Mugalli, a macro strategist I follow, framed what's really going on here better than I could. His point: this isn't ordinary bilateral cooperation. Japan's central bank is trapped between imported inflation and a debt load it cannot afford to defend with higher rates. Mugalli's words: it's “a de facto bailout of the BOJ's broken FX framework.” Source: @RealNickMugalli.
Here is the critical mechanism worth understanding. If the Bank of Japan won't raise interest rates to defend the yen, it's because Japan's government debt is so large that meaningfully higher rates risk a domestic debt-servicing crisis. So if it won’t raise rates, then Japan is left selling something else like U.S. Treasuries. Selling Treasuries in size pushes U.S. long-term yields higher. Mugalli notes the 30-year Treasury yield spiked to 5.24% this week. Put plainly, defending the yen the old way risks breaking something in our own bond market. That is very likely why the U.S. Treasury stepped in directly instead of just cheering from the sidelines.
Here is some math
Japan holds roughly $1.14–1.19 trillion in US Treasury securities, based on the most recent official data (March 2026: $1,191.6 billion LegalClarity, May 2026: $1,143.10 billion MacroMicro)
Japan remains, by a wide margin, the largest foreign holder of US debt.
Japan alone accounts for roughly 13 percent of all foreign-held US government debt, out of roughly $9.3 trillion held collectively by foreign entities.
That's more than the UK and China combined don't hold. For context, the UK holds about $0.9 trillion and China about $0.7 trillion. LegalClarity + 2
Worth noting: China's holdings have fallen from a peak near $1.3 trillion around 2013 to roughly $652 billion, an 18-year low, while Japan has held steady near or above $1.1–1.2 trillion.
That's part of why Japan's position carries so much weight right now: it's not just the largest foreign creditor, it's the one whose behavior (selling Treasuries to defend the yen) actually moves markets if it happens.
Here is the mechanical link to understand
With roughly $1.14 trillion on the line, Japan doesn't need to sell much of its position to meaningfully pressure Treasury yields, which is exactly the leverage point Bessent's intervention was designed to defuse.
Mohamed El-Erian flagged the scale of it directly: “$53 billion on Thursday alone.” His broader point was that even a record-setting intervention barely held the line — the yen struggled to stay below ¥160 rather than build on its initial bounce. Source: @elerianm.
Brad Setser, a former Treasury official who watches these flows as closely as anyone, confirmed the mechanics: Treasury used roughly $14 billion of its euro reserves to buy yen. His view, in short is the yen has become “ridiculously weak,” and he's one of the few who thinks intervention was the right call here. Source: @Brad_Setser.
It’s worth noting that the intervention low was ¥157 and the has yen weakened past 158 per dollar at the time of this writing on August 7, which is fueling speculation authorities may step in again. TRADING ECONOMICS
Key points:
This suggests the market is testing Bessent and the BOJ to see if they'll defend the line a second time.
I put that probability as high, and it appears the equity market does as well.
Bottom line: The fragility isn't resolved; it's just paused.
Does It Work?
History says: not for long. The closest precedent is the 1985 Plaza Accord, when five major nations agreed to coordinate action to weaken the dollar. It's remembered as a success, but the dollar had already begun rolling over before the agreement was signed - the accord got credit for a trend that was arriving anyway.
Within two years, the world needed the Louvre Accord just to stop the dollar's decline from overshooting. Coordinated intervention can move a price for a few days. It doesn't change the interest rate gap or the debt loads driving the underlying pressure.
That's the uncomfortable truth sitting underneath this week's headlines. Japan doesn't want to raise rates because it fears a recession and a debt crisis. The U.S. doesn't want its long bond yields spiking because of Treasury bond sales out of Tokyo. So instead of fixing the rate differential that makes the carry trade attractive in the first place, both governments spent tens of billions of dollars treating the symptom. That buys time. It does not buy a solution.
How Big Is the Trade Being Unwound?
Nobody can measure the yen carry trade precisely which is what makes it dangerous. Rough estimates put it at $500 billion at its peak, a figure consistent with what analysts calculated after the last major unwind, in August 2024. Some estimates run higher into the trillions. What we don't know is how much of it has already come undone versus how much remains outstanding. That uncertainty is exactly the point: when a $500 billion position starts to unwind, it doesn't send a save-the-date card.
Why This Dwarfs the Other Two Blow-Ups This Month
If you've been reading the financial press, you already know about two other leverage stories that rattled markets recently. Both are worth understanding, because together they show what happens when borrowed money meets a crowded trade. Neither comes close to the scale of what a full yen carry unwind could look like.
The first: Leopold Aschenbrenner's AI-focused hedge fund, Situational Awareness, grew to roughly $45 billion by peaking this summer, reportedly the fund was up more than 400% on the year prior to the unwind. The returns were built on leverage as high as 4-to-1. When AI infrastructure stocks like SK Hynix and CoreWeave turned sharply lower, the fund's lenders, Goldman Sachs, JPMorgan, Bank of America, issued margin calls the fund couldn't fully meet. It was forced to sell its public stock portfolio, longs and shorts, to Ken Griffin's Citadel, in one large block trade. The fund's assets fell from roughly $45 billion to about $10 billion in a matter of weeks. Sources: CNBC, Financial Times, Wall Street Journal.
Imagine what might have happened if Griffin didn’t step in. He’s more shark like than saint. Griffin could have let the banks liquidate the AI stocks in the open market. That would likely have triggered other investors to panic triggering more margin calls and more forced selling by the brokerage firms. Situational Awareness was 4x leveraged. Individual margin accounts are up to 2x leveraged. This could have been a much larger mess had Griffin not bought the the shares. Enter South Korea with no Ken Griffin to save the day.
The second: South Korea. Retail investors piled into leveraged single-stock ETFs and margin loans to ride the same AI semiconductor boom, concentrated overwhelmingly in Samsung Electronics and SK Hynix. By mid-July, more than 1.2 million leveraged accounts had triggered margin calls, and somewhere between 320,000 and 360,000 accounts were forcibly liquidated by brokers - roughly one in every 30 working-age adults in the country. The KOSPI fell more than 27% from its June peak. Source: Investing.com, Goldman Sachs trading desk data.
Both stories made headlines for good reason. They're vivid, human, and show exactly how leverage amplifies losses on the way down. But look at the numbers. The AI fund lost on the order of $35 billion. South Korea's retail margin book contracted by somewhere in the neighborhood of $15 to $20 billion. The yen carry trade is estimated at roughly $500 billion. That's not a bigger version of the leverage story. That's an order of magnitude larger; ten to fifteen times the size of the two blow-ups that already made front-page news this summer, combined.
If a single overleveraged fund losing $35 billion can force a fire sale to a rival, and 360,000 Korean retail accounts losing their savings can knock 27% off a national stock index, it's worth asking, calmly and honestly, what happens if even a fraction of a $500 billion global funding trade unwinds in a similar window of time. That is not a prediction. It's arithmetic, and it's the reason I take this week's yen intervention so seriously.
Gradually, Then Suddenly
Here is what ties all of this together for me. For years really, since Japan first adopted near-zero rates decades ago, the world has kicked this particular can down the road. Japan intervened in 2022. It intervened again in 2024. It intervened multiple times already this year. Each time, the move buys days, sometimes weeks, sometimes months, rarely more. The underlying imbalance is a Bank of Japan that can't afford to raise rates and a U.S. piling on debt by the minute (over $40 trillion now) and spending nearly $2 trillion per year than it is taking in tax revenues at a time when the world's appetite for dollar debt is not infinite. It just gets managed, one intervention at a time.
Ray Dalio has been warning about this for years. From Fortune Magizine: “Dalio’s fiscal warning remains as stark as ever. The U.S. currently spends roughly $7 trillion annually while collecting about $5 trillion in revenue—a gap that has the federal government paying billions every week in debt service and has left the country carrying debt approximately six times its income. He likens the situation to “plaque building up” in an artery: no heart attack yet, but the nation’s financial “MRI” suggests one is coming if spending isn’t curtailed.”
He added, “For those looking to protect themselves, Dalio’s advice is bluntly defensive: diversify, and hedge against dollar devaluation. He has urged investors to move well beyond the traditional 60/40 stock-and-bond portfolio, recommending allocating up to 15% to gold and crypto as a hedge against fiat currency devaluation amid this period of turbulence.” Fortune May 2026
Leverage is always the problem. It blows things up. I continue to describe our current state as overvalued, over-leveraged, over-concentrated, and euphoric. Hemingway famously described going bankrupt: gradually, then suddenly.
Years of gradual can-kicking got us to a place where two governments had to jointly spend the largest sum in currency-intervention history just to keep a four-decade-low currency from sliding further. That's the “gradually.” I don't know when the “suddenly” arrives. I'd rather be early in recognizing the pattern than late.
Bottom Line
I'm not predicting a crash on any specific date. I don't know if the yen is the trigger this time, or something else entirely. What I do know is that this week's intervention, however large, treated a symptom rather than a cause. Watch the same three signals I flagged two weeks ago: high-yield credit spreads (currently fine), emerging market default costs (currently fine), and the yen itself (currently skating on very thin ice). If all three start moving together — especially if the yen keeps strengthening even after this week's fireworks fade — that is the tell that the carry trade may be starting to unwind.
Given the size of the money involved, and given what we just watched happen with a single hedge fund and an entire country's retail investor base on a far smaller scale, this is worth paying close attention to in the weeks ahead.
The quote I shared in the prior Yen post remains apropos: “You can avoid reality, but you cannot avoid the consequences of ignoring reality.” - Ayn Rand
Next week, I'll turn to the other half of this story: U.S. government debt, and how it connects to everything above.
Opinions are subject to change. Not a recommendation to buy or sell any security. Provided for discussion and educational purposes only.
60/40 No Longer Working
The bond market has now lost money for six years. Six years! And I believe the higher rates and higher inflation remain probable due to the debt mess the world finds itself in.
Then, the following Apollo hit my inbox on Monday, August 3.
“The 60/40 portfolio is broken because equity returns are driven by AI concentration rather than the business cycle, while bond returns are now driven by fiscal constraints rather than cycle dynamics.
With the AI trade slowing down and government debt projected to reach 175% of GDP (see chart below), neither the 60 nor the 40 responds to what made it work in the first place.
The bottom line is that the 60/40 portfolio has lost its diversification benefit, with fundamental implications for asset allocation.
The real risk emerges if the AI trade reverses or markets become more worried about government deficits. In either scenario, both stocks and bonds would face pressure simultaneously, leaving investors with no hedge.” Bold emphasis, Apollo
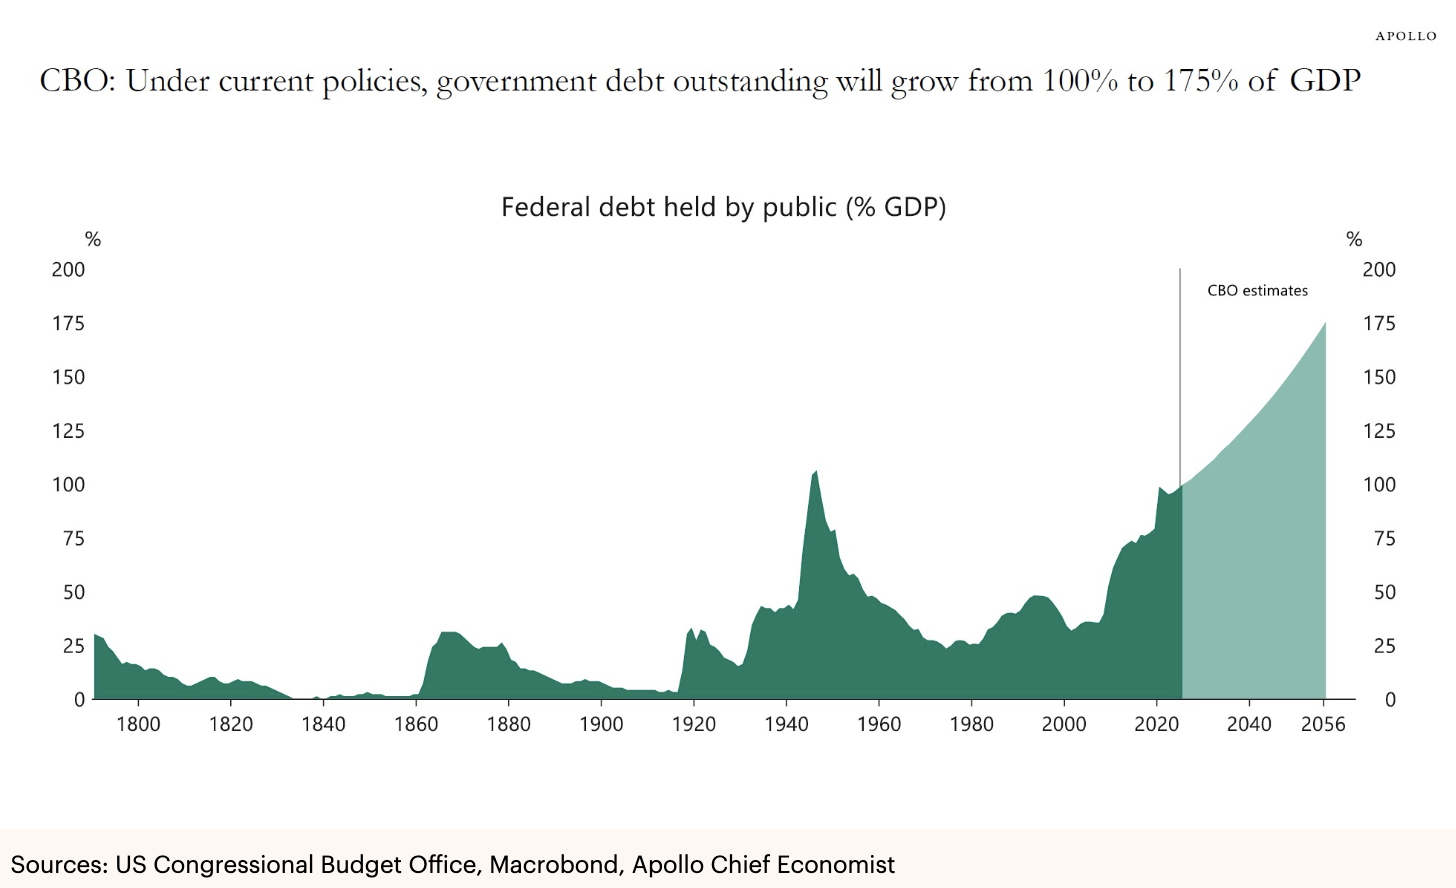
Source: Apollo
Apollo - The Last Japan: The Yen and the Rise of Shareholder Activism
Sometimes it is good to hear the same thing from a different voice. Read the following. It is also from Apollo.
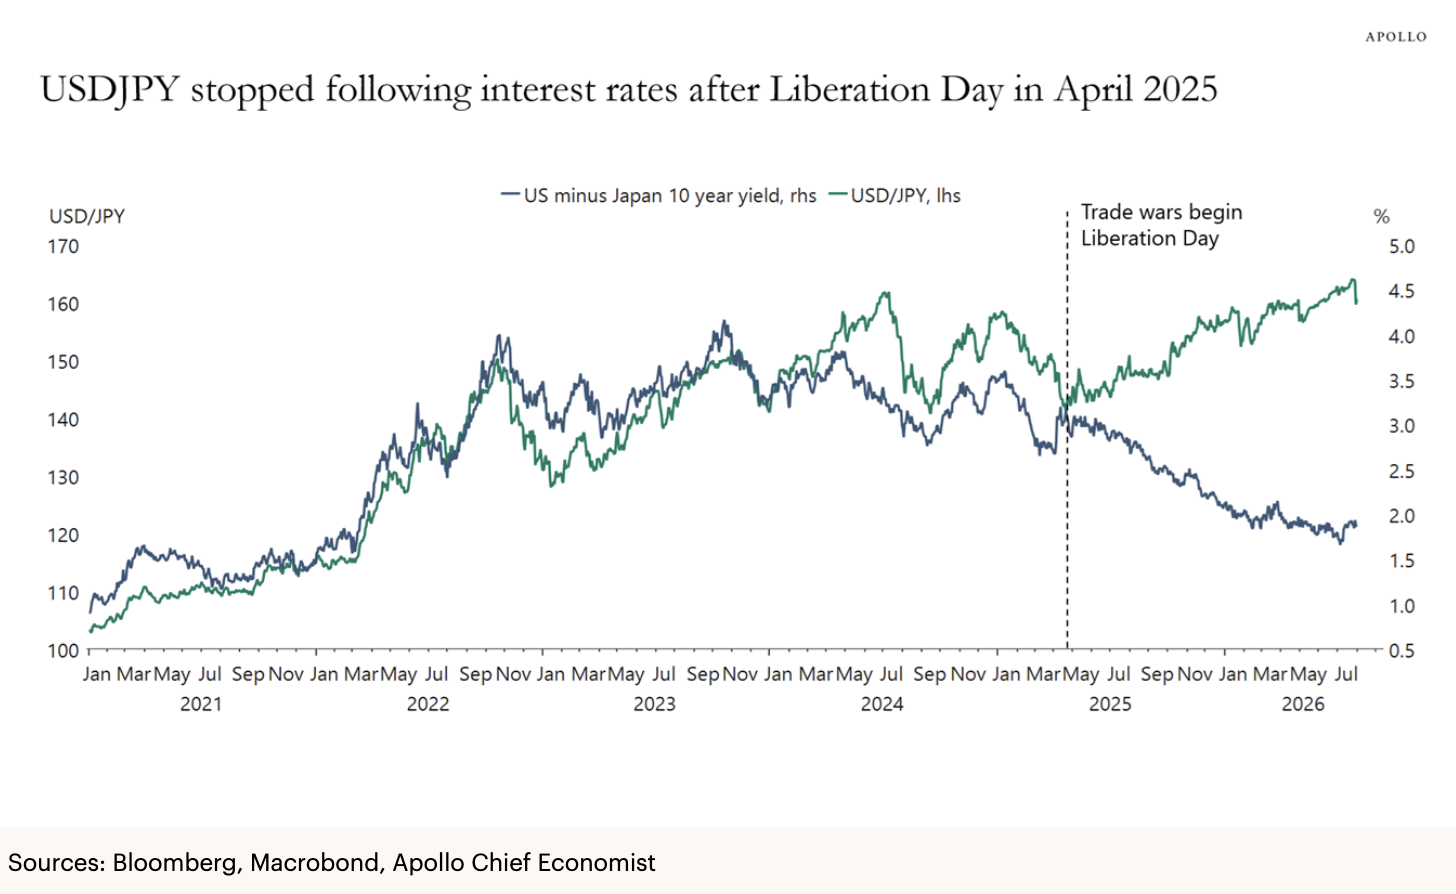
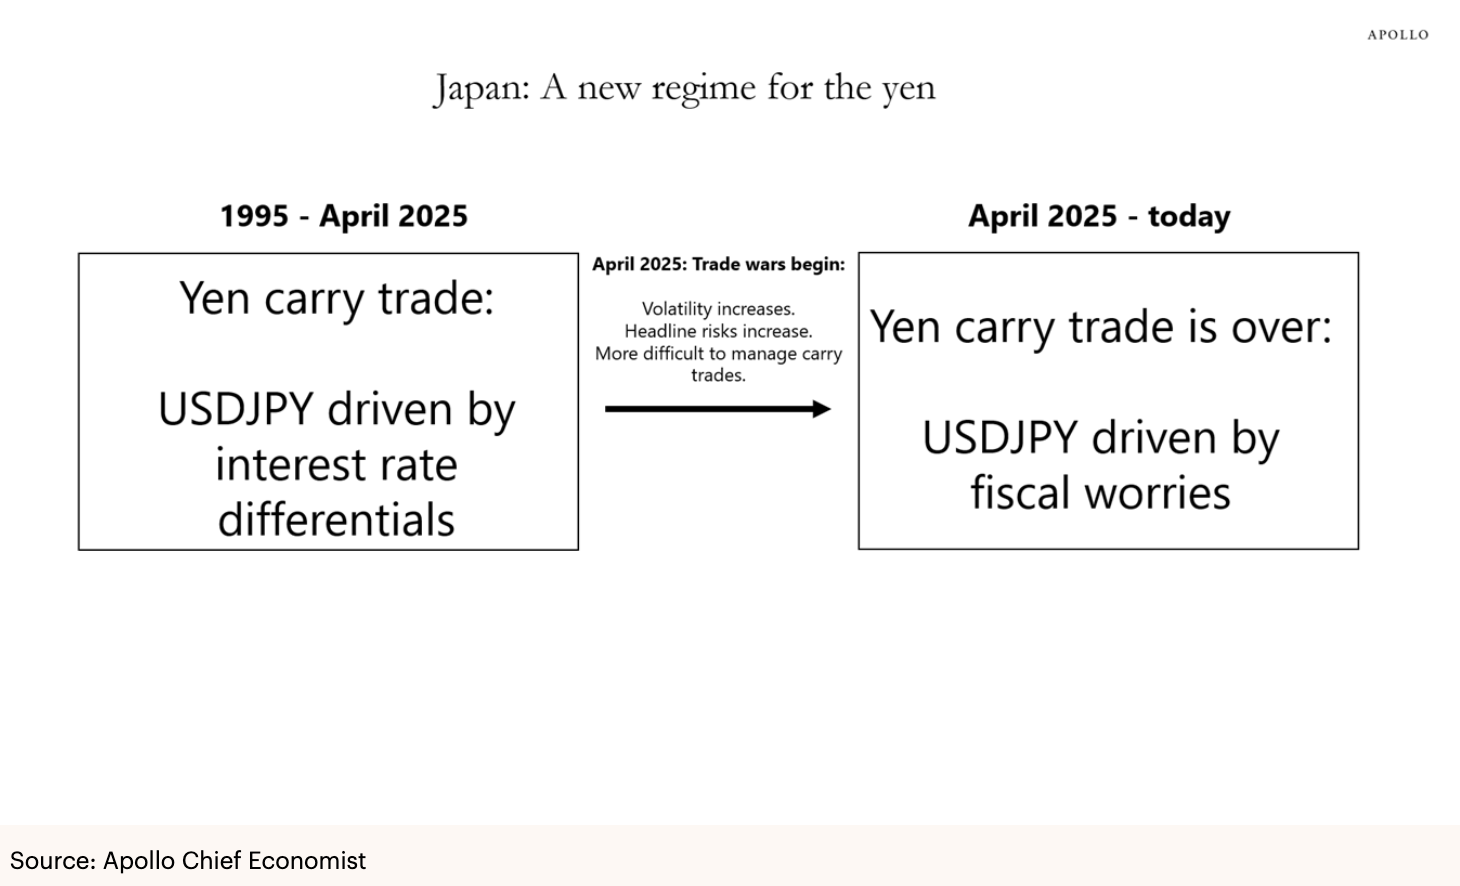
“For decades, the carry trade dominated USD/JPY, as investors borrowed cheaply in yen to buy higher-yielding dollar assets, and the currency moved in lockstep with the US-Japan interest rate differential, see the first chart below.
That link broke down after Liberation Day in April 2025, when trade wars unleashed the kind of volatility that makes carry trades dangerous, since the strategy earns a slow, steady yield that a single sharp move in the yen can wipe out, prompting investors to unwind their positions regardless of the still-wide yield gap, see the second chart below.
With the carry trade's pull now diminished, the currency has taken its cue not from the yield math but from Japan's deteriorating fiscal outlook.
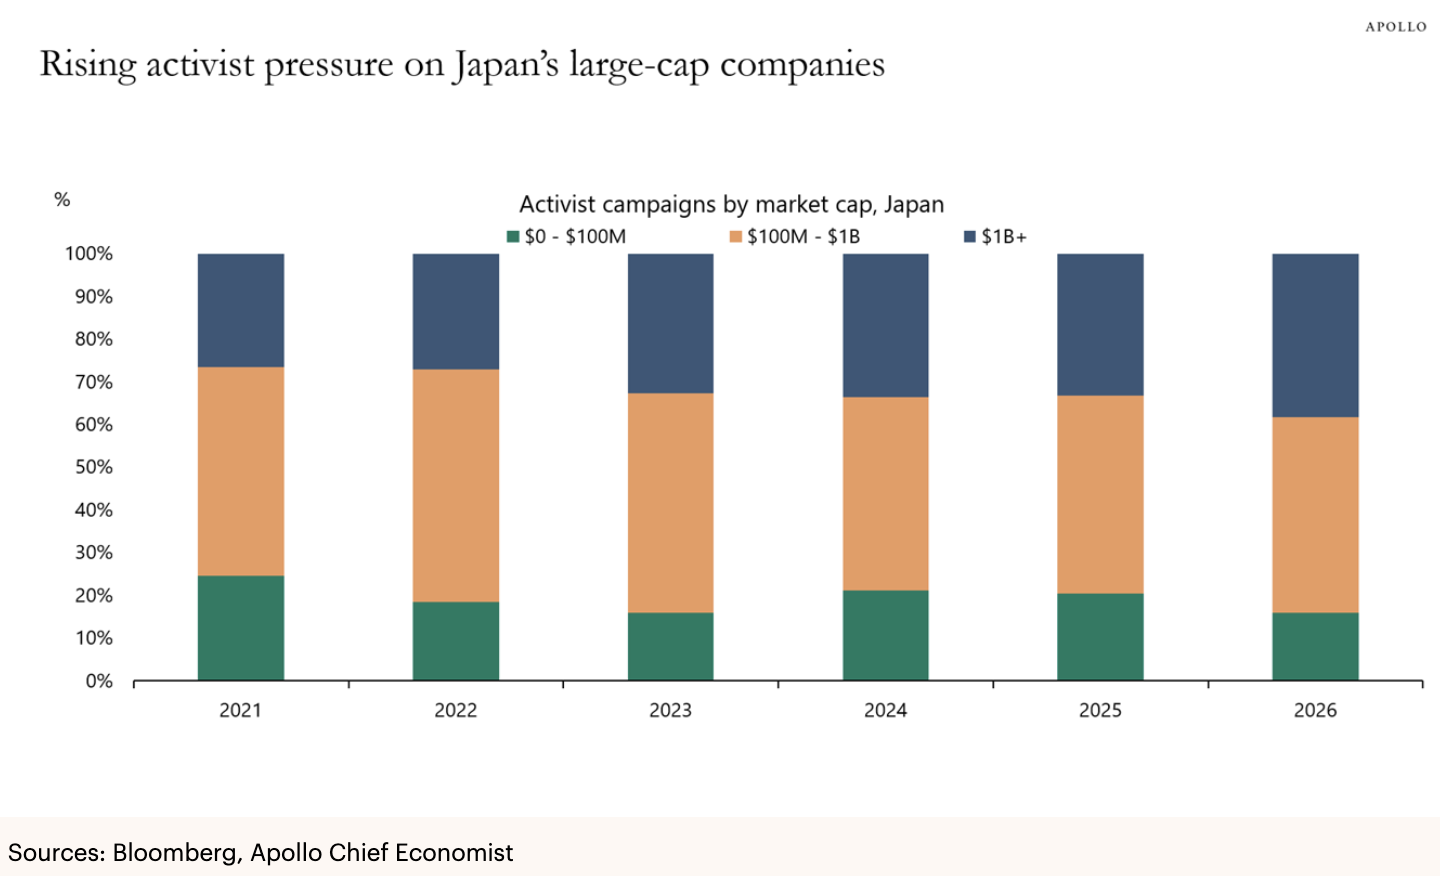
Alongside this currency shift, a deeper transformation is underway in Japanese equities, where corporate governance reform has driven a record rise in shareholder activism and pulled foreign ownership to around a third of the market, see the third and fourth charts below.
The bottom line is that the yen carry trade has broken down, and the yen is no longer a rates story. Until volatility subsides, it will trade on Japan's fiscal outlook rather than the interest rate gap.
For more discussion, see our chart book available here.”
Share this letter on X by clicking here.
Opinions are subject to change. Not a recommendation to buy or sell any security. Please note that the information provided is not recommended for buying or selling any security and is provided for discussion purposes only.
If you like what you are reading, click on the link and share it with a friend (it’s free).
CLICK HERE TO SUBSCRIBE TO ON MY RADAR
Trade Signals: August 6, 2026 Update
Notable This Week
The Yen tells the story of the last week.
Treasury Secretary Scott Bessent intervened to support the Yen, selling US Euro holdings and buying Yen — to keep Japan from dumping its Treasury holdings. That single move tells you a lot about where we are.
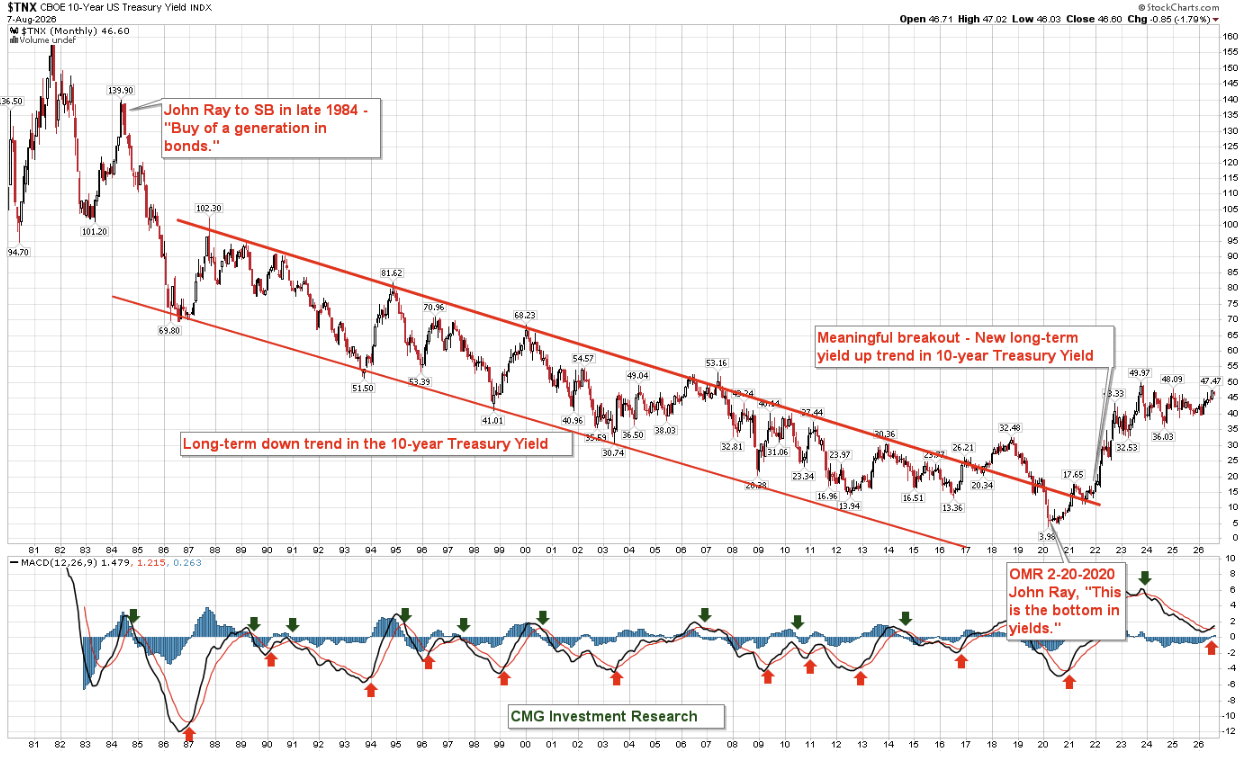
Years of can-kicking have left the system fragile, and we're nearing the end of an 80-year debt accumulation cycle. The chart below makes the problem plain: bond investors have been underwater for more than six years, and the 5% yield level (the 50 line, far right) is closing in. That's the level Bessent is trying to hold the line on.
So far, yields have barely budged since the intervention. But the debt problem isn't isolated — it's here, there, and most everywhere.
I don't think he can hold it.
Source: StockCharts.com, CMG Investment Research (annotations)
US government bond yields remain elevated, but equity markets loved the rescue. One has to wonder how much longer this can go on.
Handicapping the potential:
My 10-year forward return estimate for the S&P 500 cap-weighted index remains stuck between -2% and +2%, before inflation. Most investors auto-buy that cap-weighted index, and that concentration is the problem. I know the market is on a run right now. I see a similar bubble top to 1999-2000. Talk to me in a few years, when those returns get erased.
For value-oriented companies (high free cash flow, high dividend payers), my estimate lands closer to 8% annualized. Again, a similar setup to 1999-2000. And yes, select equities may still perform exceptionally well. Think rifle, not shotgun.
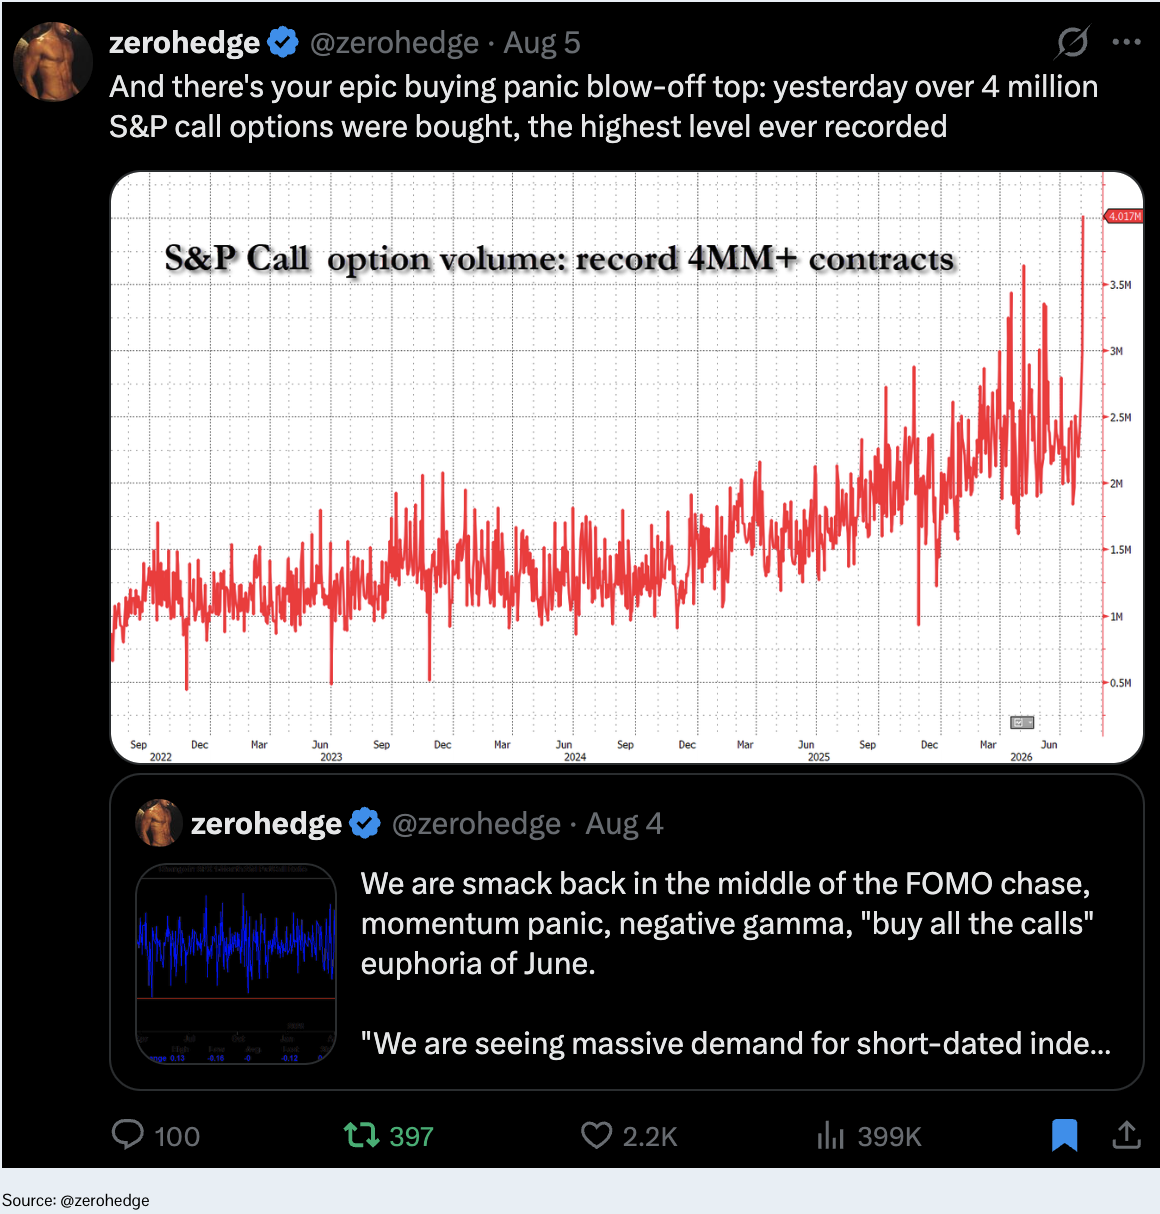
The market remains euphoric, overleveraged, overvalued, and overconcentrated. Sell and/or hedge euphoria; buy panic. Right now, call options are expensive and put options are cheap. The market is telling you something in this next chart:
Not a recommendation for you to do anything. Email me or speak with your advisor to learn about hedging strategies such as selling call options and buying put options.
The Indicators Dashboard is next:
Trade Signals
The Indicators Dashboard - Stocks, Investor Sentiment, Bonds, Commodities, Currencies, and Gold
Valuations and Subsequent 10-year Returns
Supporting Charts with Explanations

TRADE SIGNALS SUBSCRIPTION ACKNOWLEDGEMENT / IMPORTANT DISCLOSURES
About Trade Signals - Trade Signals is a paid subscription service that posts daily, weekly, and monthly market trends (and more). Free for CMG clients. Not a recommendation to buy or sell any security. For discussion purposes only.
The views expressed herein are solely those of Steve Blumenthal as of the date of this report and are subject to change without notice. Please note that the information provided is not recommended for buying or selling any security and is provided for discussion purposes only.
Personal Note: The Bus Driver
I read the following this week and totally enjoyed the story. I hope you do too.
On June 4, in Eastlake, Ohio, Denison's baseball team won the Division III College World Series.
Players rushed the field. Coaches embraced. The trophy made its rounds.
Then the chanting started.
"Tom. Tom. Tom. Tom."
Tom Engberg was the bus driver. He wasn't a coach or a member of the staff. He had a commercial driver's license and a hobby he loved. But as the players, still wearing their "National Champions" T-shirts, looked toward the stands and called his name, someone handed him the trophy. He raised it over his head.
Later, Engberg admitted the moment felt surreal. He kept looking around, wondering who the chant was for.
Coach Mike Deegan didn't manufacture that moment. He didn't script it or ask anyone to make Engberg feel included. As one account described it, the players' decision to hand him the trophy was "totally organic." That's a much better measure of culture than anything written on a wall. It's what people choose to do when the game is over, and nobody is telling them what comes next.
The moment actually began months earlier.
Deegan requested Engberg every time the Big Red traveled. From the first road trip, he struck up conversations with him and treated the role of bus driver with the same seriousness he brought to the game itself. "You could just feel Tom's vested interest," Deegan said. "You could feel him wanting to do his part, and his care level for the players and coaches was something hard to articulate, but it's just something you felt."
Engberg responded in kind. He climbed on top of the bus behind the outfield fence to watch games. He read Deegan's book. Before the College World Series, he even asked if he could address the team before they got off the bus.
None of that appeared anywhere in his job description.
Engberg grew up loving baseball. Lost his love of it for years due to the 1994 strike, the lockouts, millionaires who didn't run out ground balls. He grew cynical and stopped watching. Then he watched this team. Forty-four consecutive wins. Playing with a smile regardless of the score. Rallying from five runs down in the deciding World Series game.
"It just brought me back to when I was a kid. I was like, "Oh, my God, this is so inspiring,"" he said.
It's easy to think about a program in terms of players, coaches and trainers, while everyone else fades into the background. Deegan never seemed to make that distinction, and over time his players stopped making it too. By the time Denison won the national championship, inviting Engberg into the celebration wasn't something they had to think about. It was simply what they did.
Most leaders think about stakeholders narrowly. The players matter. The coaches matter. Maybe the trainers. The bus driver gets a thank-you at the end of the season — if you remember. Deegan didn't think that way. And the players absorbed it so completely that when the moment arrived, their first instinct was to pull Tom in. Before speeches. Before photographs. Before any of it. You don't get that by asking for it. You get it by building a culture where no one has to be told.
When a culture is truly great, it pulls people in. Just like Tom was pulled into this championship team. A cynic walked onto that bus in February. He left Eastlake after midnight with a championship team, already looking forward to next season.
Deegan didn't invest in Tom to get something back. He treated Tom like a person from the first road trip in February. That’s the standard he holds regardless of who's watching.
You don't build that kind of culture by trying to build that kind of culture. You build it by deciding that everyone who shows up for you gets your full attention and your genuine respect.” Source: The Daily Coach, August 3, 2026
How about the impact Deegan has on young people? And older people too…
Wishing you a wonderful weekend.
Kind regards,
Steve
CLICK HERE TO SUBSCRIBE TO ON MY RADAR - IT’S FREE
You can share this letter on X by clicking here.
You can share this letter on LinkedIn by clicking here.
Subscribe to OMR for free by clicking the photo.
Stephen B. Blumenthal
Executive Chairman & CIO
CMG Capital Management Group, Inc.
75 Valley Stream Parkway, Suite 201,
Malvern, PA 19355
CMG Customer Relationship Summary (Form CRS)
Metric-Financial, LLC Customer Relationship Summary (Form CRS)

Stephen Blumenthal founded CMG Capital Management Group in 1992 and serves today as its Executive Chairman and CIO. Steve authors a free weekly e-letter entitled, “On My Radar.” Steve shares his views on macroeconomic research, valuations, portfolio construction, asset allocation and risk management. Author of Forbes Book: On My Radar, Navigating Stock Market Cycles.
Follow Steve on X @SBlumenthalCMG and LinkedIn.
IMPORTANT DISCLOSURE INFORMATION
This document is prepared by CMG Capital Management Group, Inc. (“CMG”) and is circulated for informational and educational purposes only. There is no consideration given to the specific investment needs, objectives, or tolerances of any of the recipients. Additionally, CMG’s actual investment positions may, and often will, vary from its conclusions discussed herein based on any number of factors, such as client investment restrictions, portfolio rebalancing, and transaction costs, among others. Recipients should consult their own advisors, including tax advisors, before making any investment decision. This material is for informational and educational purposes only and is not an offer to sell or the solicitation of an offer to buy the securities or other instruments mentioned. This material does not constitute a personal recommendation or take into account the particular investment objectives, financial situations, or needs of individual investors which are necessary considerations before making any investment decision. Investors should consider whether any advice or recommendation in this research is suitable for their particular circumstances and, where appropriate, seek professional advice, including legal, tax, accounting, investment, or other advice. The views expressed herein are solely those of Steve Blumenthal as of the date of this report and are subject to change without notice.
Investing involves risk.
This letter may contain forward-looking statements relating to the objectives, opportunities, and future performance of the various investment markets, indices, and investments. Forward-looking statements may be identified by the use of such words as; “believe,” anticipate,” “planned,” “potential,” and other similar terms. Examples of forward-looking statements include, but are not limited to, estimates with respect to financial condition, results of operations, and success or lack of success of any particular market, index, investment, or investment strategy. All are subject to various factors, including, but not limited to, general and local economic conditions, changing levels of competition within certain industries and markets, changes in legislation or regulation, Federal Reserve policy, and other economic, competitive, governmental, regulatory, and technological factors affecting markets, indices, investments, investment strategy and portfolio positioning that could cause actual results to differ materially from projected results. Such statements are forward-looking in nature and involve a number of known and unknown risks, uncertainties, and other factors, and accordingly, actual results may differ materially from those reflected or contemplated in such forward-looking statements. Investors are cautioned not to place undue reliance on any forward-looking statements or examples. All statements made herein speak only as of the date that they were made. Investing is inherently risky and all investing involves the potential risk of loss.
Past performance does not guarantee or indicate future results. Different types of investments involve varying degrees of risk, and there can be no assurance that the future performance of any specific investment, investment strategy, or product (including the investments and/or investment strategies recommended or undertaken by CMG), or any non-investment related content, made reference to directly or indirectly in this commentary will be profitable, equal any corresponding indicated historical performance level(s), be suitable for your portfolio or individual situation or prove successful. Due to various factors, including changing market conditions and/or applicable laws, the content may no longer be reflective of current opinions or positions. Moreover, you should not assume that any discussion or information contained in this commentary serves as the receipt of, or as a substitute for, personalized investment advice from CMG. Please remember to contact CMG, in writing, if there are any changes in your personal/financial situation or investment objectives for the purpose of reviewing/evaluating/revising our previous recommendations and/or services, or if you would like to impose, add, or to modify any reasonable restrictions to our investment advisory services. Unless, and until, you notify us, in writing, to the contrary, we shall continue to provide services as we do currently. CMG is neither a law firm, nor a certified public accounting firm, and no portion of the commentary content should be construed as legal or accounting advice.
No portion of the content should be construed as an offer or solicitation for the purchase or sale of any security. References to specific securities, investment programs or funds are for illustrative purposes only and are not intended to be, and should not be interpreted as recommendations to purchase or sell such securities.
This presentation does not discuss, directly or indirectly, the amount of the profits or losses realized or unrealized, by any CMG client from any specific funds or securities. Please note: In the event that CMG references performance results for an actual CMG portfolio, the results are reported net of advisory fees and inclusive of dividends. The performance referenced is that as determined and/or provided directly by the referenced funds and/or publishers, has not been independently verified, and does not reflect the performance of any specific CMG client. CMG clients may have experienced materially different performance based upon various factors during the corresponding time periods. See in links provided citing limitations of hypothetical back-tested information. Past performance cannot predict or guarantee future performance. Not a recommendation to buy or sell. Please talk to your advisor.
Information herein has been obtained from sources believed to be reliable, but we do not warrant its accuracy. This document is general communication and is provided for informational and/or educational purposes only. None of the content should be viewed as a suggestion that you take or refrain from taking any action nor as a recommendation for any specific investment product, strategy, or other such purposes.
In a rising interest rate environment, the value of fixed-income securities generally declines, and conversely, in a falling interest rate environment, the value of fixed-income securities generally increases. High-yield securities may be subject to heightened market, interest rate, or credit risk and should not be purchased solely because of the stated yield. Ratings are measured on a scale that ranges from AAA or Aaa (highest) to D or C (lowest). Investment-grade investments are those rated from highest down to BBB- or Baa3.
NOT FDIC INSURED. MAY LOSE VALUE. NO BANK GUARANTEE.
Certain information contained herein has been obtained from third-party sources believed to be reliable, but we cannot guarantee its accuracy or completeness.
In the event that there has been a change in an individual’s investment objective or financial situation, he/she is encouraged to consult with his/her investment professional.
Written Disclosure Statement. CMG is an SEC-registered investment adviser located in Malvern, Pennsylvania. Stephen B. Blumenthal is CMG’s founder and CEO. Please note: The above views are those of CMG and its CEO, Stephen Blumenthal, and do not reflect those of any sub-advisor that CMG may engage to manage any CMG strategy, or exclusively determines any internal strategy employed by CMG. A copy of CMG’s current written disclosure statement discussing advisory services and fees is available upon request or via CMG’s internet web site at www.cmgwealth.com/disclosures. CMG is committed to protecting your personal information. Click here to review CMG’s privacy policies.
See CMG Disclosures at the bottom of this page.
For more information about NDR, please visit at www.ndr.com.
NDR, Inc. (NDR), d.b.a. Ned Davis Research Group (NDRG), any NDRG affiliates or employees, or any third-party data provider, shall not have any liability for any loss sustained by anyone who has relied on the information contained in any NDRG publication. The data and analysis contained herein are provided "as is." NDRG disclaims any and all express or implied warranties, including, but not limited to, any warranties of merchantability, suitability or fitness for a particular purpose or use. NDRG's past recommendations and model results are not a guarantee of future results. This communication reflects our analysts' opinions as of the date of this communication and will not necessarily be updated as views or information change. All opinions expressed herein are subject to change without notice. NDRG or its affiliated companies or their respective shareholders, directors, officers and/or employees, may have long or short positions in the securities discussed herein and may purchase or sell such securities without notice. For NDRG's important additional disclaimers, refer to www.ndr.com/invest/public/copyright.html. Further distribution prohibited without prior permission. Copyright 2025 © NDR, Inc. All rights reserved.