On My Radar - Big Beautiful Gold

July 5, 2025
By Steve Blumenthal
“When countries have too much debt, lowering interest rates and devaluing the currency that the debt is denominated in is the preferred path government policy makers are most likely to take, so it pays to bet on it happening."
— Ray Dalio, Founder, CIO Mentor, and Member of the Bridgewater Board Source
Happy 4th of July! I hope the weather where you are is as nice as it is in suburban Philadelphia today. It’s early, the sun is rising, and graying dog Shiloh is next to me on our back patio. With coffee in hand, I’m checking in happy. I hope your day finds you slowing down and enjoying the people (and animals) you love most.
I had planned to share the mid-year valuation metrics with you, but let’s postpone that for next week. Just one glance at the price-to-sales ratio (below: Mid-year Valuations Part I) reveals that the market remains overvalued. The median PE is a lofty 28, suggesting that the fair value level in the S&P 500 is around 4,200.
You are likely aware by now that the One Big Beautiful Bill has passed, and by the time you read this post, it will have been signed into law.
We can argue about the particulars, but let’s step above that and look at the big picture. We have issues, but none bigger than the debt crisis we face. Let’s examine this from the perspective of an investor, rather than debating the specifics. We could have a painful debate, but it won’t change the reality of what is.
The policy path “politicans are most likely to take” has been taken. And it “pays to bet on it happening.”
Grab that coffee and find your favorite beach chair. Our mission? To get from here to the other side of the coming reset with our wealth intact. To achieve this, we must avoid “painful disruptions” and outpace inflation. Sunglasses on. Let’s go.
On My Radar:
Mid-Year Valuations Part I
Printing and Devaluing Money
The Most Important Principle to Keep in Mind When Thinking About Large Government Debts and Deficits, Ray Dalio
Basel III - Got Gold?
Trade Signals: Update - July 3, 2025
Personal Note: Happy Fourth of July
OMR is for informational and educational purposes only. No consideration is given to your specific investment needs, objectives, or tolerances.
Please see the Important Disclosures at the bottom of this page. Reminder: This is not a recommendation to buy or sell any security. My views may change at any time. The information is for discussion and educational purposes only.
If you like what you are reading, you can subscribe for free.

Mid-year Valuations Part I
More on this next week. Following are a few charts I’d like to share with you.
The first looks at a combination of Trailing PE, Forward PE, CAPE, P/B (price-to-book), EV/EBITDA, the Q Ratio, and Market Cap to GDP. Sources referenced in the chart.

Price to Sales
From Bloomberg’s John Arthur - The S&P 500 is back trading at more than three times sales, close to a record:
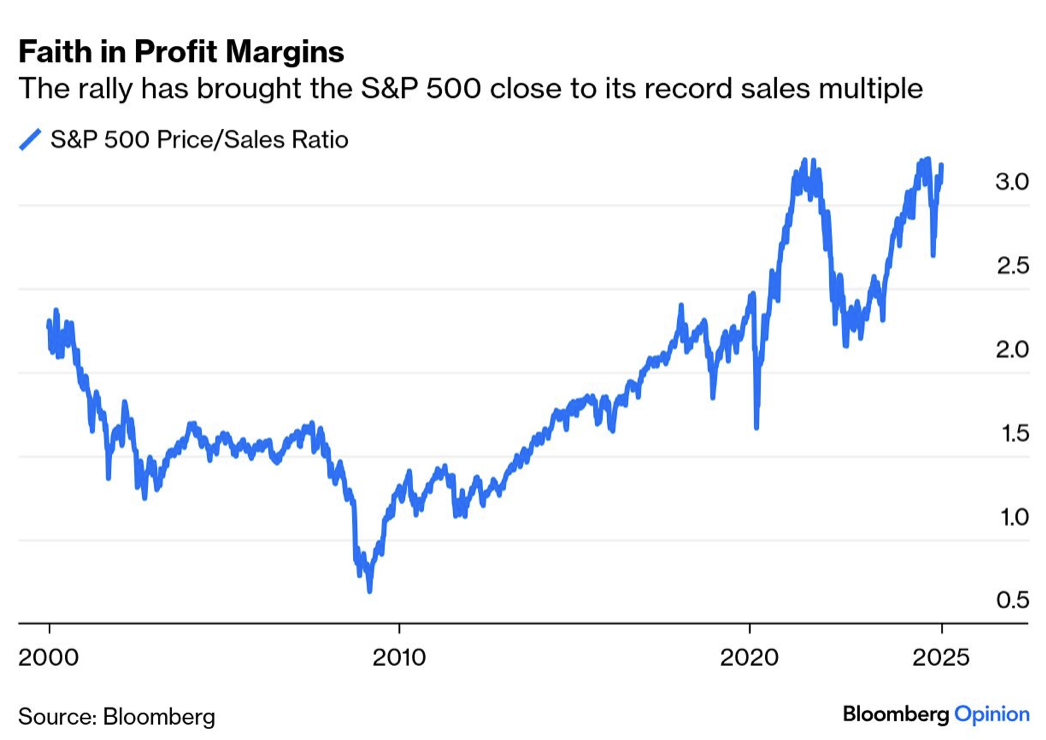
Source: Bloomberg, John Authers
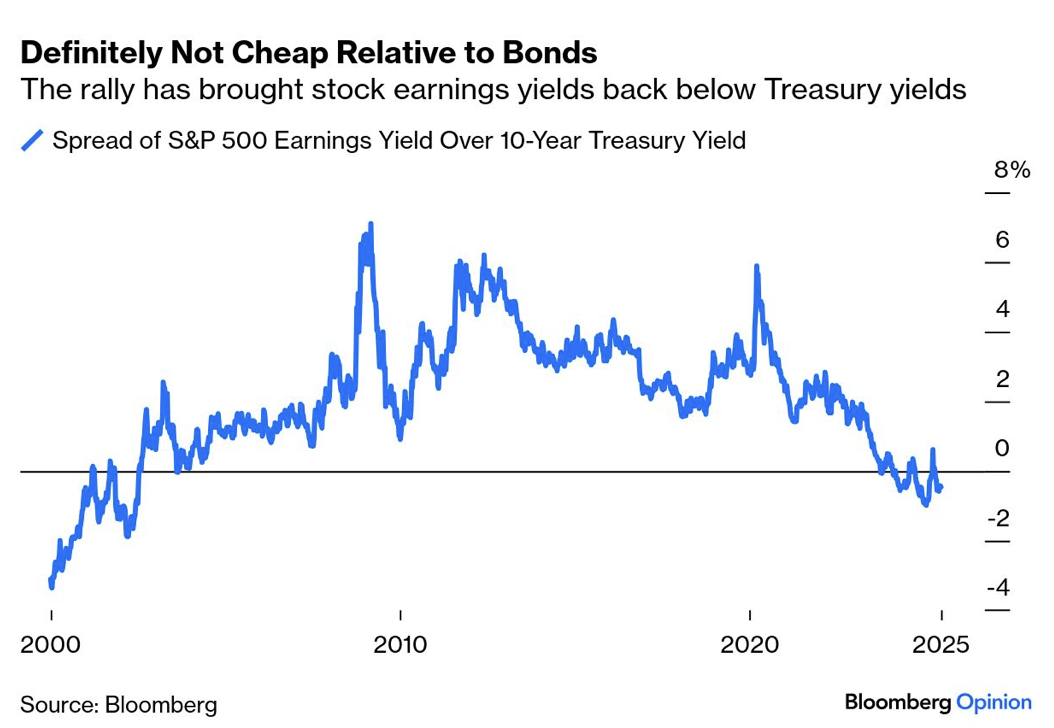
S&P 500 Earnings Yield vs. Bonds
Stocks are “Definitely Not Cheap Relative to Bonds.” Source: Bloomberg’s John Auther.
Printing and Devaluing Money
History tells us that governments will attempt to print their way out of debt crises. Tightening the budget belt doesn’t get one reelected. The passing of the Big Bill is another step in the process. And a big one at that.
There is no reason to believe that this time will be any different.
I read the following from Ray Dalio on X, July 2, 2025 (emphasis mine), “After spending time in Washington, DC discussing the budget deficit with senior people on both sides of the aisle, it’s clear to me that we are unlikely to change the debt trajectory we’re on and avoid the painful consequences. While virtually everyone agrees on the need to address our debt problem in a balanced way that includes tax increases and cuts to benefits, they also agree that they cannot speak up because politics have become absolutist.”
The next day, July 3rd, the One Big Beautiful Bill passed. Beauty, of course, is in the eye of the beholder. Gold sees beauty. Bitcoin sees beauty.
Let’s look at some math courtesy of the oracle on debt, Ray Dalio (bold emphasis mine):
“Now that the budget bill has passed Congress, we can see what the projections look like for deficits, government debt, and debt service expenses. In brief, the bill is expected to lead to spending of about $7 trillion a year with inflows of about $5 trillion a year, so the debt, which is now about 6x of the money taken in, 100 percent of GDP, and about $230,000 per American family, will rise over ten years to about 7.5x the money taken in, 130 percent of GDP, and $425,000 per family. That will increase interest and principal payments on the debt from about $10 trillion ($1 trillion in interest, $9 trillion in principal) to about $18 trillion (of which $2 trillion is interest payments), which will lead to either a big squeezing out (and cutting off) of spending and/or unimaginable tax increases, or a lot of printing and devaluing of money…” Source: X.com/RayDalio
I bookmarked Dalio’s quote earlier in the week to share with you: “After spending time in Washington, DC discussing the budget deficit with senior people on both sides of the aisle, it’s clear to me that we are unlikely to change the debt trajectory we’re on and avoid the painful consequences.”
Frankly, I was a bit surprised to see that the bill passed the very next day.
Picture that you and I are all sitting at the poker table. We know the cards we have, and we look around to read the room. The government is the big mark at the table. We know from history the tendencies of elected officials. This was an easy read. And it will continue to be an easy read.
Do you remember when short-term interest rates were less than 1%? Of course you do. The ultra-low interest rates enabled the government to cover the interest costs on its debt. What we should have done is issue 50-year bonds at 2% but we didn’t. We chose to issue short-term debt, and now those interest rates are over 4%.
The government pays an interest rate to the holders of its nearly $36.1 trillion in outstanding debt. Short-term debt is rolling over and must be refinanced at higher rates. Approximately $7.6 trillion of U.S. government debt, representing about 31% of the total outstanding debt, is due to mature and roll over in 2025. The current Fed Funds rate is 4.33%. It was 2% just a few years ago.
As debt increases and interest rates rise, the interest expense we taxpayers are responsible for rises and becomes a greater portion of the government’s budget. Here’s a look with data from the Treasury Department and Congressional Budget Office (CBO):
Growth in Interest Costs on U.S. Federal Debt (2014–2024).
2014: $416 billion
2015: $402 billion
2016: $433 billion
2017: $459 billion
2018: $523 billion
2019: $575 billion
2020: $523 billion
2021: $562 billion
2022: $719 billion
2023: $883 billion
2024: $1,130 billion
SB estimate 2025: $1,250 billion, which is $1.25 trillion, and 25% of annual U.S. tax revenue
To put this into perspective, the U.S. government collects approximately $5 trillion in tax revenue per year and, in 2025, is paying roughly $1.25 trillion in interest costs—approximately 25% of the government’s total income. And the government is increasing the amount of outstanding debt by $2 trillion per year. With the debt ceiling increased by $5 trillion the total outstanding debt will go from $36.1 trillion to $40 trillion in two years. $40 trillion times 4.5% is $1.8 trillion in interest expense. If rates are at 5% it is $2 trillion in interest costs.
Looked at another way, if you earn $100,000 per year and pay $25,000 per year to cover the interest on the money you have borrowed, that’s 25% of your income out the door, leaving you less money to spend on other things. However, remember that you are spending $120,000 per year and need to borrow an additional $20,000 from somewhere.
A Debt Death Spiral
Defined: A debt death spiral refers to a vicious cycle in which a borrower—typically a government, but sometimes a corporation or individual—accumulates debt at an accelerating rate, leading to unsustainable financial conditions that can result in default, bankruptcy, or severe economic disruption. The term describes a self-reinforcing process where rising debt levels increase interest costs, which in turn require more borrowing to cover, further exacerbating the debt burden and reducing the borrower’s ability to manage or repay the debt. Rising interest rates and increased debt are contributing to the growth of this number. It is going to worsen. No wonder Trump is screaming at Powell. We are in the early innings of a debt death spiral.
I’ll say this now and repeat it in future letters: At some point in the not-too-distant future, the government will attempt to control short-term interest rates by keeping them at a low fixed yield, despite market forces that will drive the yields on the long end of the yield curve higher. Their objective is to keep that $ 1.25 trillion in annual interest expense as low as possible. It will work, temporarily. Then the system breaks, and elected officials will hold hands and make the hard decisions that need to be made.
“A global grand restructuring,” as Treasury Secretary Scott Bessent calls it. The U.S. is asset-rich. I believe we will eventually see higher taxes, the sale of government assets such as land or mineral rights, gold visas, increased tariff revenues, spending cuts in select areas, and the printing of money if we head into a deflationary tailspin. Or, a combination of all of the above.
The immediate read on the outcome of the new law is that we will incur $5 trillion in new debt issuance over the coming few years. That means money printing, which debases the currency.
We are in the very early innings of a debt death spiral. There will be no fiscal restraint until the bond vigilantes say “NO MORE.”
The patient remains ill. The doctor is saying, cut out the sugars and go on a diet. Instead, we are injecting more sugar into his system. The knuckleheads in D.C. should be sued for malpractice.
Bottom line: All roads continue to point to inflation..
What wins in this environment? Gold sits high on the list. And believe Bitcoin will play a role in the next form of currency that emerges from this mess as investors lose trust in the dollar. Gold, metals, agriculture, commodities, and energy. Select equities and real estate tend to inflate in price as well. The key is that tangible assets retain their intrinsic value and often experience price increases corresponding to inflation. Fixed-rate bonds, especially longer maturities, underperform.
Bretton Woods III
Unlike the original Bretton Woods system (1944–1971) or the informal Bretton Woods II concept, which described the post-1971 global monetary arrangement centered on the U.S. dollar and China's recycling of trade surpluses into U.S. debt. Instead, "Bretton Woods III" is a term introduced by financial analysts, notably Zoltan Pozsar of Credit Suisse in 2022, to describe a potential shift in the global monetary system driven by geopolitical and economic changes.
Scott Bessent has predicted a "grand global economic reordering" that he believes will occur within the next few years, potentially during the Trump administration (2025–2029). He has expressed a desire to play a central role in shaping this transformation, stating, “We are going to have to have some kind of a grand global economic reordering. I’d like to be a part of it. I’ve studied this.” Source
Bessent compares the scale of this reordering to historical milestones, such as the Bretton Woods agreement (1944) or the Treaty of Versailles, suggesting a fundamental restructuring of global trade, finance, and economic power dynamics. He envisions a "Mar-a-Lago accord" that would be more complex than the 1980s Plaza and Louvre accords, involving military, geopolitical, and trade partnerships, particularly to address competition with China.
Back to the poker table. We investors are looking to understand the room and play the best hands we can play.
And the U.S. is not alone in this debt end-game cycle. While the dollar may do relatively well against other developed market currencies, all will likely lose to gold.
Bottom ine: The study of history reveals that politicians always choose to print money. And that happened again this week. “This printing and devaluing is not good for those holding bonds as a storehold of wealth, and what’s bad for bonds and US credit markets is bad for everyone because the US Treasury market is the backbone of all capital markets, which are the backbones of our economic and social conditions. Unless this path is soon rectified to bring the budget deficit from roughly 7% of GDP to about 3% by making adjustments to spending, taxes, and interest rates, big, painful disruptions will likely occur.” Wrote Ray Dalio.
“Soon rectified” looks to be NOT SOON. Houston, we have a problem.
The Most Important Principle to Keep in Mind When Thinking About Large Government Debts and Deficits, Ray Dalio
Source: LinkedIn
At the moment of my writing, we know that the projections are for big deficits and big increases in government debt and debt service expenses ahead. (You can see these numbers in my writings, including my new book How Countries Go Broke: The Big Cycle; I also shared last week why I believe the political system in the US won’t be able to get its debt problems under control). We know how debt service costs (paying back interest and principal) will grow rapidly to squeeze out spending, and we also know that, at best, it is highly doubtful that there will be an increase in demand for the debt commensurate with the supply that needs to be sold. I laid out in detail what I think the implications of all this are in How Countries Go Broke, where I offer a description of the mechanics behind my thinking. Others have stress tested it, and thus far there has been almost total agreement that the picture I am painting is accurate. Of course, that doesn’t mean that I can’t be wrong. It’s up to you to decide what’s likely true. I am just giving you and others my thinking to assess.
My Principles
As I explained, based on the experiences I have had and the research I have done over the last 50+ years of investing, I have developed and written down principles that help me anticipate events so that I can successfully bet on them. I am now at a stage in my life in which I want to pass along these principles to help others. Also, I believe that in order to understand what is happening and what’s likely to happen, one needs to understand how the mechanics work, so I am also trying to explain my understanding of the mechanics behind the principles. Here are a few more principles along with the explanations of how I believe the mechanics work. I believe that the following are true and good principles:
The most hidden way, hence the most preferred and common way, for government policy makers to deal with having too much debt is to lower both real interest rates and real currency rates.
While lowering interest and currency rates in response to too much debt and the problems it creates can be a short-term palliative, it can reduce demand for the currency and the debt and create longer-term problems because it reduces the returns of holding the currency/debt, which reduces the value of the debt as a storehold of wealth. And over time, it usually leads to higher debts since the lower real interest rates are stimulative, making the problem worse.
In summary, when there is too much debt, interest rates and currency rates tend to be driven down.
Is that good or bad for economic conditions?
It’s both, tending to be good and well-received in the short term but bad and leading to worse problems down the road. Lowering real interest rates and real currency exchange rates is…
…beneficial over the short term because it is stimulative and tends to lift asset prices…
…while it is…
…detrimental over the intermediate and long term because a) it gives holders of these assets lower real returns (because of the currency devaluation and the lower yield), b) it produces higher inflation rates, and c) it leads to greater debt.
In any case, it certainly doesn’t avoid the painful consequences of overspending and getting deeper into debt. Here are the mechanics of how it works:
When interest rates fall, borrower-debtors benefit because it reduces debt service costs, making it cheaper to borrow and buy things, which raises investment asset prices and stimulates growth. That’s why most everyone is happy with lowering interest rates over the short term.
But at the same time, those price increases hide the bad consequences of lowering interest rates to undesirably low levels, which is detrimental to lenders and creditors. These things are true because reducing interest rates (most importantly real interest rates), including central banks pushing bond yields down, raises the prices of bonds and most other assets, which leads to lower future returns (for example, when interest rates went to negative levels, bond prices went up). It also leads to more debt, which creates bigger debt problems down the road. So, lender-creditors get less return on the debt assets they hold, and more debt is created.
Lower real interest rates also tend to lower the real value of the currency because it makes the currency/credit yield lower relative to other countries’ alternatives. That brings me to my explanation of how lowering currency rates is the preferred and most common way for government policy makers to deal with having too much debt.
Lower currency rates are preferred and seem good when explained by policy makers to their constituents for two reasons:
1) Lower currency exchange rates make countries’ goods and services less expensive relative to those from countries that have rising currencies, so they stimulate economic activity and foster rising asset prices (particularly in nominal terms), and…
2) …they make it easier to pay off debt in a way that is more painful to foreigners holding the debt assets than for the countries’ own citizens. That is because the alternative “hard money” approach requires tighter money and credit, which keeps real interest rates higher, which constricts spending and typically means painful service cuts and/or tax increases and tougher lending conditions that citizens don’t like. In contrast, as I will explain below, lower currency rates are a “hidden” way of paying debts because most people don’t realize that their wealth is going down.
A lower currency rate also typically raises the value of foreign assets when looked at through the lens of the depreciated currency.
For example, if the dollar devalues by 20% percent, US investors will be able to pay foreign holders of dollar-denominated debt with money that is worth 20% less (i.e., the foreign holders of the debt assets will have currency losses of 20%). What is less apparent and harmful about a weaker currency is that those with the weaker currency have less buying power and borrowing power—less buying power because their currency goes less far and less borrowing power because buyers of debt assets don't want to buy debt assets (i.e., promises to receive money) or money when they believe the value of the money the debt is denominated in (and the money itself) is going down. The reason this isn’t apparent is because most people in the country whose currency is being devalued (e.g., Americans dealing in dollars) don’t see their buying power and wealth decline because they measure the value of their assets in their own currency, which gives the illusion that their assets are going up even though the currency they are valued in is going down. For example, if the dollar falls by 20%, US investors won’t directly see that they lost 20% in their buying power of foreign goods and services if they focus only on the fact that the assets they own have gone up in dollars. However, for foreign holders of US dollar-denominated debt, it will be obvious and painful. As they increasingly worry about this, they hedge (sell) the currency that the debt is in and/or sell out of the debts, leading to more weakness in the currency and/or the debt.
In summary, looking only through the lens of one’s own currency clearly creates a distorted perspective. For example, if the price of something (e.g., gold) goes up by 20% in dollars, we see that as the price of that thing going up rather than the value of dollars going down. The fact that most people have this distorted perspective is what makes these ways of dealing with having too much debt “hidden” and more politically acceptable than the alternatives.
This way of looking at things has changed a lot over the years, especially from when people were accustomed to there being a gold-backed monetary system to today when they are used to a fiat/paper money monetary system (i.e., one in which money is not backed by gold or any hard asset, which became the case after Nixon de-linked the dollar from gold in 1971). When money existed as paper notes that were claims on gold (let’s call this gold-backed money), people viewed the value of paper money as rising and falling. Its value almost always fell, and the only question was whether it fell faster than the interest rates one received by holding the fiat currency in a debt instrument. Now that the world has gotten used to viewing prices through the lens of fiat/paper money, they have the reverse view—they view the prices of things going up rather than the value of money going down.
Because a) the prices of things in gold-backed money and b) the quantity of gold-backed money have historically been much more stable than a) the prices of things in fiat/paper money and b) the quantity of fiat/paper money, I think that viewing the prices of things in gold-backed money is probably the more accurate way to view things. Apparently, central banks have a similar perspective because gold has become the second largest money (reserve asset) that they own after dollars and ahead of euros and yen, partly for these reasons and partly because gold is at less risk of being confiscated.
The magnitude of the declines in the fiat currency and the real interest rate as well as the magnitude of the gains in the non-fiat monies (e.g., gold, bitcoin, silver, etc.) have historically been, and logically should be, a function of their relative supplies and demands. For example, big debts that can’t be supported with hard money lead to big easings of money and credit, which lead to big declines in both real interest rates and the real currency rates. The most recent major period when this happened was during the stagflationary period from 1971 until 1981, and it caused big shifts in wealth, financial markets, economies, and political circumstances. Based on the existing sizes of debts and deficits (not only in the US, but also in most fiat-currency countries), the potential for similar very big shifts exists in the years ahead.
Regardless of whether that is right or not, it appears indisputable that the magnitudes of the debt and budget issues are very large. In such times, it’s good to have hard money. As of now and for many centuries across the world, gold has been hard money. Much more recently, some cryptocurrencies have been viewed as hard currencies. For reasons I won’t digress into again, I prefer gold, though I do have some crypto.
How Much Gold Should One Have?
While I’m not trying to give you advice on specific investments, I will share the principles that help inform my perspective on this question. When thinking about what amount of gold relative to bonds I want to have, I think of their relative supplies and demands and the relative costs and returns of holding them. For example, with Treasury bonds now giving about a 4.5% interest rate and gold giving a 0% interest rate, it is logical to prefer to hold gold if one thinks its price will rise by more than 4.5% over the next year—and illogical to own gold if one doesn’t think it will rise by 4.5%. To help me make that assessment, I look at the supplies and demands for both.
I also know that gold and bonds diversify each other, so I think about how much of each I should have for good risk control, and I know that a gold holding of roughly 15% can be an effective diversifier over time in that it produces a better return/risk ratio for the portfolio. Inflation-linked bonds do the same, so it is worth considering adding both to a typical portfolio.
I am sharing this perspective with you rather than telling you what I think the markets will do or suggesting exactly how much of each asset you should have because my goal is to “teach you how to fish rather than give you fish.”
PS- If you would like a much more complete view of my investment thinking, I will refer you to this course on my Investment and Economic Principles created by Singapore’s Wealth Management Institute. I promise you that you can easily learn these principles and that they will prove invaluable in your understanding of what’s going on and what’s likely to happen—and what that means for your investment approach. 100% of the people who have taken it said that they would recommend it to others.
The views expressed here are my own and not necessarily those of Bridgewater. Bridgewater Daily Observations is prepared by and is the property of Bridgewater Associates, LP and is circulated for informational and educational purposes only. There is no consideration given to the specific investment needs, objectives, or tolerances of any of the recipients. Additionally, Bridgewater's actual investment positions may, and often will, vary from its conclusions discussed herein based on any number of factors, such as client investment restrictions, portfolio rebalancing and transactions costs, among others. Recipients should consult their own advisors, including tax advisors, before making any investment decision. This material is for informational and educational purposes only and is not an offer to sell or the solicitation of an offer to buy the securities or other instruments mentioned. See the list of sources and complete disclosures on Dalio’s LinkedIn page here: Source: LinkedIn
Basel III - Got Gold?
I had a fun exchange this week with a very bright friend. He shared with me something I knew was coming that became effective in the U.S. on July 1, 2025.
Following Dalio’s observations about gold, let’s add to his bullish views on gold with the July 1 Basel III rule, making gold a Tier 1 banking asset. The following is generated with assistance from Claude AI.
Key Changes to Gold's Regulatory Status
Basel III reclassified gold from a Tier 3 asset to a Tier 1 asset, alongside cash and government bonds Basel III and Its Impact on Gold: A Paradigm Shift in the Precious Metal Market. This is a significant shift that allows U.S. banks to count physical gold as a Tier 1 asset for reserve requirements, equivalent to cash or U.S. Treasuries Basel III Makes It Official: Gold Is Money Again - USFunds, with the full implementation taking effect July 1, 2025 in the U.S.
Impact on Banking Operations
The regulations create a crucial distinction between allocated (physical) and unallocated ("paper") gold:
Allocated Gold: Allocated gold attracts no credit risk and is not considered part of the custodian bank's balance sheet Basel III and the Gold Market | World Gold Council, maintaining its zero risk weighting.
Unallocated Gold: The NSFR requires 85% of required stable funding for on-balance sheet gold, which is punitive and does not acknowledge the highly liquid nature of gold Basel III and the Gold Market | World Gold Council.
Market Consequences
Increased Demand for Physical Gold: The rise of physical gold on bank balance sheets could lead to an increase in demand for this asset, as banks seek to bolster their reserves with assets that are not only safe, but also fully valued under the Basel III regulatory framework GFI Gold & Forex International - The Impact of the Basel III Reforms on the Gold Market.
Reduced Paper Gold Activity: A likely consequence of the Basel III rules will be a drop in the volume of financial transactions linked to gold Gold and Basel III - EFG International, as banks face higher capital requirements for unallocated gold positions.
Central Bank Buying: Central banks bought gold in 2019 as a direct result of the reclassification of gold as a Tier 1 asset under Basel III Is Basel III setting up a new gold-backed monetary system? - MINING.COM, with this trend continuing as banks prepare for potential currency system instability.
Price Impact Expectations
The regulations are expected to drive gold prices higher through multiple mechanisms: increased institutional demand, reduced supply of paper gold products, and banks shifting from unallocated to allocated gold holdings. About 30% of central banks say they plan to increase their gold holdings in the next 12 months—the highest level ever recorded Basel III makes it official: Gold is money again - MINING.COM.
However, it's important to note that gold will not be reclassified as a High Quality Liquid Asset (HQLA) under Basel III—at least not yet Basel III Makes It Official: Gold Is Money Again - USFunds, though industry groups are actively advocating for this additional designation.
Basel III's treatment of gold as a Tier 1 asset does theoretically enhance banks' lending capacity, though the mechanics are somewhat complex. Let me break this down:
How This Affects Bank Lending Capacity:
Capital Ratio Enhancement: Under Basel III, a bank's Tier 1 and Tier 2 assets must be at least 10.5% of its risk-weighted assets Is Basel III setting up a new gold-backed monetary system? - MINING.COM. When gold moves from being heavily discounted (50% haircut as Tier 3) to being counted at 100% of market value as Tier 1, this strengthens the bank's capital ratios.
Leverage Ratio Impact: Basel III introduced a minimum leverage ratio of 3% Basel III and the Gold Market | World Gold Council, which is Tier 1 capital divided by the bank's total assets Basel III and Gold - Strategic Gold. By allowing gold to count as Tier 1 capital at full value, banks holding gold will have stronger leverage ratios.
The Multiplier Effect: Banks will no longer have to hold extra capital to support their gold holdings. And banks will be able to have gold on their books at 100% of the market value Gold reclassified as Tier 1 asset under Basel III: U.S. Global Investors CEO sees demand to surge | NASDAQ:GROW. This essentially frees up capital that was previously "locked up" due to the haircut.
Practical Lending Impact:
The relationship works like this: If a bank has stronger capital ratios due to gold being valued at 100% rather than 50%, it can theoretically support more risk-weighted assets (loans) while still meeting regulatory minimums. However, Basel III requires higher capital reserves, which means banks must have more money set aside to cover potential losses. This impacts their ability to lend and invest Basel III Makes It Official: Gold Is Money Again - USFunds.
The Counterbalancing Effect:
While gold's Tier 1 status helps, Basel III overall actually constrains lending through higher capital requirements. An OECD study projected that Basel III implementation would impact economic growth in the range of −0.05% to −0.15% per year due to increased bank lending spreads of 15 to as much as 50 basis points What Do They Mean When They Say Gold Is a Tier 1 Asset?.
SB Here: I think you get the point. There is a significant amount of momentum globally supporting bullish demand versus supply dynamics for gold. Please note that I have been bullish on gold for several years, and we, along with our clients, may own gold.
The views expressed herein are solely those of Steve Blumenthal as of the date of this report and are subject to change without notice. Not a recommendation to buy or sell any security.
Please note that the information provided is not recommended for buying or selling any security and is provided for discussion purposes only. Current viewpoints are subject to change. Please note that the information provided is not recommended for buying or selling any security and is provided for discussion purposes only.
Trade Signals: Update - July 3, 2025
“Stay on top of the current market trends with Trade Signals.”
“Extreme patience combined with extreme decisiveness. You may call that our investment process. Yes, it’s that simple.”
– Charlie Munger
Notable Changes This Week:
The Weekly MACD for the S&P 500 Index remains bullish. The Monthly MACD turned bullish this week.
The Weekly MACD for the 10-year Treasury Yield is bullish, signaling lower interest rates.
The Weekly MACD for Gold is bearish.
Key Macro Indicators - Investor Sentiment, Market Breadth, The S&P 500 Index (Stocks), The 10-year Treasury Yield (Bonds), and the Dollar:
The S&P 500 Index (Stock Market)
Investor Sentiment (looking for extreme optimism or extreme pessimism): The current reading is bearish (extreme optimism)
Market Breadth (looking for direction): The current reading is bullish, but lower since last week and nearing a neutral reading
S&P 500 Index Weekly MACD: The current reading is bullish
Notable - S&P 500 Index: Investor sentiment is Extremely Optimistic, Market Breadth is positive, and the S&P 500 Index Weekly MACD remains bullish (last signal 5-17-25). The green arrow pointing to the 5,700 area indicates a significant upside price gap. Gaps tend to be filled, which means a correction back towards the support line is probable (not guaranteed).
About Trade Signals
Trade Signals is a paid subscription service that posts the daily, weekly, and monthly trends in the markets. It is free for CMG clients.

TRADE SIGNALS SUBSCRIPTION ACKNOWLEDGEMENT / IMPORTANT DISCLOSURES
The views expressed herein are solely those of Steve Blumenthal as of the date of this report and are subject to change without notice. Not a recommendation to buy or sell any security.
Please note that the information provided is not recommended for buying or selling any security and is provided for discussion purposes only. Current viewpoints are subject to change. Please note that the information provided is not recommended for buying or selling any security and is provided for discussion purposes only.
Personal Note: Happy 4th of July
“Many people seem to think that if an operator is in Wall Street, he can tell what the market is going to do. Nothing is further from the fact."
— Charles Dow, co-founder of Dow Jones & Company
Happy birthday to … stock market indices! 141 years ago today, newspaperman Charles Dow added up the prices of 11 stocks and measured the change from the prior day to summarize the market’s performance for his daily “Customer’s Afternoon Letter”. Containing nine railroad stocks as well as a steamship company and Western Union, the “Dow Transportation Average” was a major market innovation, and paved the way for the development of further indices (including, 12 years later, the now more famous Dow Industrial Average). Happy Fourth of July - Enjoy the fireworks! Source: S&P Dow Jones Indices
I want to express my sincere apology and thank several astute readers for bringing to my attention that last week’s story about Peyton Manning supporting a young graduate named Ryan was a fictional account. I loved the story. Disappointed it is not true. Sorry for my error.
Now here is a true sports story!
On this day in history: Serena Williams Reclaims the Grass Crown at Wimbledon, 2009!
What a day at the All England Club. The 2009 Wimbledon Ladies' Singles Final delivered an epic sister act, with Serena Williams facing off against defending champion, her sister Venus Williams.
Venus, who had been dominant going into the match, winning 20 consecutive matches and 34 straight sets on the Wimbledon grass, was favored to win. However, Serena rose to the occasion.
The match was close in the first set. Serena had to fight to hold her serve, saving break points. The first set went to a tie-break, where Serena played aggressively and took the set with a lob.
In the second set, Serena shifted into an even higher gear. She got the crucial break, and while Venus saved match points, Serena secured the win. She closed out the match 7-6 (3), 6-2 to win her third Wimbledon singles title and her 11th Grand Slam overall.
After the win, Serena was ecstatic, saying she felt blessed and almost couldn't believe she had beaten her sister. Venus praised Serena, acknowledging she was "too good" and had "answers for everything."
This victory was a huge moment for Serena, marking her first Wimbledon title since 2003 and solidifying her place as one of the greatest of all time. The sisters went on to win the women's doubles title together, their fourth at Wimbledon as a pair.
I remember watching that match: it showcased great talent, a competitive spirit, and pure will to win.
How’s that for a once-in-a-lifetime sports story? And, I promise, this one happened.
Have fun with your family today, and Happy 4th!
With kind regards,
Steve
You can share this letter on X by clicking here.
You can share this letter on LinkedIn by clicking here.
Subscribe to OMR for free by clicking the photo.
Stephen B. Blumenthal
Executive Chairman & CIO
CMG Capital Management Group, Inc.
75 Valley Stream Parkway, Suite 201, Malvern, PA 19355
Private Wealth Client Website
CMG Customer Relationship Summary (Form CRS)
Metric-Financial, LLC Customer Relationship Summary (Form CRS)

Stephen Blumenthal founded CMG Capital Management Group in 1992 and serves today as its Executive Chairman and CIO. Steve authors a free weekly e-letter entitled, “On My Radar.” Steve shares his views on macroeconomic research, valuations, portfolio construction, asset allocation and risk management. Author of Forbes Book: On My Radar, Navigating Stock Market Cycles.
Follow Steve on X @SBlumenthalCMG and LinkedIn.
IMPORTANT DISCLOSURE INFORMATION
This document is prepared by CMG Capital Management Group, Inc. (“CMG”) and is circulated for informational and educational purposes only. There is no consideration given to the specific investment needs, objectives, or tolerances of any of the recipients. Additionally, CMG’s actual investment positions may, and often will, vary from its conclusions discussed herein based on any number of factors, such as client investment restrictions, portfolio rebalancing, and transaction costs, among others. Recipients should consult their own advisors, including tax advisors, before making any investment decision. This material is for informational and educational purposes only and is not an offer to sell or the solicitation of an offer to buy the securities or other instruments mentioned. This material does not constitute a personal recommendation or take into account the particular investment objectives, financial situations, or needs of individual investors which are necessary considerations before making any investment decision. Investors should consider whether any advice or recommendation in this research is suitable for their particular circumstances and, where appropriate, seek professional advice, including legal, tax, accounting, investment, or other advice. The views expressed herein are solely those of Steve Blumenthal as of the date of this report and are subject to change without notice.
Investing involves risk.
This letter may contain forward-looking statements relating to the objectives, opportunities, and future performance of the various investment markets, indices, and investments. Forward-looking statements may be identified by the use of such words as; “believe,” anticipate,” “planned,” “potential,” and other similar terms. Examples of forward-looking statements include, but are not limited to, estimates with respect to financial condition, results of operations, and success or lack of success of any particular market, index, investment, or investment strategy. All are subject to various factors, including, but not limited to, general and local economic conditions, changing levels of competition within certain industries and markets, changes in legislation or regulation, Federal Reserve policy, and other economic, competitive, governmental, regulatory, and technological factors affecting markets, indices, investments, investment strategy and portfolio positioning that could cause actual results to differ materially from projected results. Such statements are forward-looking in nature and involve a number of known and unknown risks, uncertainties, and other factors, and accordingly, actual results may differ materially from those reflected or contemplated in such forward-looking statements. Investors are cautioned not to place undue reliance on any forward-looking statements or examples. All statements made herein speak only as of the date that they were made. Investing is inherently risky and all investing involves the potential risk of loss.
Past performance does not guarantee or indicate future results. Different types of investments involve varying degrees of risk, and there can be no assurance that the future performance of any specific investment, investment strategy, or product (including the investments and/or investment strategies recommended or undertaken by CMG), or any non-investment related content, made reference to directly or indirectly in this commentary will be profitable, equal any corresponding indicated historical performance level(s), be suitable for your portfolio or individual situation or prove successful. Due to various factors, including changing market conditions and/or applicable laws, the content may no longer be reflective of current opinions or positions. Moreover, you should not assume that any discussion or information contained in this commentary serves as the receipt of, or as a substitute for, personalized investment advice from CMG. Please remember to contact CMG, in writing, if there are any changes in your personal/financial situation or investment objectives for the purpose of reviewing/evaluating/revising our previous recommendations and/or services, or if you would like to impose, add, or to modify any reasonable restrictions to our investment advisory services. Unless, and until, you notify us, in writing, to the contrary, we shall continue to provide services as we do currently. CMG is neither a law firm, nor a certified public accounting firm, and no portion of the commentary content should be construed as legal or accounting advice.
No portion of the content should be construed as an offer or solicitation for the purchase or sale of any security. References to specific securities, investment programs or funds are for illustrative purposes only and are not intended to be, and should not be interpreted as recommendations to purchase or sell such securities.
This presentation does not discuss, directly or indirectly, the amount of the profits or losses realized or unrealized, by any CMG client from any specific funds or securities. Please note: In the event that CMG references performance results for an actual CMG portfolio, the results are reported net of advisory fees and inclusive of dividends. The performance referenced is that as determined and/or provided directly by the referenced funds and/or publishers, has not been independently verified, and does not reflect the performance of any specific CMG client. CMG clients may have experienced materially different performance based upon various factors during the corresponding time periods. See in links provided citing limitations of hypothetical back-tested information. Past performance cannot predict or guarantee future performance. Not a recommendation to buy or sell. Please talk to your advisor.
Information herein has been obtained from sources believed to be reliable, but we do not warrant its accuracy. This document is general communication and is provided for informational and/or educational purposes only. None of the content should be viewed as a suggestion that you take or refrain from taking any action nor as a recommendation for any specific investment product, strategy, or other such purposes.
In a rising interest rate environment, the value of fixed-income securities generally declines, and conversely, in a falling interest rate environment, the value of fixed-income securities generally increases. High-yield securities may be subject to heightened market, interest rate, or credit risk and should not be purchased solely because of the stated yield. Ratings are measured on a scale that ranges from AAA or Aaa (highest) to D or C (lowest). Investment-grade investments are those rated from highest down to BBB- or Baa3.
NOT FDIC INSURED. MAY LOSE VALUE. NO BANK GUARANTEE.
Certain information contained herein has been obtained from third-party sources believed to be reliable, but we cannot guarantee its accuracy or completeness.
In the event that there has been a change in an individual’s investment objective or financial situation, he/she is encouraged to consult with his/her investment professional.
Written Disclosure Statement. CMG is an SEC-registered investment adviser located in Malvern, Pennsylvania. Stephen B. Blumenthal is CMG’s founder and CEO. Please note: The above views are those of CMG and its CEO, Stephen Blumenthal, and do not reflect those of any sub-advisor that CMG may engage to manage any CMG strategy, or exclusively determines any internal strategy employed by CMG. A copy of CMG’s current written disclosure statement discussing advisory services and fees is available upon request or via CMG’s internet web site at www.cmgwealth.com/disclosures. CMG is committed to protecting your personal information. Click here to review CMG’s privacy policies.