On My Radar - Valuations and Forward Returns (Part II)

July 11, 2025
By Steve Blumenthal
“Market conditions can’t be separated that cleanly. This is, because that is. This is not, because that is not. If you look deeply into a speculative bubble, you can see the market collapse in it. If you look deeply into a market collapse, you can see the bull market in it. Each is a continuation of the other.”
— John Hussman, Ph.D.
President, Hussman Investment Trust
Grab that coffee and find your favorite chair. It’s been months since we last reviewed valuation levels- let’s take a look. You’ll find today’s post to be a quick read.
As you view the charts, keep in mind that Big Beautiful is going to inject another $5 trillion into the system and money market balances are surprisingly high. Inflation remains the probable outcome with wave number two coming soon. Asset price inflation is also a potential outcome until the bond vigilantes say “no más.”
Geek goggles on, let’s go.
On My Radar:
Mid-Year Valuations Part II
Economic Summary Total View
Trade Signals: Update - July 10, 2025
Personal Note: Longevity
OMR is for informational and educational purposes only. No consideration is given to your specific investment needs, objectives, or tolerances.
Please see the Important Disclosures at the bottom of this page. Reminder: This is not a recommendation to buy or sell any security. My views may change at any time. The information is for discussion and educational purposes only.
If you like what you are reading, you can subscribe for free.

Mid-year Valuations Part II
Before we jump in, it is important to note that while the stock market is “Extremely Overvalued,” that doesn’t mean that all stocks are overvalued. For example, biotech has been out of favor for some time (not a recommendation, just an observation). There are opportunities, but I don’t see them in the popular S&P 500 Index and cap-weighted index structures in general. As you all know by now, I'm not bearish; I’m just not interested in buying overvalued stocks.
But this leaves us a bit empty as to what to do. Viewing the valuation data, I believe, can help one set targets to know when the getting is good. There is a reason why Warren Buffett is holding so much cash. You’ll find his favorite valuation metric below, along with several of mine.
Last week, I shared several metrics in Mid-Year Valuations Part I. One of my favorites is the Price-to-Sales ratio, which remains extremely overvalued. Today, let’s look at a few more and also see what they tell us about coming 1-, 3-, 5-, 7-, 9-, 10-, 11-, and even 12 years (the twelve-year chart is courtesy of John Hussman).
A Quick Look at Everything
“Extremely Overvalued,” pretty much across the board.

Ned Davis Research: See important disclosures below
Median Fair Value is 31.2% below the June S&P 500 Index Close
Note the red and green arrows.
Median Fair Value is at 4,269 (that’s a good target to keep in mind).
“We’d be better off here,” points to the 61.3-year median PE of 17.9.
Median PE as of 6-30-25 is 26.0.

Source: NDR, CMG arrows/comments
S&P 500 Index vs Stock Market Capitalization as a Percentage of GDI
The middle section (orange line) plots month-by-month market cap as a percentage of nominal (before inflation factored in) gross domestic income. The dotted line is an upsloping regression trend line.
The lower section (blue line) plots how far above or below the orange line is vs the trendline. When the blue line is above the upper dotted line, it is in the “Top Quintile” of all readings dating back to 1925. When below the bottom dotted line, it is in the “Bottom Quintile” of all readings since 1925.
NDR then plots the “Averge % Change in the S&P 500” that occurred 1-, 3-,5-, 7-, 9-, and 11 years later when your starting point was in the “Top Quintile” and when your starting point was in the “Bottom Quintile.”
Bottom line: We are in the “Top Quintile” with the current extreme nearing the high in 2021 but below the tech bubble levels in the early 2,000.

Source: NDR, CMG
Household Equity Percentage vs. Subsequent 10-year Rolling Returns
The yellow bar at the top shows where we are now vs other periods of high household equity ownership (most recent data 3-31-25).
The “We are here” arrow indicates an approximate -2.3% outcome in 10 years.
Note the correlation between the blue line and the orange line. Not perfect (nothing is), but it reflects a high 0.80 correlation coefficient since 1951.
The dotted orange line stops 10 years ago, since that is the last known 10-year result.
What patient investors are looking for is a correction from extreme household ownership of stocks (the current 63.8% equity percentage as a percentage of total household stocks, bonds, and cash) to somewhere below 50.

NDR, CMG annotations
The Bubble – Contains the Collapse – Contains the Resurgence
John Hussman’s June post is out. Worth the read. You can find it here.
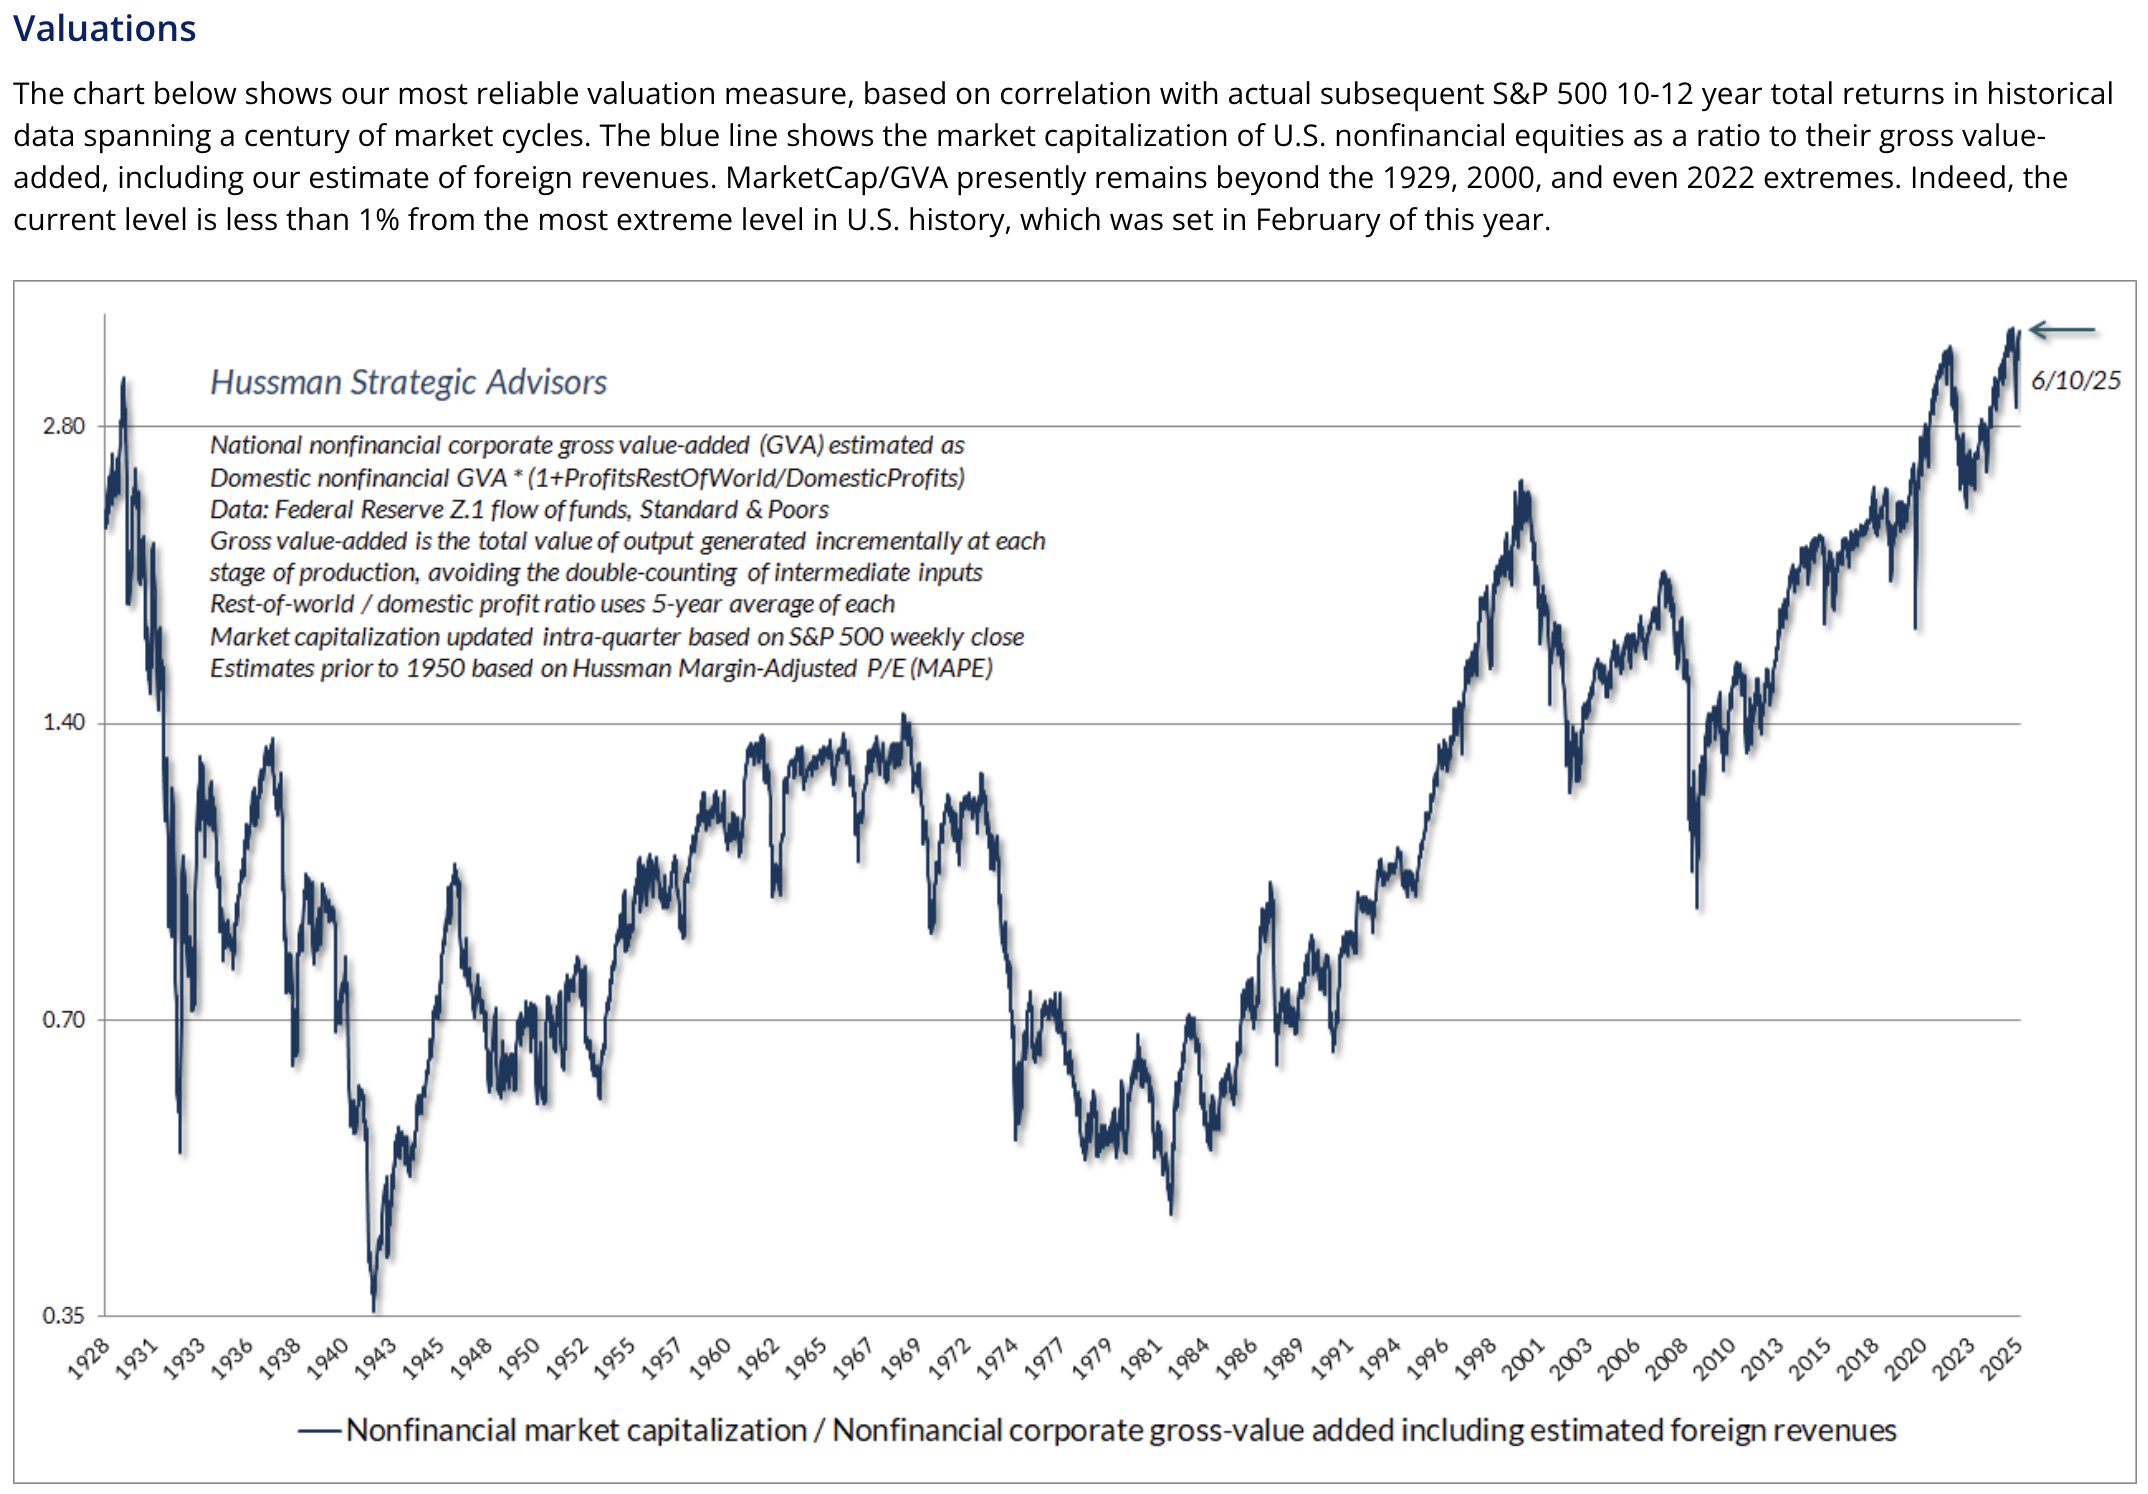
Let’s focus on what John says is his “most reliable valuation measure, based on correlation with actual subsequent S&P 500 10-12 year total returns in historical data spanning a century of market cycles.
The blue line shows the market capitalization of U.S. non-financial equities as a ratio to their gross value-added, including our estimate of foreign revenues.
MarketCap/GVA presently remains beyond the 1929, 2000, and even 2022 extremes.
Indeed, the current level is less than 1% from the most extreme level in U.S. history, which was set in February of this year.”
The arrow in the upper right points to the current level, which is higher than 1929, 1966, 2000, and 2021.
Buffett Indicator: The Latest Data
With the Q1 GDP third estimate and the June close data, we now have an updated look at the popular "Buffett Indicator:" the ratio of corporate equities to GDP. The current reading is 197.6%, down slightly from the previous quarter and the lowest level since 2023. Thus, the indicator is signaling an overvalued market. Please note that this update follows GDP releases, which always lag. Source: Advisor Perspectives

Source: Advisor Perspectives
If you’d like to continue on this valuation journey, you can find some additional information here: Market Valuation: Is the Market Still Overvalued? by Jennifer Nash, 7/1/25
Money Market Funds
I mentioned the large balance in money market funds. Think of this as money (some of it) that may eventually find its way into the stock market. According to @Barchart, there is $1.7 trillion sitting in money market funds.
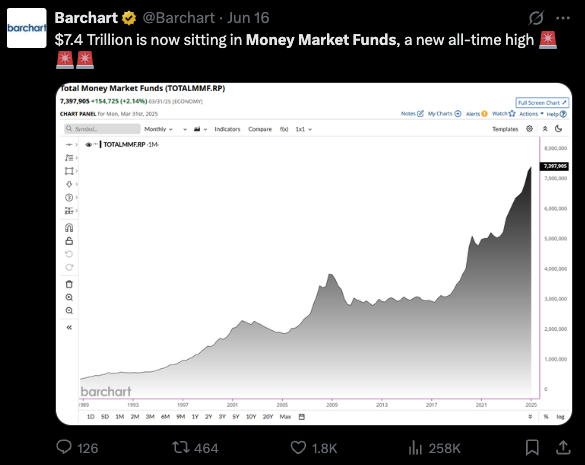
Additional source - Data from the Investment Company Institute (ICI):
As of July 2, 2025, total money market fund assets were reported at $7.08 trillion, with a weekly increase of $55.56 billion. Retail funds stood at $2.91 trillion, and institutional funds at $4.17 trillion, broken down by government, prime, and tax-exempt categories.
The ICI website provides weekly data tables under "Money Market Fund Assets" that could be used to create charts. These tables include historical data for the last 20 weeks, which can be visualized to show trends in total assets, retail vs. institutional, or by fund type (government, prime, tax-exempt).
See CMG Disclosures at the bottom of this page.
For more information about NDR, please visit at www.ndr.com.
NDR, Inc. (NDR), d.b.a. Ned Davis Research Group (NDRG), any NDRG affiliates or employees, or any third-party data provider, shall not have any liability for any loss sustained by anyone who has relied on the information contained in any NDRG publication. The data and analysis contained herein are provided "as is." NDRG disclaims any and all express or implied warranties, including, but not limited to, any warranties of merchantability, suitability or fitness for a particular purpose or use. NDRG's past recommendations and model results are not a guarantee of future results. This communication reflects our analysts' opinions as of the date of this communication and will not necessarily be updated as views or information change. All opinions expressed herein are subject to change without notice. NDRG or its affiliated companies or their respective shareholders, directors, officers and/or employees, may have long or short positions in the securities discussed herein and may purchase or sell such securities without notice. For NDRG's important additional disclaimers, refer to www.ndr.com/invest/public/copyright.html. Further distribution prohibited without prior permission. Copyright 2025 © NDR, Inc. All rights reserved.
Economic Summary Total View
Following is a dashboard of sorts I follow.
Factored into each section is a summary of many inputs.
For example, for Economic Activity, NDR looks at Real Gross Domestic Product (GDP after inflation), Industrial Production, ISM Manufacturing, Corporate profits, to name a few.
For inflation, they factor in CPI, PCE, Producer price index for final demand, non-farm unit labor costs, and hourly earnings, to name a few.
The gauges are self-explanatory. Generally, green is improving, and red is worsening. The needle points to the current score for each category.

NDR, CMG summary
Trade Signals: Update - July 10, 2025
“Stay on top of the current market trends with Trade Signals.”
“Extreme patience combined with extreme decisiveness. You may call that our investment process. Yes, it’s that simple.”
– Charlie Munger
Market Commentary:
I’ve added the following to the “Market Summary” section to begin tracking Treasury Secretary Scott Bessent’s 3-3-3 game plan—a framework aimed at improving the U.S. fiscal position:
3% GDP Growth — Currently at 1.4% (highlighted in red), well below the 3% target.
3% Budget Deficit-to-GDP Ratio — With GDP at $29 trillion, Bessent’s goal implies a deficit of no more than $870 billion. Today, the deficit exceeds $2 trillion. Put simply, the U.S. is spending around $7 trillion while bringing in just $5 trillion in tax revenue.
3 Million Barrel-per-Day Increase in U.S. Oil Production — Starting from 13.2 million barrels per day (as of June 2025), the plan calls for boosting output by an additional 3 million barrels per day. We’re not there yet (also shown in red).
Additionally, I’ve added “Inflation” to the dashboard. Red means it is currently above the Fed and Bessent’s 2% target.
The big picture: If Bessent’s 3-3-3 targets are met, it could mark a meaningful step toward stabilizing America’s growing debt burden. We’ll keep tracking the progress.
Source: CMG, US Treasury, eia.gov
Notable Changes This Week:
The Weekly MACD for the S&P 500 Index remains bullish. The Monthly MACD turned bullish this week.
The Weekly MACD for the 10-year Treasury Yield is bullish, signaling lower interest rates.
The Weekly MACD for Gold is bearish.
About Trade Signals
Trade Signals is a paid subscription service that posts the daily, weekly, and monthly trends in the markets (and more). It is free for CMG clients.

TRADE SIGNALS SUBSCRIPTION ACKNOWLEDGEMENT / IMPORTANT DISCLOSURES
The views expressed herein are solely those of Steve Blumenthal as of the date of this report and are subject to change without notice. Not a recommendation to buy or sell any security.
Please note that the information provided is not recommended for buying or selling any security and is provided for discussion purposes only. Current viewpoints are subject to change. Please note that the information provided is not recommended for buying or selling any security and is provided for discussion purposes only.
Personal Note: Longevity
"In the end, only three things matter: how much you loved, how gently you lived, and how gracefully you let go of the things not meant for you."
— Gautama Buddha
It’s been a fast pace, and I find it hard to believe we are in the middle of July. In a blink, here we are. I’m reminded of Ferris Bueller… “Life moves pretty fast. If you don't stop and look around once in a while, you could miss it.”
I listened to a pitch today on a promising immunotherapy drug that directly targets cancer cells without damaging the good cells. Hopeful.
Other areas are making significant advances in terms of longevity - living healthier, longer. My friend Dr. Mike Roizen believes that a combination of exercise, diet, and science can make a 90-year-old biologically equivalent to age 60. He guesses this to be an 80% probability within the next ten years. I sure hope he is right.
Another week down. As you head into the weekend, channel your inner Buddha, shower love on the people you love most, live gently, and let go of the things not meant for you.
With kind regards,
Steve
You can share this letter on X by clicking here.
You can share this letter on LinkedIn by clicking here.
Subscribe to OMR for free by clicking the photo.
Stephen B. Blumenthal
Executive Chairman & CIO
CMG Capital Management Group, Inc.
75 Valley Stream Parkway, Suite 201, Malvern, PA 19355
Private Wealth Client Website
CMG Customer Relationship Summary (Form CRS)
Metric-Financial, LLC Customer Relationship Summary (Form CRS)

Stephen Blumenthal founded CMG Capital Management Group in 1992 and serves today as its Executive Chairman and CIO. Steve authors a free weekly e-letter entitled, “On My Radar.” Steve shares his views on macroeconomic research, valuations, portfolio construction, asset allocation and risk management. Author of Forbes Book: On My Radar, Navigating Stock Market Cycles.
Follow Steve on X @SBlumenthalCMG and LinkedIn.
IMPORTANT DISCLOSURE INFORMATION
This document is prepared by CMG Capital Management Group, Inc. (“CMG”) and is circulated for informational and educational purposes only. There is no consideration given to the specific investment needs, objectives, or tolerances of any of the recipients. Additionally, CMG’s actual investment positions may, and often will, vary from its conclusions discussed herein based on any number of factors, such as client investment restrictions, portfolio rebalancing, and transaction costs, among others. Recipients should consult their own advisors, including tax advisors, before making any investment decision. This material is for informational and educational purposes only and is not an offer to sell or the solicitation of an offer to buy the securities or other instruments mentioned. This material does not constitute a personal recommendation or take into account the particular investment objectives, financial situations, or needs of individual investors which are necessary considerations before making any investment decision. Investors should consider whether any advice or recommendation in this research is suitable for their particular circumstances and, where appropriate, seek professional advice, including legal, tax, accounting, investment, or other advice. The views expressed herein are solely those of Steve Blumenthal as of the date of this report and are subject to change without notice.
Investing involves risk.
This letter may contain forward-looking statements relating to the objectives, opportunities, and future performance of the various investment markets, indices, and investments. Forward-looking statements may be identified by the use of such words as; “believe,” anticipate,” “planned,” “potential,” and other similar terms. Examples of forward-looking statements include, but are not limited to, estimates with respect to financial condition, results of operations, and success or lack of success of any particular market, index, investment, or investment strategy. All are subject to various factors, including, but not limited to, general and local economic conditions, changing levels of competition within certain industries and markets, changes in legislation or regulation, Federal Reserve policy, and other economic, competitive, governmental, regulatory, and technological factors affecting markets, indices, investments, investment strategy and portfolio positioning that could cause actual results to differ materially from projected results. Such statements are forward-looking in nature and involve a number of known and unknown risks, uncertainties, and other factors, and accordingly, actual results may differ materially from those reflected or contemplated in such forward-looking statements. Investors are cautioned not to place undue reliance on any forward-looking statements or examples. All statements made herein speak only as of the date that they were made. Investing is inherently risky and all investing involves the potential risk of loss.
Past performance does not guarantee or indicate future results. Different types of investments involve varying degrees of risk, and there can be no assurance that the future performance of any specific investment, investment strategy, or product (including the investments and/or investment strategies recommended or undertaken by CMG), or any non-investment related content, made reference to directly or indirectly in this commentary will be profitable, equal any corresponding indicated historical performance level(s), be suitable for your portfolio or individual situation or prove successful. Due to various factors, including changing market conditions and/or applicable laws, the content may no longer be reflective of current opinions or positions. Moreover, you should not assume that any discussion or information contained in this commentary serves as the receipt of, or as a substitute for, personalized investment advice from CMG. Please remember to contact CMG, in writing, if there are any changes in your personal/financial situation or investment objectives for the purpose of reviewing/evaluating/revising our previous recommendations and/or services, or if you would like to impose, add, or to modify any reasonable restrictions to our investment advisory services. Unless, and until, you notify us, in writing, to the contrary, we shall continue to provide services as we do currently. CMG is neither a law firm, nor a certified public accounting firm, and no portion of the commentary content should be construed as legal or accounting advice.
No portion of the content should be construed as an offer or solicitation for the purchase or sale of any security. References to specific securities, investment programs or funds are for illustrative purposes only and are not intended to be, and should not be interpreted as recommendations to purchase or sell such securities.
This presentation does not discuss, directly or indirectly, the amount of the profits or losses realized or unrealized, by any CMG client from any specific funds or securities. Please note: In the event that CMG references performance results for an actual CMG portfolio, the results are reported net of advisory fees and inclusive of dividends. The performance referenced is that as determined and/or provided directly by the referenced funds and/or publishers, has not been independently verified, and does not reflect the performance of any specific CMG client. CMG clients may have experienced materially different performance based upon various factors during the corresponding time periods. See in links provided citing limitations of hypothetical back-tested information. Past performance cannot predict or guarantee future performance. Not a recommendation to buy or sell. Please talk to your advisor.
Information herein has been obtained from sources believed to be reliable, but we do not warrant its accuracy. This document is general communication and is provided for informational and/or educational purposes only. None of the content should be viewed as a suggestion that you take or refrain from taking any action nor as a recommendation for any specific investment product, strategy, or other such purposes.
In a rising interest rate environment, the value of fixed-income securities generally declines, and conversely, in a falling interest rate environment, the value of fixed-income securities generally increases. High-yield securities may be subject to heightened market, interest rate, or credit risk and should not be purchased solely because of the stated yield. Ratings are measured on a scale that ranges from AAA or Aaa (highest) to D or C (lowest). Investment-grade investments are those rated from highest down to BBB- or Baa3.
NOT FDIC INSURED. MAY LOSE VALUE. NO BANK GUARANTEE.
Certain information contained herein has been obtained from third-party sources believed to be reliable, but we cannot guarantee its accuracy or completeness.
In the event that there has been a change in an individual’s investment objective or financial situation, he/she is encouraged to consult with his/her investment professional.
Written Disclosure Statement. CMG is an SEC-registered investment adviser located in Malvern, Pennsylvania. Stephen B. Blumenthal is CMG’s founder and CEO. Please note: The above views are those of CMG and its CEO, Stephen Blumenthal, and do not reflect those of any sub-advisor that CMG may engage to manage any CMG strategy, or exclusively determines any internal strategy employed by CMG. A copy of CMG’s current written disclosure statement discussing advisory services and fees is available upon request or via CMG’s internet web site at www.cmgwealth.com/disclosures. CMG is committed to protecting your personal information. Click here to review CMG’s privacy policies.