On My Radar: Happy New Year - Recession Timing Update

January 2, 2026
By Steve Blumenthal
“The best investors do not react to markets; they anticipate them.”
- David Tepper
Happy New Year, and best wishes to you and yours.
Let’s kick off the year by taking stock of our starting conditions. With the S&P 500 trading at roughly 28x trailing 12-month earnings, valuations matter. But context matters more. The Magnificent 7 have been doing most of the heavy lifting. Strip them out, and the remaining 493 stocks trade closer to 15x earnings - a very different market beneath the surface.
You’ll find several uniquely insightful charts this week, along with a fresh look at the probability of a 2026 recession. A quick hint: historically, recessions tend to follow about a year after the yield curve normalizes: that’s when short-term Treasury yields fall below long-term yields. The curve turned positive at the end of last January, so we have entered the high-risk zone. I explain this in layman’s terms below.
Grab that coffee, settle into your favorite chair, and let’s get to it. It’s going to be another great year. Ever forward, lights on - let’s go.
On My Radar: Happy New Year - Recession Timing Update
Personal Note: NYC, Phoenix, and Snowbird
OMR is for informational and educational purposes only. No consideration is given to your specific investment needs, objectives, or tolerances.
Please see the Important Disclosures at the bottom of this page. Reminder: This is not a recommendation to buy or sell any security. My views may change at any time. The information is for discussion and educational purposes only.
If you like what you are reading, you can subscribe for free.

Valuation Record High
Median P/E
The green “We’d be better here” arrow points to the 61.8-year median P/E of 18. Think of that point as “Fair Value” where an investor might expect 10-year future returns to average 10%.
Higher returns would be expected if the market declines to the point where the median P/E drops to 12.5.
It will take a 30.5% correction from the December 31, 2025, close of 6845.50 to reach “Fair Value” of 4757.62 on the S&P 500 Index.
A 53% decline to “Undervalued” is equivalent to 3217.38 on the S&P 500 Index.
Among bear markets since 1946, the average decline during recessions was 35.8%, compared with 27.9% without a recession. Source
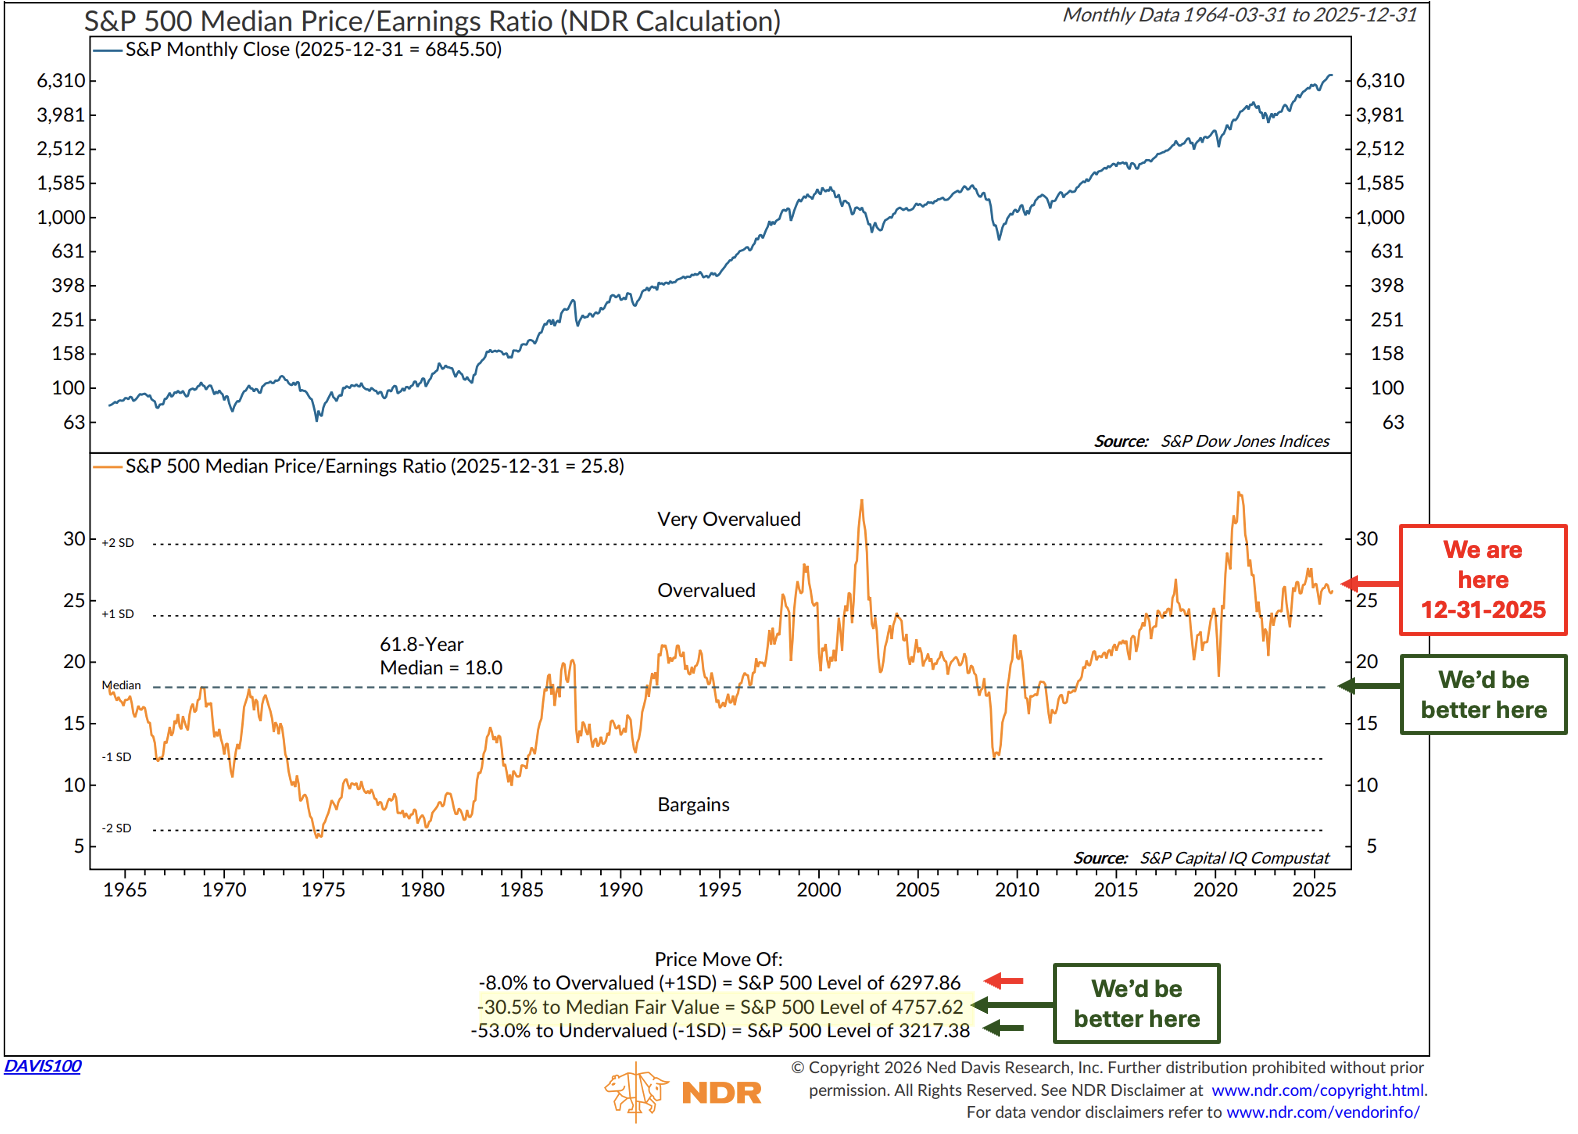
Source: NDR w CMG notations
S&P 500 - Trend Channel
The following chart is fascinating.
Note the trend channel in the middle of the chart.
Dates with arrows highlight prior cyclical peaks along the top channel line. Let’s focus on comparing the valuation data at those prior market peaks with the 12-31-2025 year-end data.
The “We are here” red arrow in the upper left points to three valuation metrics: Price to Book, Price to Dividend, Price to Earnings.
Next, compare the current values with those in the lower-right data box. To make it easy, I highlighted in yellow the relevant dates/data.
What you’ll find, with just two exceptions circled in red, is that the current valuations are higher across the board. The market is in the process of making its ninth cyclical peak, dating back to 1928.
We sit at a record valuation extreme.
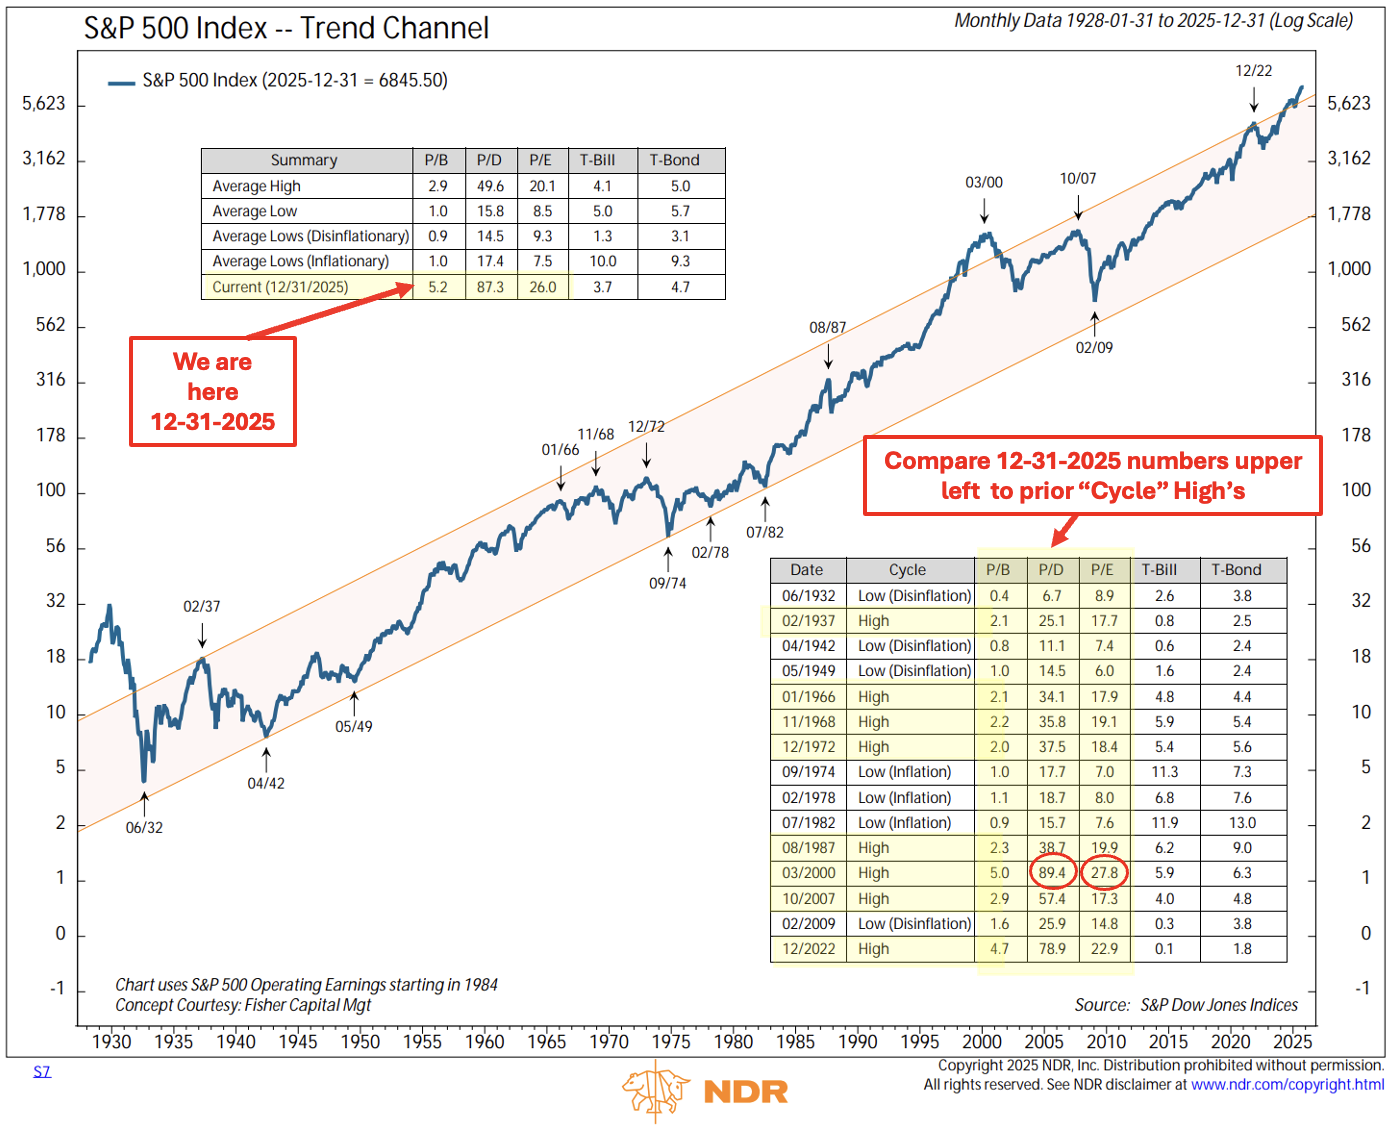
Source: NDR w CMG notations
Price to Sales - Long-term Trends
The Price-to-Sales ratio is shown in the center section.
Note the “We are here” red arrow. We sit at the highest level, dating back to 1954.
The key metric in this chart is in the lower section. This measures the deviation from the upward-sloping dotted blue line in the center section. I drew a long red line pointing back to the bull market peak in 1966.
Bottom line: Yikes. We sit at a very high altitude. The air is getting thin.

Source: NDR w CMG notations
Average Equity Allocation and Subsequent Rolling 10-Year Total Return
The following data is updated through 6-30-2025. Note the “We are here” red arrow.
On June 30, 2015, Households held a record 53.3% of their portfolios in equities. The S&P 500 Index closed at 6204 on 6-30-2025. It closed at 6845 on 12-31-2025, up 10.36% more in the second half of 2025.
Given that gain, it is fair to assume that the updated 12-31-2025 Average Equity Allocation numbers will be higher. I estimate that the “Average Equity Allocation Percentage” will increase to at least 55%. Regardless, it has never been higher. This is telling with respect to the subsequent 10-year total returns.
Note the red “We are here” arrow. The yellow highlight box shows the last two cycle peaks.
The dotted orange line plots the actual 10-year total returns. Note that it stopped 10 years ago, as we don’t know the most recent 10-year number.
Note the strong tracking correlation between the orange and blue lines.
While not perfect (nothing is), the current level suggests a -3% rolling total return over the next 10 years.
What is important is the high degree of temporal correlation between the dotted orange line and the blue line. NDR puts it this way:
“This chart compares the percentage of total household financial assets invested in equity to the subsequent 10-year total return on the S&P 500 (inverted). When households are heavily invested in equity, the subsequent 10-year returns are low or even negative, while the subsequent 10-year returns are high when household equity holdings are low. Note the high correlation between household equity allocation and the subsequent inverted 10-year return. This result is in line with most other long-term sentiment/liquidity indicators, as market peaks and troughs tend to be inversely correlated with investor liquidity.” (Emphasis mine)
Bottom line: Investors are “all-in” on U.S. equities like no other time in history, dating back to 1951.
The 10-year forward total-return outlook ranges from -1% to -5%. Not a guarantee, just a probability assessment.

The Buffett Indicator - Market Cap to GDP
Speaks for itself. Valuation peaks are circled in red.
Note, I use the numbers in the PE Distortion section and provide what I hope you find to be a fascinating insight.
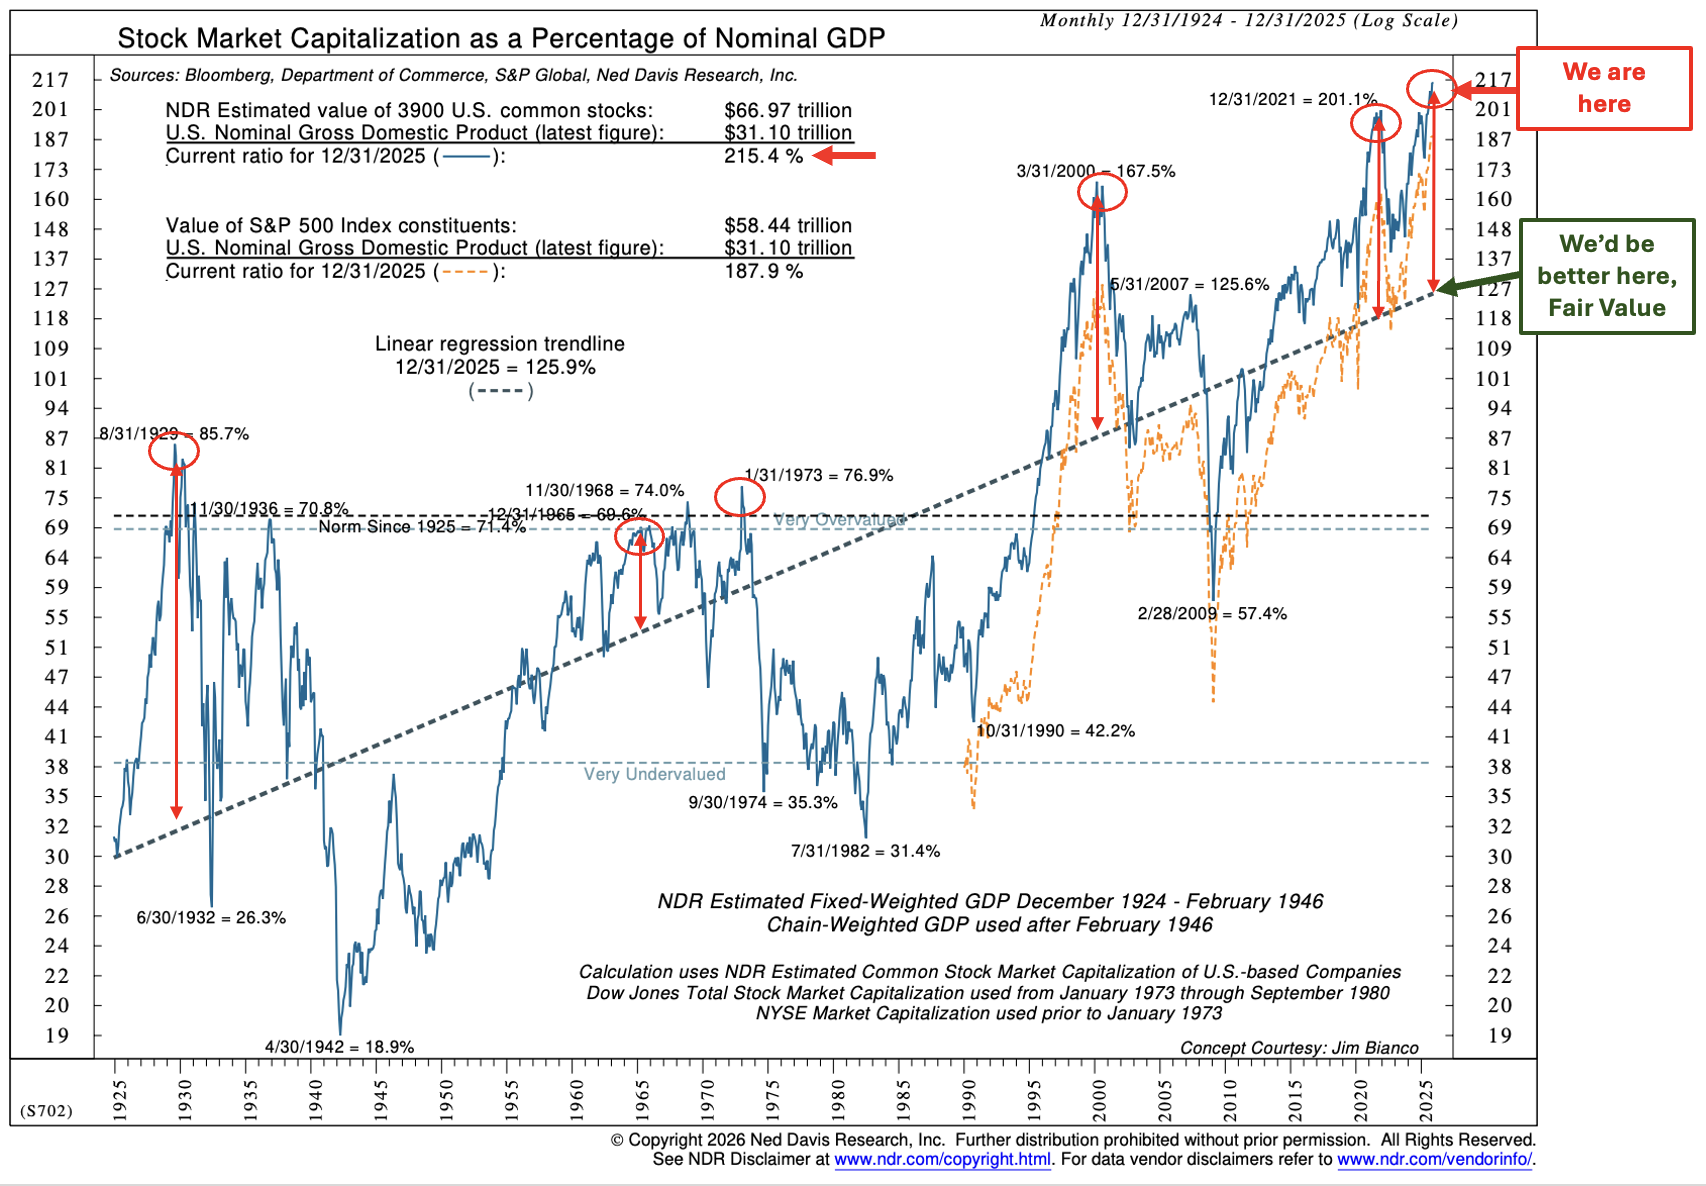
Source: NDR w CMG notations
The PE Distortion Effect
Prompted by a good friend and client, Rob S., I did some analysis on PE. His argument, and it is a valid one, is that the Mag 7 stocks have so distorted the traditional way of evaluating the S&P 500 Index’s PE, which, in turn, may distort potential 10-year forward return expectations based on the PE.
I will begin with the summary, and you can read further on if you are a quant geek like me.
Summary Conclusion - Distortion Effect
The trailing P/E for the full S&P 500 (cap-weighted index) is currently ~28x. The Magnificent 7 (cap-weighted) trailing PE is ~53x. The rest of the S&P 500 (~493 stocks) is ~15x.
What This Means
The Magnificent 7 trade at a much higher multiple than the broader market. Approximately more than 3x the trailing P/E of the remaining ~493 stocks.
Because they represent ~35% of the index, this skews the overall S&P 500 P/E upward significantly compared to the valuation of the broader market excluding these seven.
Excluding them brings the S&P 500’s effective P/E much closer to historical norms (~15x) for the remaining stocks.
Let’s get a sense of what this means in terms of dollars.
Total U.S. Equity Market Capitalization
The entire U.S. stock market
Including all publicly traded U.S. companies (large-, mid-, and small-cap), the total market cap was approximately $66.97 trillion as of December 31, 2025. NDR estimated value of 3900 U.S. common stocks. Sources: Bloomberg, Dept of Commerce, S&P Global, and NDR. This figure includes the whole universe of U.S. corporate equities listed on U.S. exchanges across all size segments.
Total Market Cap of the S&P 500
The S&P 500 represents approximately 70–80% of the total U.S. equity market cap (by construction).
The total market cap of all 500 companies in the index was $58.44 trillion on December 31, 2025. (Sources: Bloomberg, Dept of Commerce, S&P Global, and NDR)
Combined Market Cap of the Magnificent 7
Recent market-cap aggregation for the Magnificent Seven stocks (Apple, Microsoft, Alphabet, Amazon, Meta Platforms, Nvidia, and Tesla) indicates a combined valuation of approximately $ 21.7 trillion as of late 2025. Source: Slickcharts
Think about that: almost all of the money invested, $58.44 of $66.97 trillion, is in just 500 stocks, and $21.7 trillion is in just seven stocks.
Before you dig into the math below, I want to note that a typical bear market correction will bring the entire market down largely because of the high concentration in so few stocks. Almost everyone with money invests in the S&P 500 Index. 80% of all the stock market money is in the same 500 stocks. Though that’s not the problem, the problem is leverage.
When leverage unwinds, forced selling takes place. Buyers back away, bids drop, and weak investors panic and sell.
That’s why the markets “V” bottom.
The largest overweights tend to be the most leveraged positions. The size of margin debt in the system today is unprecedented. I can’t say it is all in just seven stocks, but it is not a leap to believe a sizable portion of some investors' holdings utilize margin debt to buy the darlings.
Here is a good look:
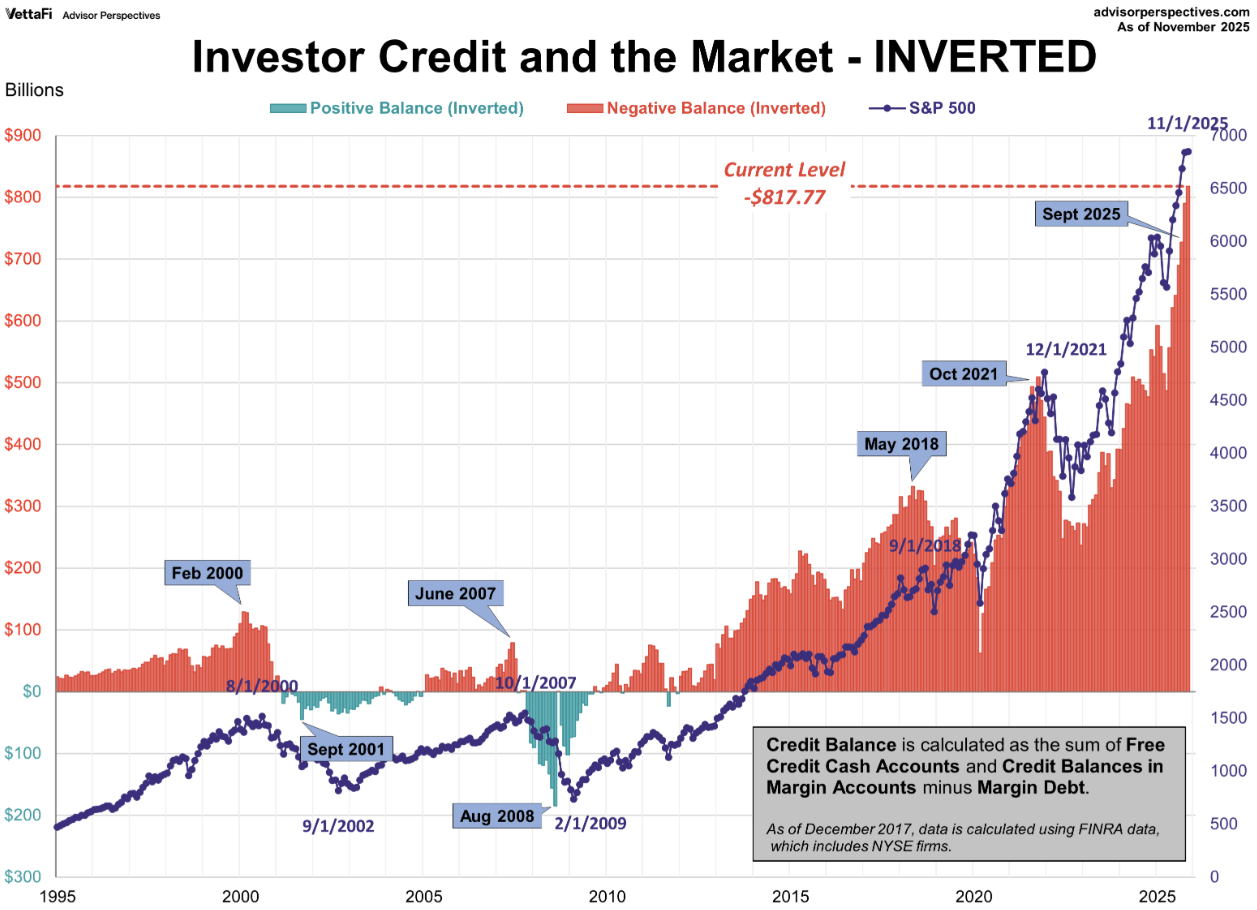
Source: VettaFi Advisor Perspectives
It is leverage that always ‘blows things up.’ And whatever causes the next dislocation, the most overconcentrated positions are likely to get hit extra hard. If so, what looks to be a fairly valued S&P 493 stocks at a trailing 15x P/E, will likely look even better. While 15x looks good today, 10-12x would be better.
Channel your inner David Tepper: “The best investors do not react to markets; they anticipate them.”
Quant Geeks Only - Here is some extra math if you are up for it:
Here’s a current snapshot (late 2025 / early 2026) of trailing price-to-earnings (P/E) ratios for each of the Magnificent 7 stocks:
Apple (AAPL) ~36.4X
Microsoft (MSFT) ~34X
Alphabet (GOOGL) ~30.9X
Amazon (AMZN) ~32.6X
Meta Platforms (META) ~29X
Nvidia (NVDA) ~46X
Tesla (TSLA) ~300X (an extremely high trailing multiple)
(Source: Yahoo Finance and FinanceCharts)
Weighted Average P/E for Magnificent 7
With some help from AI - To come up with the approximate a weighted P/E for just the Mag 7 group, we take:
Weighted Mag 7 P/E=∑(Weighti×P/Ei)∑(Weights of Mag 7) \text{Weighted Mag 7 P/E} =\frac{\sum(\text{Weight}_i \times \text{P/E}_i)}{\sum(\text{Weights of Mag 7})} Weighted Mag 7 P/E=∑(Weights of Mag 7)∑(Weighti×P/Ei)
Rough Calculation
Weight × P/E contributions (approx):
Nvidia: 7.05%×54=3.817.05\% \times 54 = 3.817.05%×54=3.81
Apple: 6.64%×39=2.596.64\% \times 39 = 2.596.64%×39=2.59
Microsoft: 5.79%×38=2.205.79\% \times 38 = 2.205.79%×38=2.20
Amazon: 3.96%×34=1.353.96\% \times 34 = 1.353.96%×34=1.35
Alphabet: 6.26%×26≈1.636.26\% \times 26 ≈ 1.636.26%×26≈1.63 (combined GOOGL + GOOG)
Meta: 2.74%×26=0.712.74\% \times 26 = 0.712.74%×26=0.71
Tesla: 2.44%×260=6.352.44\% \times 260 = 6.352.44%×260=6.35
Sum of weighted contributions ≈ 18.64
Divide by total Mag 7 weight (~34.9%):
Weighted Mag 7 P/E ≈ 18.64
34.9%≈∗∗ 53×∗∗\text{Weighted Mag 7 P/E} ≈ \frac{18.64}{34.9\%} ≈ **~53×**Weighted Mag 7 P/E≈34.9%18.64≈∗∗ 53x∗∗
Estimated trailing weighted P/E for the Magnificent 7 ≈ ~53x
(Note: Tesla’s extremely high P/E disproportionately pulls up the group average.)
Implied P/E for the “493” (Remaining S&P 500)
Let’s assume the overall S&P 500 trailing P/E is roughly ~28x (widely cited current estimate, though it moves daily). MoneyWeek
We can derive the rest-of-index P/E using:
Index P/E= (Mag 7 weight×Mag 7 P/E)+(Rest weight×Rest P/E)\text{Index P/E} = (\text{Mag 7 weight} \times \text{Mag 7 P/E}) + (\text{Rest weight} \times \text{Rest P/E})Index P/E=(Mag 7 weight×Mag 7 P/E)+(Rest weight×Rest P/E)
Let:
W7=0.349W_{7} = 0.349W7=0.349
P/E7≈53P/E_{7} ≈ 53P/E7≈53
Wrest≈0.651W_{rest} ≈ 0.651Wrest≈0.651
P/Eindex≈28P/E_{index} ≈ 28P/Eindex≈28
Solve for P/ErestP/E_{rest}P/Erest:
28=(0.349×53)+(0.651×P/Erest)28 = (0.349 \times 53) + (0.651 \times P/E_{rest})28=(0.349×53)+(0.651×P/Erest) 28≈18.5+0.651×P/Erest28 ≈ 18.5 + 0.651 \times P/E_{rest}28≈18.5+0.651×P/Erest 0.651×P/Erest≈9.50.651 \times P/E_{rest} ≈ 9.50.651×P/Erest≈9.5 P/Erest≈9.50.651≈∗∗ 15×∗∗P/E_{rest} ≈ \frac{9.5}{0.651} ≈ **~15×**P/Erest≈0.6519.5≈∗∗ 15x∗∗
Implied trailing P/E for the ~493 remaining S&P 500 stocks ≈ ~15x
Please note: ChatGPT can make mistakes. Check important info.
If you made it this far, I owe you a beer!
Not a recommendation to buy or sell any security. Please note that the information provided is not recommended for buying or selling any security and is provided for discussion purposes only. Current viewpoints are subject to change. Please note that the information provided is not recommended for buying or selling any security and is provided for discussion purposes only. See important CMG and NDR disclosures below.
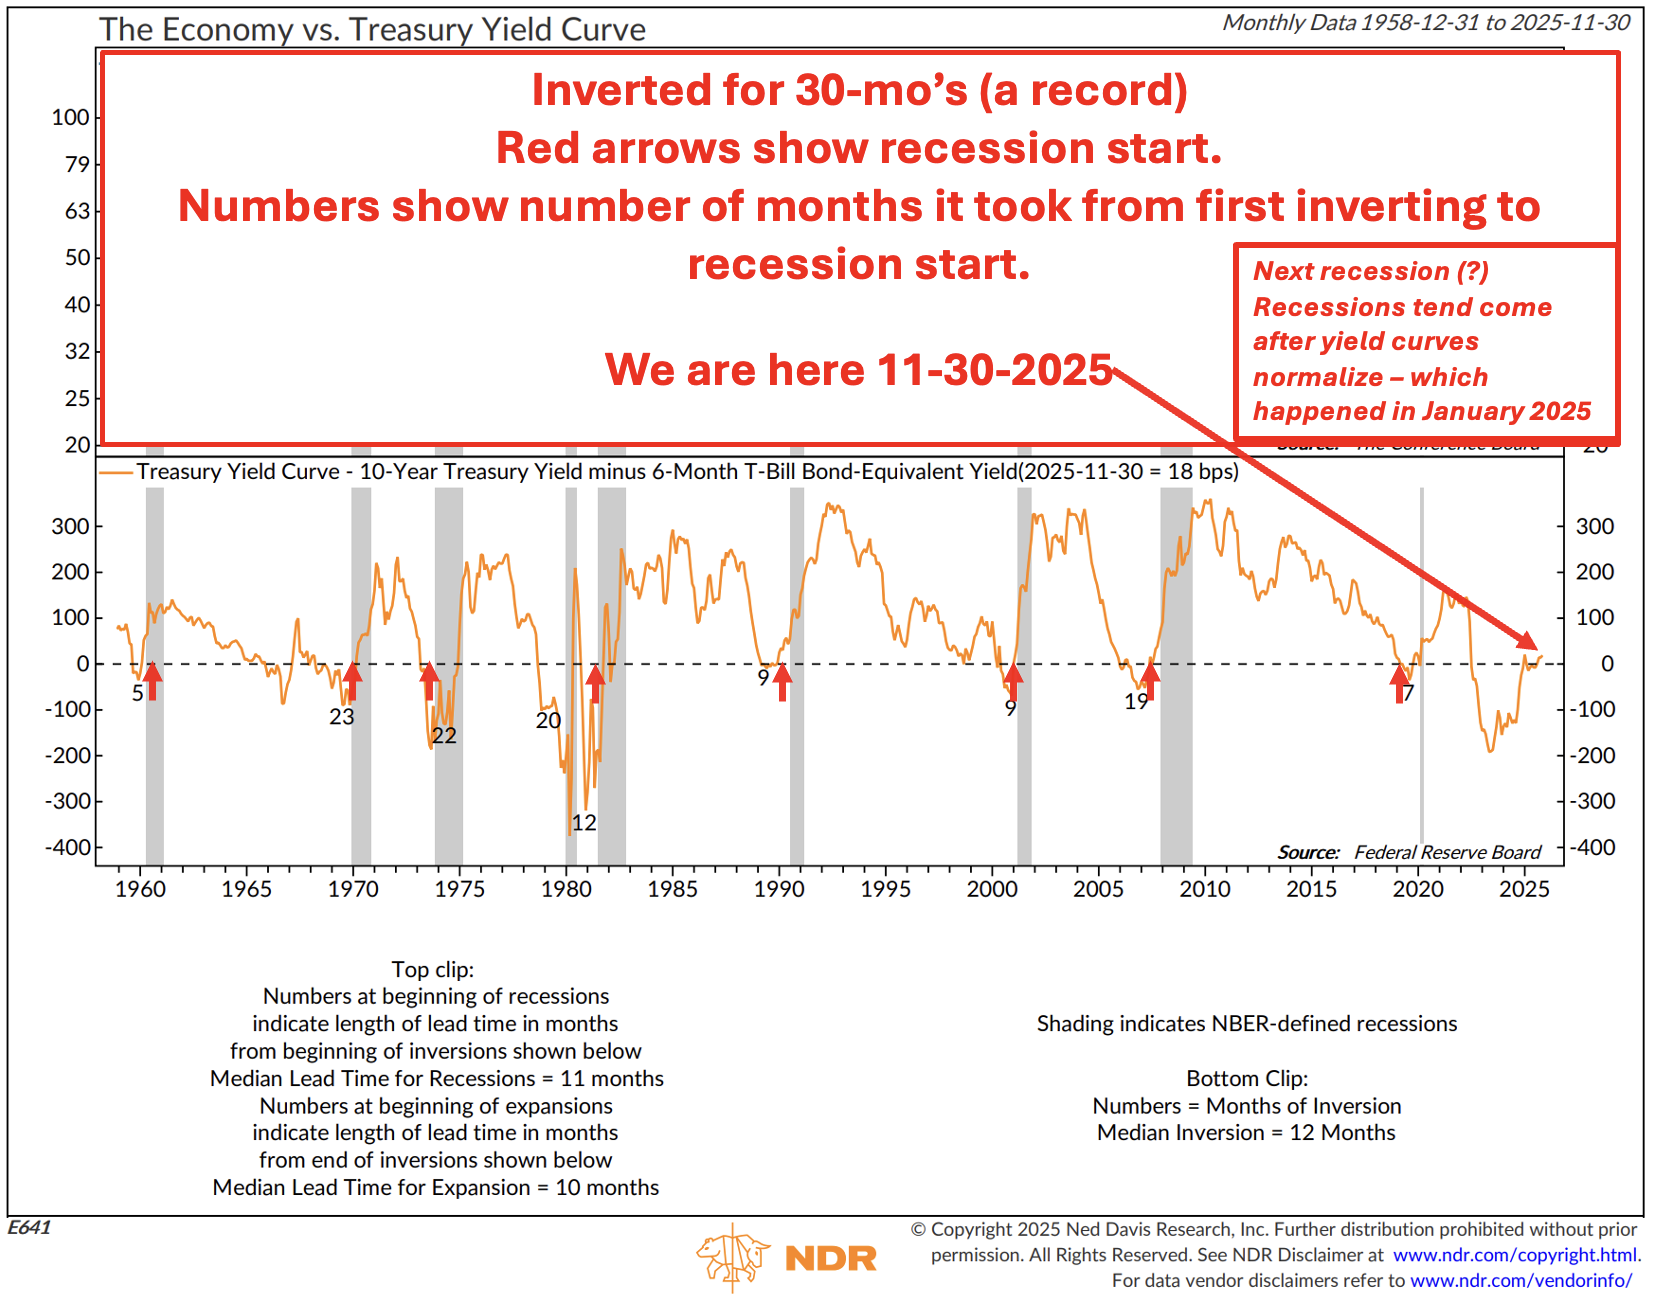
The Yield Curve’s Recession Warning
A yield curve inversion occurs when short-term interest rates rise above long-term rates, signaling tight financial conditions and rising economic stress that have historically preceded slowdowns or recessions.
Under normal conditions, short-term interest rates are lower than long-term interest rates. If you loan your money to a friend and expect to be paid back in 10 years, you expect them to pay you a higher interest rate on that loan than if you lent them the money for 3 months - simply because you are taking more risk.
Think of the yield curve as a pressure cooker.
When short-term rates rise above long-term rates, the lid locks shut. Policy is tight - credit strains. The inversion is a stress signal.
Take a look at the following chart. It shows that history is clear on one thing: recessions don’t usually begin at inversion; they start with a lag after the yield curve normalizes (when the line in the chart moves above or below the zero line). They tend to arrive later, after months of tight financial conditions (higher interest rates), quietly doing their work.
The lid on the pressure cooker doesn’t pop because dinner was ready; it pops because the pressure reached a critical level. We can measure this as the time from the normalization of the yield curve to the onset of the recession (the grey bars in the following chart).
Resteepening usually occurs because the Fed is easing into a slowdown in growth, not because long-term growth expectations are improving. The stress phase has already occurred. What follows is the lag: weaker hiring, tighter credit, softer demand.
All of the liquidity poured into the system during COVID may have distorted the timeline, but not the mechanism. The point is, the yield curve exits inversion (normalizes - moving above the zero line) about a year before economic damage, recession, shows up in the data. The clock is ticking; the yield curve normalized last January. At the end of the month, it will be one year.
How to read the following chart.
Focus on the orange line in the chart. The gray lines are past recessions. The dotted line is the 0 line. Below 0 are periods when the yield curve was inverted. Above the line: normalized.
NDR has not yet updated the chart, but the current spread between the 10-Year Yield (4.15% today) and the 6-Month Treasury Bill Yield (3.59%) is 0.56%. The orange line crossed above the 0 line on January 31, 2025; it was 0.18% above the line at the end of November 30, 2025, and 0.56% above the line on December 31, 2025.
Now look at the history of the Orange Line going back to 1958. The numbers (5, 23, 22, 20, 12…) indicate the number of months from the yield curve's first inversion to normalization (moving above the 0 line). NDR estimates that the Median number of months historically in inversion is 12. The most recent inversion lasted 19 months.
NDR calculates the “Median Lead Time” from the first inversion to the start of the recession to be 11 months. We are well past the median. The first inversion in the current cycle was in July 2022 and ended 30 months later, in January 2025. Massive deficit spending and Federal Reserve liquidity creation are likely the reasons.
No recession yet; although mixed, the economy is not showing signs of an imminent recession.
The red arrows in the lower section of the chart point to recession starts.
Lights on!
Source: NDR with CMG notations
Not a recommendation to buy or sell any security. Please note that the information provided is not recommended for buying or selling any security and is provided for discussion purposes only. Current viewpoints are subject to change. Please note that the information provided is not recommended for buying or selling any security and is provided for discussion purposes only. See important CMG and NDR disclosures below.
If you like what you are reading, click on the following link.
CLICK HERE TO SUBSCRIBE TO ON MY RADAR - IT’S FREE
Not a recommendation to buy or sell any security. Please note that the information provided is not recommended for buying or selling any security and is provided for discussion purposes only. Current viewpoints are subject to change. Please note that the information provided is not recommended for buying or selling any security and is provided for discussion purposes only.
Trade Signals: January 1, 2025 Update
Great news: I have reworked TS to be more user-friendly/easier to read. If you're on the fence about subscribing, email me and I’ll send you a free copy. If you are a regular reader, please let me know your thoughts.
Each week in Trade Signals, I step back and review the short-, intermediate-, and long-term technical trends across stocks, bonds, commodities, and gold, alongside several charts I consider critical to understanding where we are in the cycle for various asset classes.
Trend following matters because markets move in cycles, and prices often trend before fundamentals, narratives, or economic data fully adjust. Rather than trying to predict turning points, trend analysis focuses on what the market is actually doing, helping investors align with momentum while avoiding extended drawdowns.
Over time, respecting trends has proven less about maximizing upside and more about managing risk, staying invested when conditions are favorable, and stepping aside when they deteriorate. Trend following offers a disciplined way to participate without relying on perfect forecasts. The objective is to recognize trends as they emerge and respect them while they’re in force.
You’ll find the following sections, in order:
Weekly Market Commentary - A plain-English snapshot of what changed this week, and what matters most beneath the surface.
The Indicators Dashboard - A consolidated view of key technical signals across equities, investor sentiment, bonds, commodities, currencies, and gold.
Valuations and Subsequent 10-Year Returns - Where current valuations stand historically, and what they may mean in terms of forward returns.
Supporting Charts with Explanations - The technical charts that anchor the signals, with concise commentary on what they’re indicating.
Sequentially, you’ll find the following sections:
Weekly Market Commentary
The Indicators Dashboard - Stocks, Investor Sentiment, Bonds, Commodities, Currencies, and Gold
Valuations and Subsequent 10-year Returns
Supporting Charts with Explanations
Not a recommendation for you to buy or sell any security. For information purposes only. Outlook and viewpoints are subject to change at a moment's notice. This material is for discussion purposes and does not give you specific advice. Please discuss needs, goals, time horizons, and risk tolerances with your advisor.
Market Commentary
You’ll find a restructured Trade Signals that I hope is tighter and has better flow—first, a brief comment on the markets. Then we’ll take a look at the Indicators Dashboard. The idea is to have a top-down view of markets. You can stop reading there or scroll further down for all the charts with explanations.
The S&P 500 Index finished the year at a rich valuation. Median PE on 12-31-25 was 25.8. Median Price/Earnings (P/E) Ratio is the median P/E of the 500 stocks in the Standard and Poor's 500 Stock Index universe. Plot the PEs of each of the 500 stocks, from the highest PE to the lowest PE, and the median is the one in the middle. Earnings for this calculation are based on 12-month trailing figures. The orange line shows the monthly median PE from 3-31-1964 to the present.
Median Fair Value = 4757.62
It will require a 30.5% decline from the December 31, 2025, S&P 500 index close of 6845.50 to reach that level.
Valuation metrics are not a timing tool. Think of the green “We’d be better here” arrow as an excellent entry point for long-term investors. Until then, patience.
Entering 2026, interest rate signals point to higher rates. The dollar is fundamentally in a challenging place due to government deficit spending and money creation. The long-term trend signal is bearish, and the weekly is nearing a bearish turn. Gold continues to shine. The short-term MACD (8-20 days) is in a sell signal. The long-term trend remains strong. Review the commodity signals. Fundamentally undervalued, all three trend indicators are bullish.
Happy New Year! It’s going to be a great year. Let’s go.
Please let me know if you have any questions. Please email Amy@cmgwealth.com if you would like a free sample of Trade Signals.
About Trade Signals
Trade Signals is a paid subscription service that posts the daily, weekly, and monthly trends in the markets (and more). Free for CMG clients. Not a recommendation to buy or sell any security. For discussion purposes only.
“Extreme patience combined with extreme decisiveness. You may call that our investment process.
Yes, it’s that simple.”
– Charlie Munger

TRADE SIGNALS SUBSCRIPTION ACKNOWLEDGEMENT / IMPORTANT DISCLOSURES
The views expressed herein are solely those of Steve Blumenthal as of the date of this report and are subject to change without notice. Not a recommendation to buy or sell any security.
Please note that the information provided is not recommended for buying or selling any security and is provided for discussion purposes only. Current viewpoints are subject to change. Please note that the information provided is not recommended for buying or selling any security and is provided for discussion purposes only.
Personal Note: NYC, Phoenix, and Snowbird
I hope your year is off to a great start, and your New Year's celebration found you with loved ones and friends.
NYC is up next, and this visit promises to be exciting. I’m heading to the city on Monday for dinner with my daughter, Brianna. Then, early Tuesday, I’m visiting a hospital research lab in Manhasset, NY. Think bioelectronic medicine. This is one of those quietly revolutionary fields: part neuroscience, part engineering, part medicine, aiming to treat disease by modulating the body’s electrical signals rather than relying solely on drugs.
The enjoyable part about my job is finding new innovative companies that may improve people’s lives. I have no idea if there is any “there-there” with this team, but several initial boxes checked (edge in technology, and a giant addressable market).
Phoenix follows later in the month, where I’ll be attending a technology conference with plans to sneak in a few days of skiing at Snowbird on the front or back end of the trip. Fingers crossed.
Wishing you a healthy, happy, and joy-filled 2026.
Warm regards,
Steve
CLICK HERE TO SUBSCRIBE TO ON MY RADAR - IT’S FREE
You can share this letter on X by clicking here.
You can share this letter on LinkedIn by clicking here.
Subscribe to OMR for free by clicking the photo.
Stephen B. Blumenthal
Executive Chairman & CIO
CMG Capital Management Group, Inc.
75 Valley Stream Parkway, Suite 201,
Malvern, PA 19355
CMG Customer Relationship Summary (Form CRS)
Metric-Financial, LLC Customer Relationship Summary (Form CRS)

Stephen Blumenthal founded CMG Capital Management Group in 1992 and serves today as its Executive Chairman and CIO. Steve authors a free weekly e-letter entitled, “On My Radar.” Steve shares his views on macroeconomic research, valuations, portfolio construction, asset allocation and risk management. Author of Forbes Book: On My Radar, Navigating Stock Market Cycles.
Follow Steve on X @SBlumenthalCMG and LinkedIn.
IMPORTANT DISCLOSURE INFORMATION
This document is prepared by CMG Capital Management Group, Inc. (“CMG”) and is circulated for informational and educational purposes only. There is no consideration given to the specific investment needs, objectives, or tolerances of any of the recipients. Additionally, CMG’s actual investment positions may, and often will, vary from its conclusions discussed herein based on any number of factors, such as client investment restrictions, portfolio rebalancing, and transaction costs, among others. Recipients should consult their own advisors, including tax advisors, before making any investment decision. This material is for informational and educational purposes only and is not an offer to sell or the solicitation of an offer to buy the securities or other instruments mentioned. This material does not constitute a personal recommendation or take into account the particular investment objectives, financial situations, or needs of individual investors which are necessary considerations before making any investment decision. Investors should consider whether any advice or recommendation in this research is suitable for their particular circumstances and, where appropriate, seek professional advice, including legal, tax, accounting, investment, or other advice. The views expressed herein are solely those of Steve Blumenthal as of the date of this report and are subject to change without notice.
Investing involves risk.
This letter may contain forward-looking statements relating to the objectives, opportunities, and future performance of the various investment markets, indices, and investments. Forward-looking statements may be identified by the use of such words as; “believe,” anticipate,” “planned,” “potential,” and other similar terms. Examples of forward-looking statements include, but are not limited to, estimates with respect to financial condition, results of operations, and success or lack of success of any particular market, index, investment, or investment strategy. All are subject to various factors, including, but not limited to, general and local economic conditions, changing levels of competition within certain industries and markets, changes in legislation or regulation, Federal Reserve policy, and other economic, competitive, governmental, regulatory, and technological factors affecting markets, indices, investments, investment strategy and portfolio positioning that could cause actual results to differ materially from projected results. Such statements are forward-looking in nature and involve a number of known and unknown risks, uncertainties, and other factors, and accordingly, actual results may differ materially from those reflected or contemplated in such forward-looking statements. Investors are cautioned not to place undue reliance on any forward-looking statements or examples. All statements made herein speak only as of the date that they were made. Investing is inherently risky and all investing involves the potential risk of loss.
Past performance does not guarantee or indicate future results. Different types of investments involve varying degrees of risk, and there can be no assurance that the future performance of any specific investment, investment strategy, or product (including the investments and/or investment strategies recommended or undertaken by CMG), or any non-investment related content, made reference to directly or indirectly in this commentary will be profitable, equal any corresponding indicated historical performance level(s), be suitable for your portfolio or individual situation or prove successful. Due to various factors, including changing market conditions and/or applicable laws, the content may no longer be reflective of current opinions or positions. Moreover, you should not assume that any discussion or information contained in this commentary serves as the receipt of, or as a substitute for, personalized investment advice from CMG. Please remember to contact CMG, in writing, if there are any changes in your personal/financial situation or investment objectives for the purpose of reviewing/evaluating/revising our previous recommendations and/or services, or if you would like to impose, add, or to modify any reasonable restrictions to our investment advisory services. Unless, and until, you notify us, in writing, to the contrary, we shall continue to provide services as we do currently. CMG is neither a law firm, nor a certified public accounting firm, and no portion of the commentary content should be construed as legal or accounting advice.
No portion of the content should be construed as an offer or solicitation for the purchase or sale of any security. References to specific securities, investment programs or funds are for illustrative purposes only and are not intended to be, and should not be interpreted as recommendations to purchase or sell such securities.
This presentation does not discuss, directly or indirectly, the amount of the profits or losses realized or unrealized, by any CMG client from any specific funds or securities. Please note: In the event that CMG references performance results for an actual CMG portfolio, the results are reported net of advisory fees and inclusive of dividends. The performance referenced is that as determined and/or provided directly by the referenced funds and/or publishers, has not been independently verified, and does not reflect the performance of any specific CMG client. CMG clients may have experienced materially different performance based upon various factors during the corresponding time periods. See in links provided citing limitations of hypothetical back-tested information. Past performance cannot predict or guarantee future performance. Not a recommendation to buy or sell. Please talk to your advisor.
Information herein has been obtained from sources believed to be reliable, but we do not warrant its accuracy. This document is general communication and is provided for informational and/or educational purposes only. None of the content should be viewed as a suggestion that you take or refrain from taking any action nor as a recommendation for any specific investment product, strategy, or other such purposes.
In a rising interest rate environment, the value of fixed-income securities generally declines, and conversely, in a falling interest rate environment, the value of fixed-income securities generally increases. High-yield securities may be subject to heightened market, interest rate, or credit risk and should not be purchased solely because of the stated yield. Ratings are measured on a scale that ranges from AAA or Aaa (highest) to D or C (lowest). Investment-grade investments are those rated from highest down to BBB- or Baa3.
NOT FDIC INSURED. MAY LOSE VALUE. NO BANK GUARANTEE.
Certain information contained herein has been obtained from third-party sources believed to be reliable, but we cannot guarantee its accuracy or completeness.
In the event that there has been a change in an individual’s investment objective or financial situation, he/she is encouraged to consult with his/her investment professional.
Written Disclosure Statement. CMG is an SEC-registered investment adviser located in Malvern, Pennsylvania. Stephen B. Blumenthal is CMG’s founder and CEO. Please note: The above views are those of CMG and its CEO, Stephen Blumenthal, and do not reflect those of any sub-advisor that CMG may engage to manage any CMG strategy, or exclusively determines any internal strategy employed by CMG. A copy of CMG’s current written disclosure statement discussing advisory services and fees is available upon request or via CMG’s internet web site at www.cmgwealth.com/disclosures. CMG is committed to protecting your personal information. Click here to review CMG’s privacy policies.
See CMG Disclosures at the bottom of this page.
For more information about NDR, please visit at www.ndr.com.
NDR, Inc. (NDR), d.b.a. Ned Davis Research Group (NDRG), any NDRG affiliates or employees, or any third-party data provider, shall not have any liability for any loss sustained by anyone who has relied on the information contained in any NDRG publication. The data and analysis contained herein are provided "as is." NDRG disclaims any and all express or implied warranties, including, but not limited to, any warranties of merchantability, suitability or fitness for a particular purpose or use. NDRG's past recommendations and model results are not a guarantee of future results. This communication reflects our analysts' opinions as of the date of this communication and will not necessarily be updated as views or information change. All opinions expressed herein are subject to change without notice. NDRG or its affiliated companies or their respective shareholders, directors, officers and/or employees, may have long or short positions in the securities discussed herein and may purchase or sell such securities without notice. For NDRG's important additional disclaimers, refer to www.ndr.com/invest/public/copyright.html. Further distribution prohibited without prior permission. Copyright 2025 © NDR, Inc. All rights reserved.