On My Radar: Rising Tide

July 2, 2026
By Steve Blumenthal
“All the Perplexities, Confusions and Distresses in America arise not from defects in their Constitutions or Confederation, not from a want of Honour or Virtue, So much as from downright Ignorance of the Nature of Coin, Credit and Circulation.”
- John Adams, letter to Thomas Jefferson, August 25, 1787 (Founders Online, National Archives)
Near dusk on a recent long weekend down the Jersey Shore (about 90 minutes from us - Philadelphians say "down the shore," never "to the beach"), I found myself watching a person near the waterline. Chair, cooler, umbrella, all set at a comfortable distance from the water. Every twenty minutes or so, he'd drag everything back a few feet. He was watching the rising tide.
By the time the sun set, the spot where he'd started was underwater.
Wall Street spends its days debating the waves: earnings, valuations, the Fed, geopolitics, AI. This week, let’s take a look at the tide - money itself. How much of it there is, how fast it's growing, and what it means for the prices of everything we own. Plus, we are halfway through 2026; you’ll also find a mid-year update on valuations and another look at record margin debt.
Grab that coffee and settle into your favorite chair. Hopefully, a beach chair.
On My Radar:
Personal Note: Happy 250th Birthday, America
OMR is for informational and educational purposes only. No consideration is given to your specific investment needs, objectives, or tolerances.
Please see the Important Disclosures at the bottom of this page. Reminder: This is not a recommendation to buy or sell any security. My views may change at any time. The information is for discussion and educational purposes only.
If you like what you are reading, you can subscribe for free.

97.5% and What It Really Tells Us
Raoul Pal, founder of Global Macro Investor, posted a striking claim on X last week: the NASDAQ is 97.5% correlated to total global liquidity. In his words, stock prices have almost nothing to do with earnings and everything to do with how much money the world's central banks are printing. Valuation, he argues, stopped working the moment we started debasing the currency.
Is he right? Partly. First, some caution.
Pal's 97.5% is a correlation between the two data series, both of which rise over time. Almost any two rising lines will show a near-perfect correlation measured this way. The NASDAQ is also highly "correlated" with the national debt, nominal GDP, and the cumulative number of coffees I've had on Friday mornings.
Statisticians have a name for this: “spurious correlation,” and researchers have flagged that both asset prices and global liquidity are trending, non-stationary series, which can make correlation analysis misleading. Measured the honest way, comparing growth rates rather than levels, the relationship is real and meaningful, but well below 97%. And "nothing to do with earnings" goes too far: NASDAQ earnings have compounded enormously since 2012, and earnings rise with liquidity too. You can't untangle them with one chart. Source
The kernel of Pal's argument is one we've been writing about for years through the lens of Ray Dalio's long-term debt cycle. When governments run large deficits, and central banks accommodate them, the money supply grows, and asset prices measured in that money rise with the tide. Look at the water level today: U.S. M2 is at the highest level it's ever been, topping $23.05 trillion as of May, growing 5.58% year-over-year, after the rare contraction of 2023.
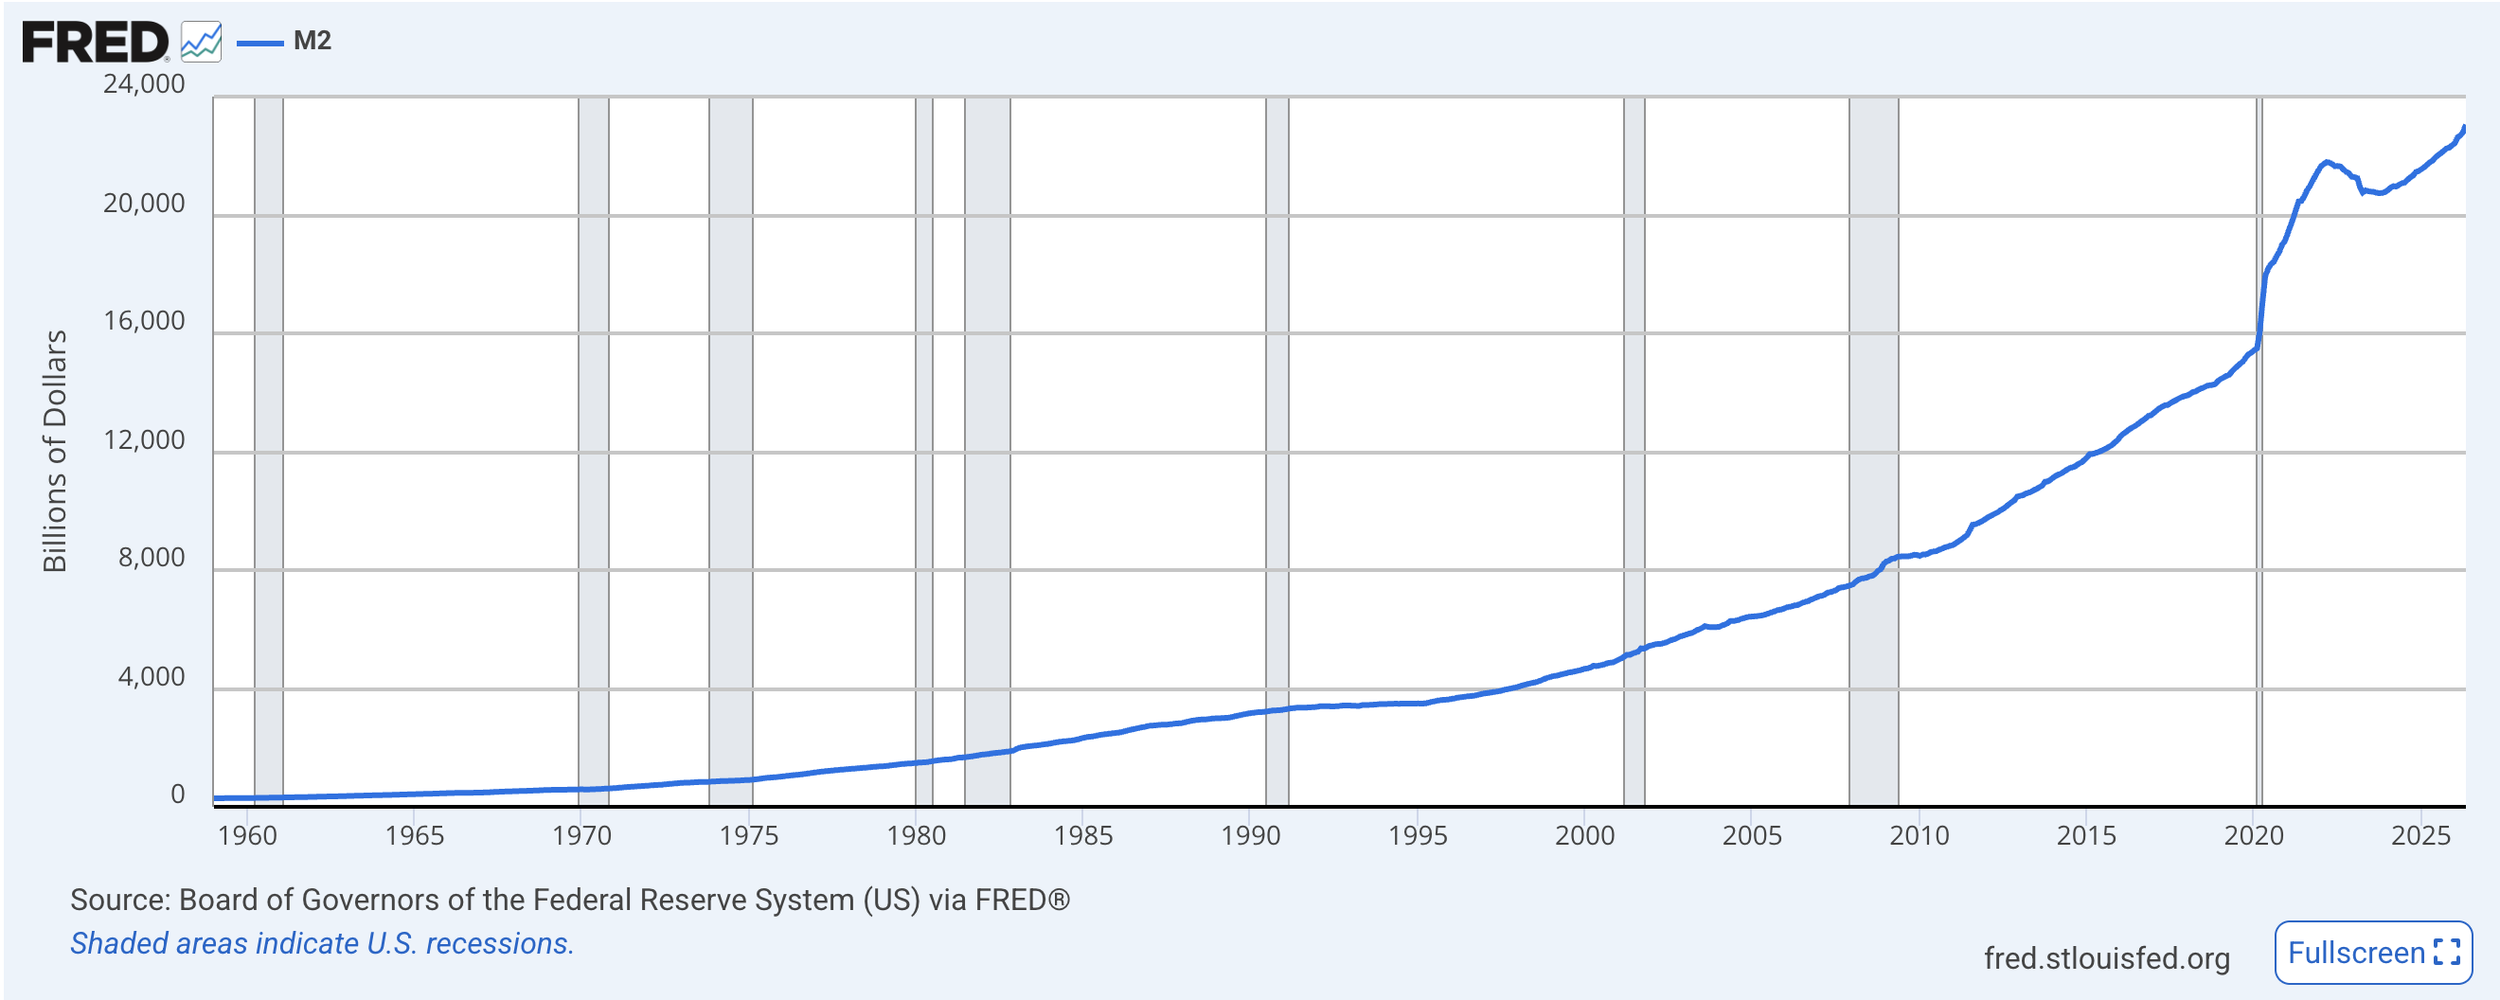
Add the Eurozone, China, and Japan, and global M2 stands at roughly $101.7 trillion. Pal's broader liquidity measure, he says, grows at approximately 8% annually, which is his hurdle rate that an investor must clear just to avoid losing purchasing power. Source
The boats rise because the water is rising. On that, Pal and I agree.
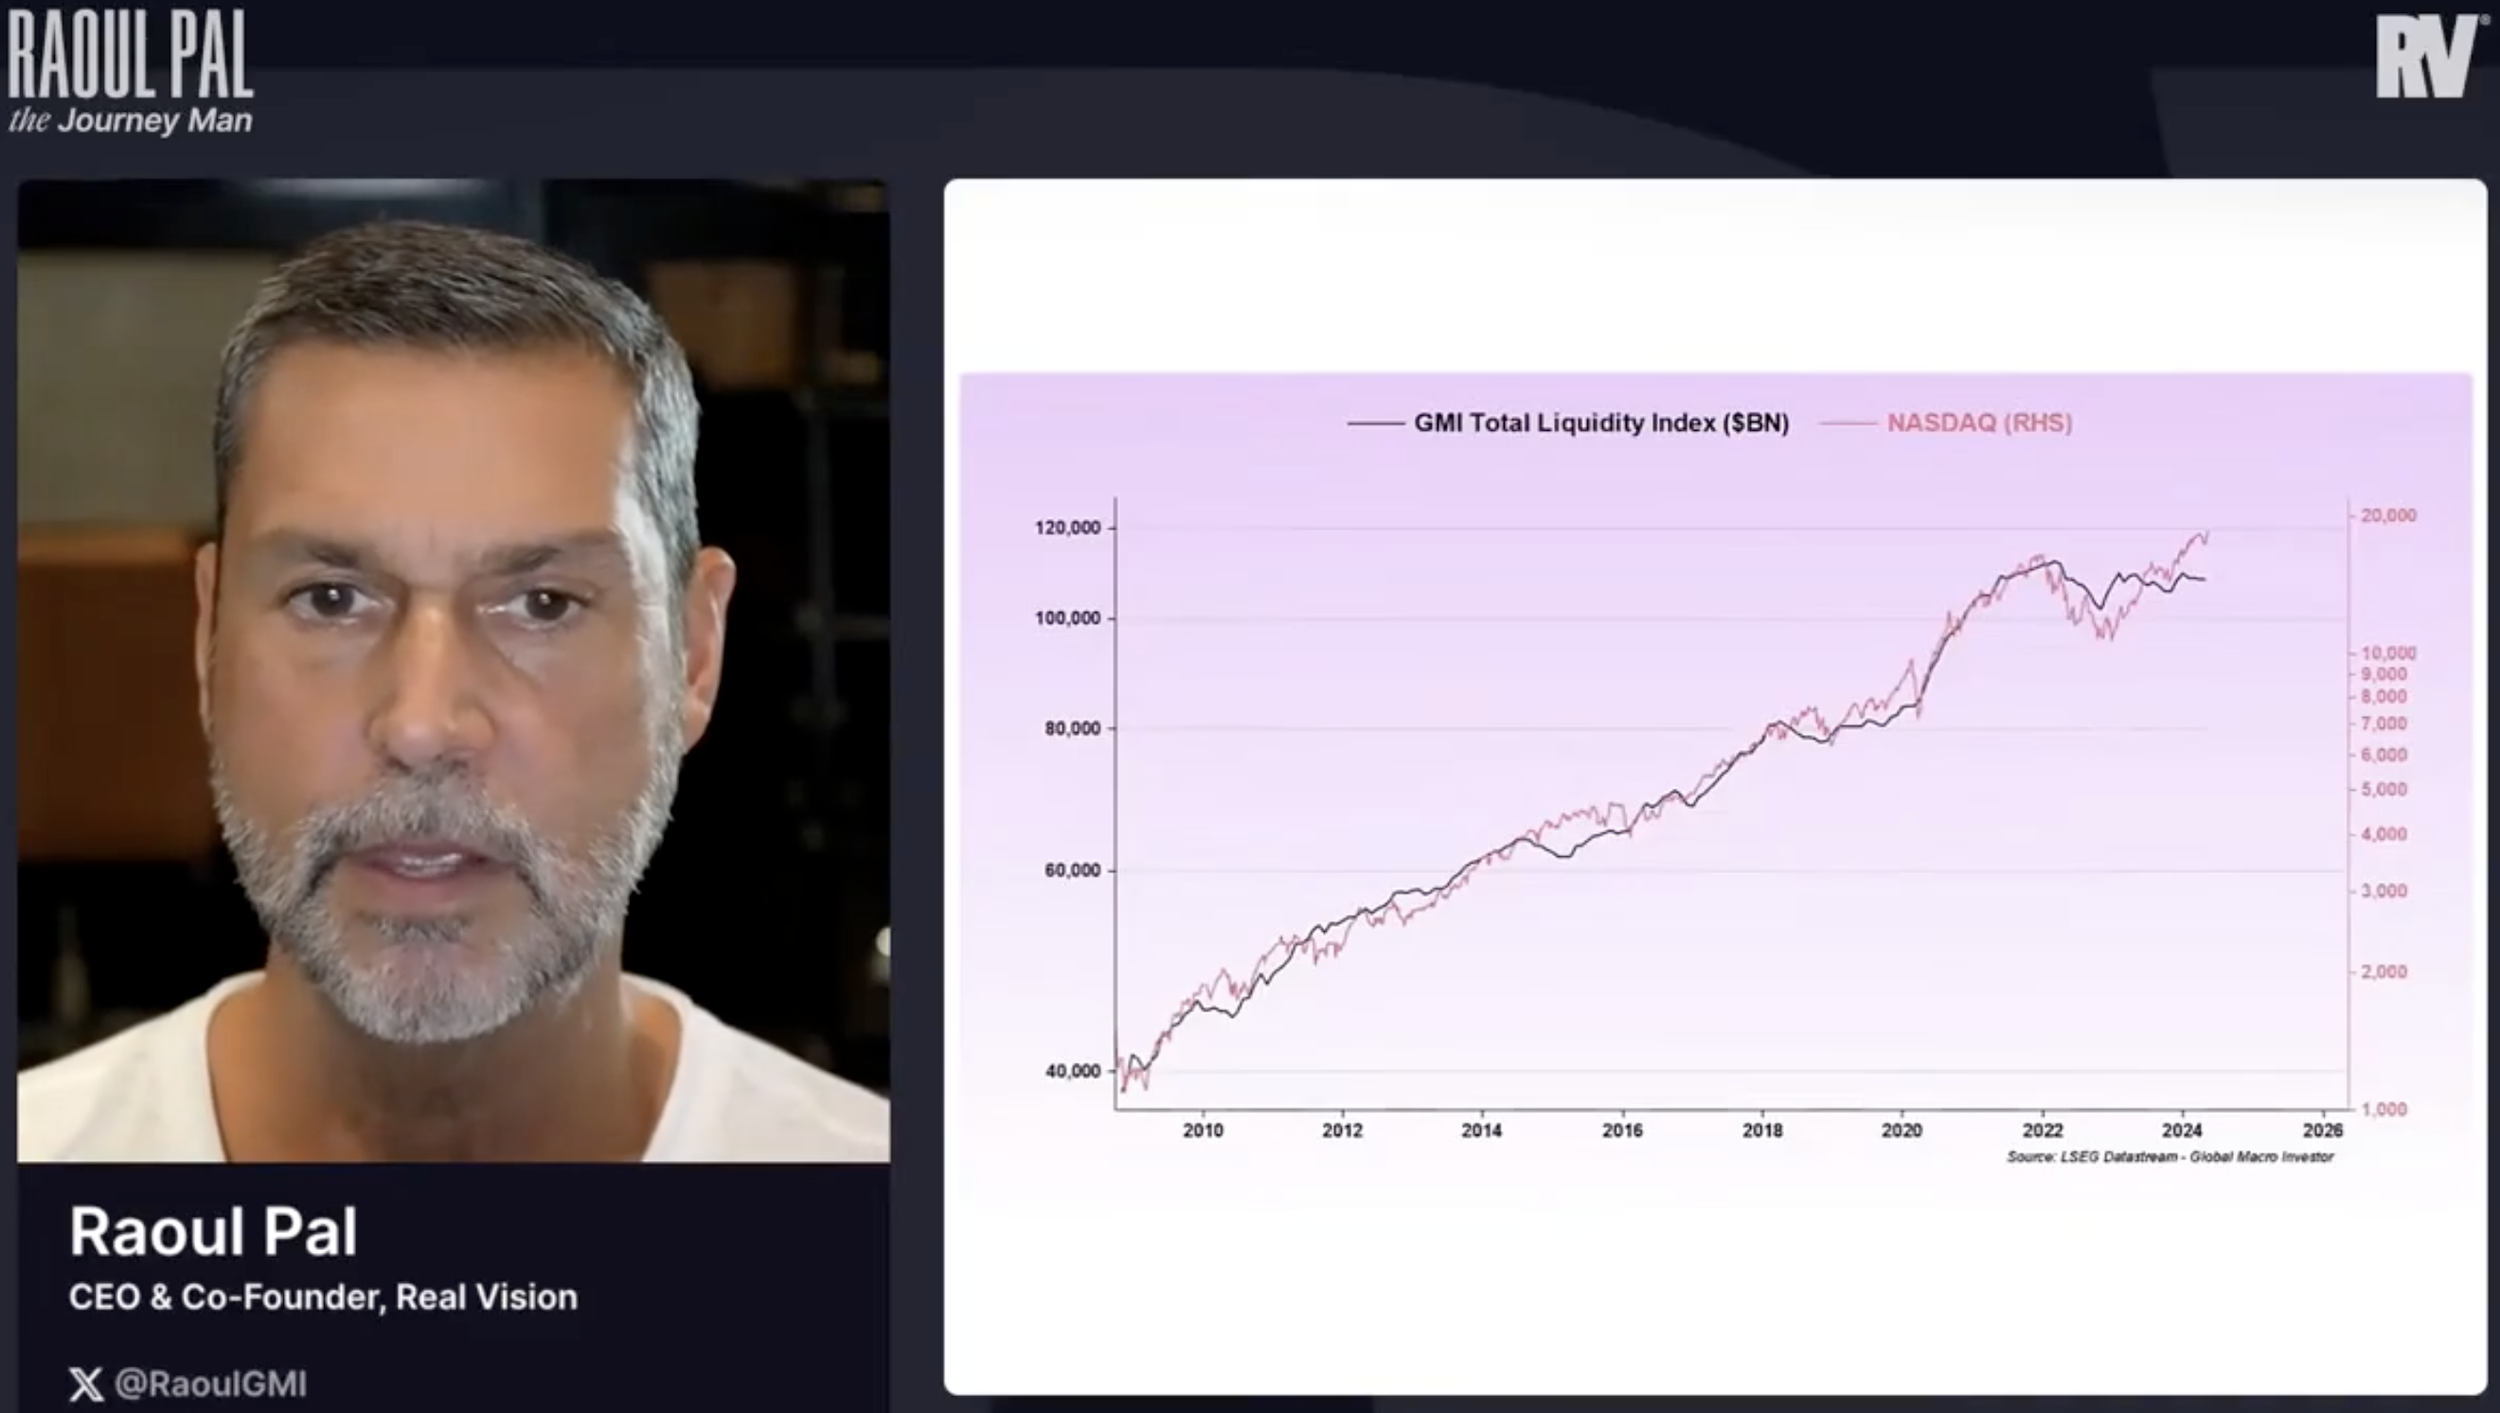
Here's where we part ways: liquidity explains price levels — it does not repeal valuation. And, critically, the correlation cuts both ways. When liquidity contracted in 2022, the NASDAQ fell 33%. If the market truly runs on the water level, then the thing to watch isn't earnings season. It's the tide chart. Which brings me to Fed Chair Warsh, who told the ECB Forum in Sintra this week that the Fed's balance sheet is too high and hampers the transmission of monetary policy.
These are warning comments that potentially precede the selling of Treasury notes and bonds. Warsh wasn't musing. I think this is something we should factor into our thinking. Remember the “Powell Pivot"? I don’t see that in the future. More like the “Warsh Wrench.” File that away. You heard it here first.
You can share this letter on X by clicking here.
Opinions are subject to change. Not a recommendation to buy or sell any security. Please note that the information provided is not recommended for buying or selling any security and is provided for discussion purposes only.
If you like what you are reading, click on the link and share it with a friend (it’s free).
CLICK HERE TO SUBSCRIBE TO ON MY RADAR - IT’S FREE
Not a recommendation to buy or sell any security. Please note that the information provided is not intended to recommend buying or selling any security and is for discussion purposes only. Current viewpoints are subject to change. Please note that the information provided is not recommended for buying or selling any security and is provided for discussion purposes only.
Mid-Year Valuations and Leverage
If liquidity is the tide, valuation is the depth of your keel. Simply, it tells you how much room you have before you hit the rocks.
The first half of 2026 was extraordinary. The Dow climbed 8.9%, its best first half since 2021. The S&P 500 rose 9.6%, the Nasdaq climbed 12.8%, and the Russell 2000 surged nearly 22%, its best first half since 1991. CNBC
Valuations also rose. Let’s look at a few:
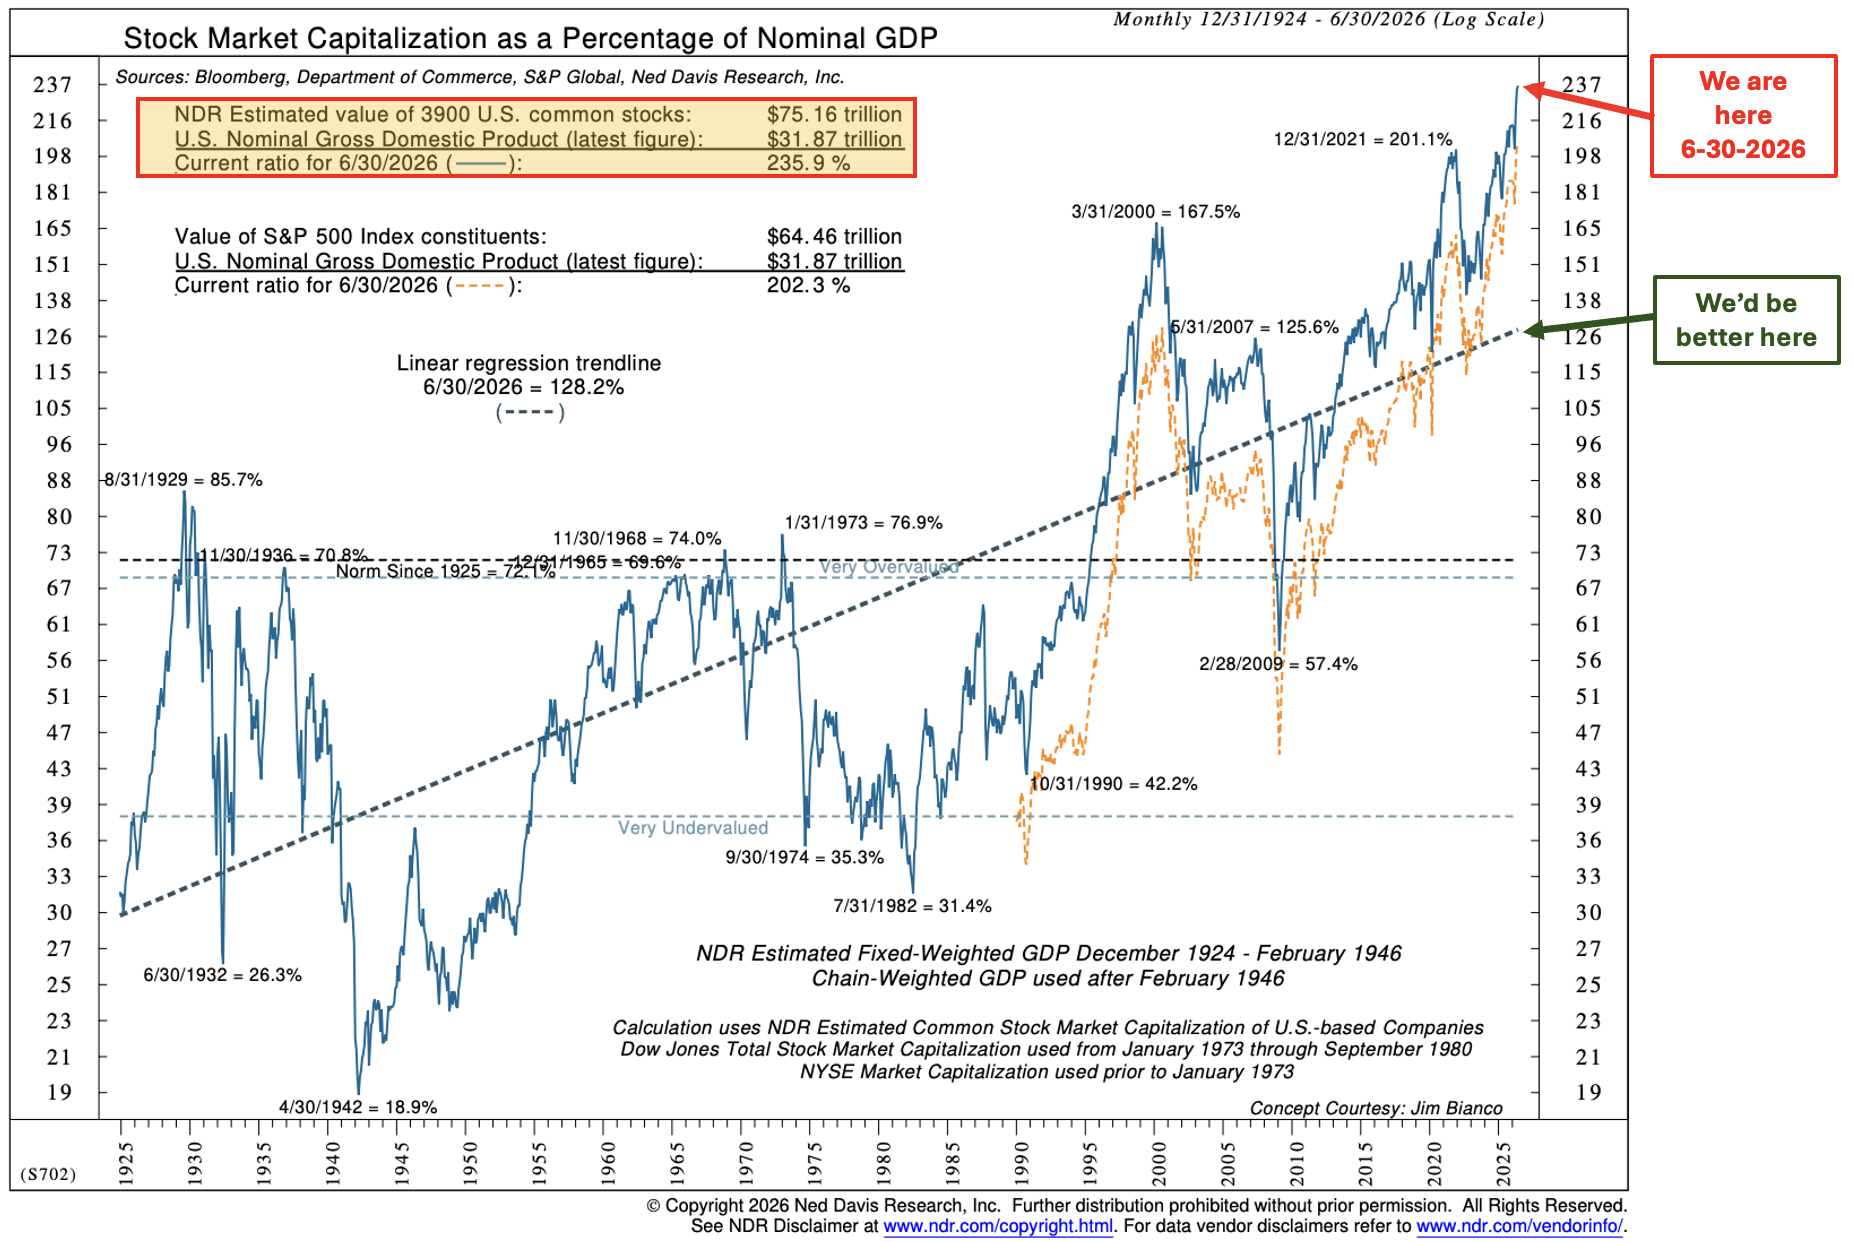
The Buffett Indicator
It is the distance from the top of the red arrow to the green arrow that concerns me most.
Compare past periods to gauge the size of the current bubble.
Source: NDR w CMG Investment Research notations
Shiller PE
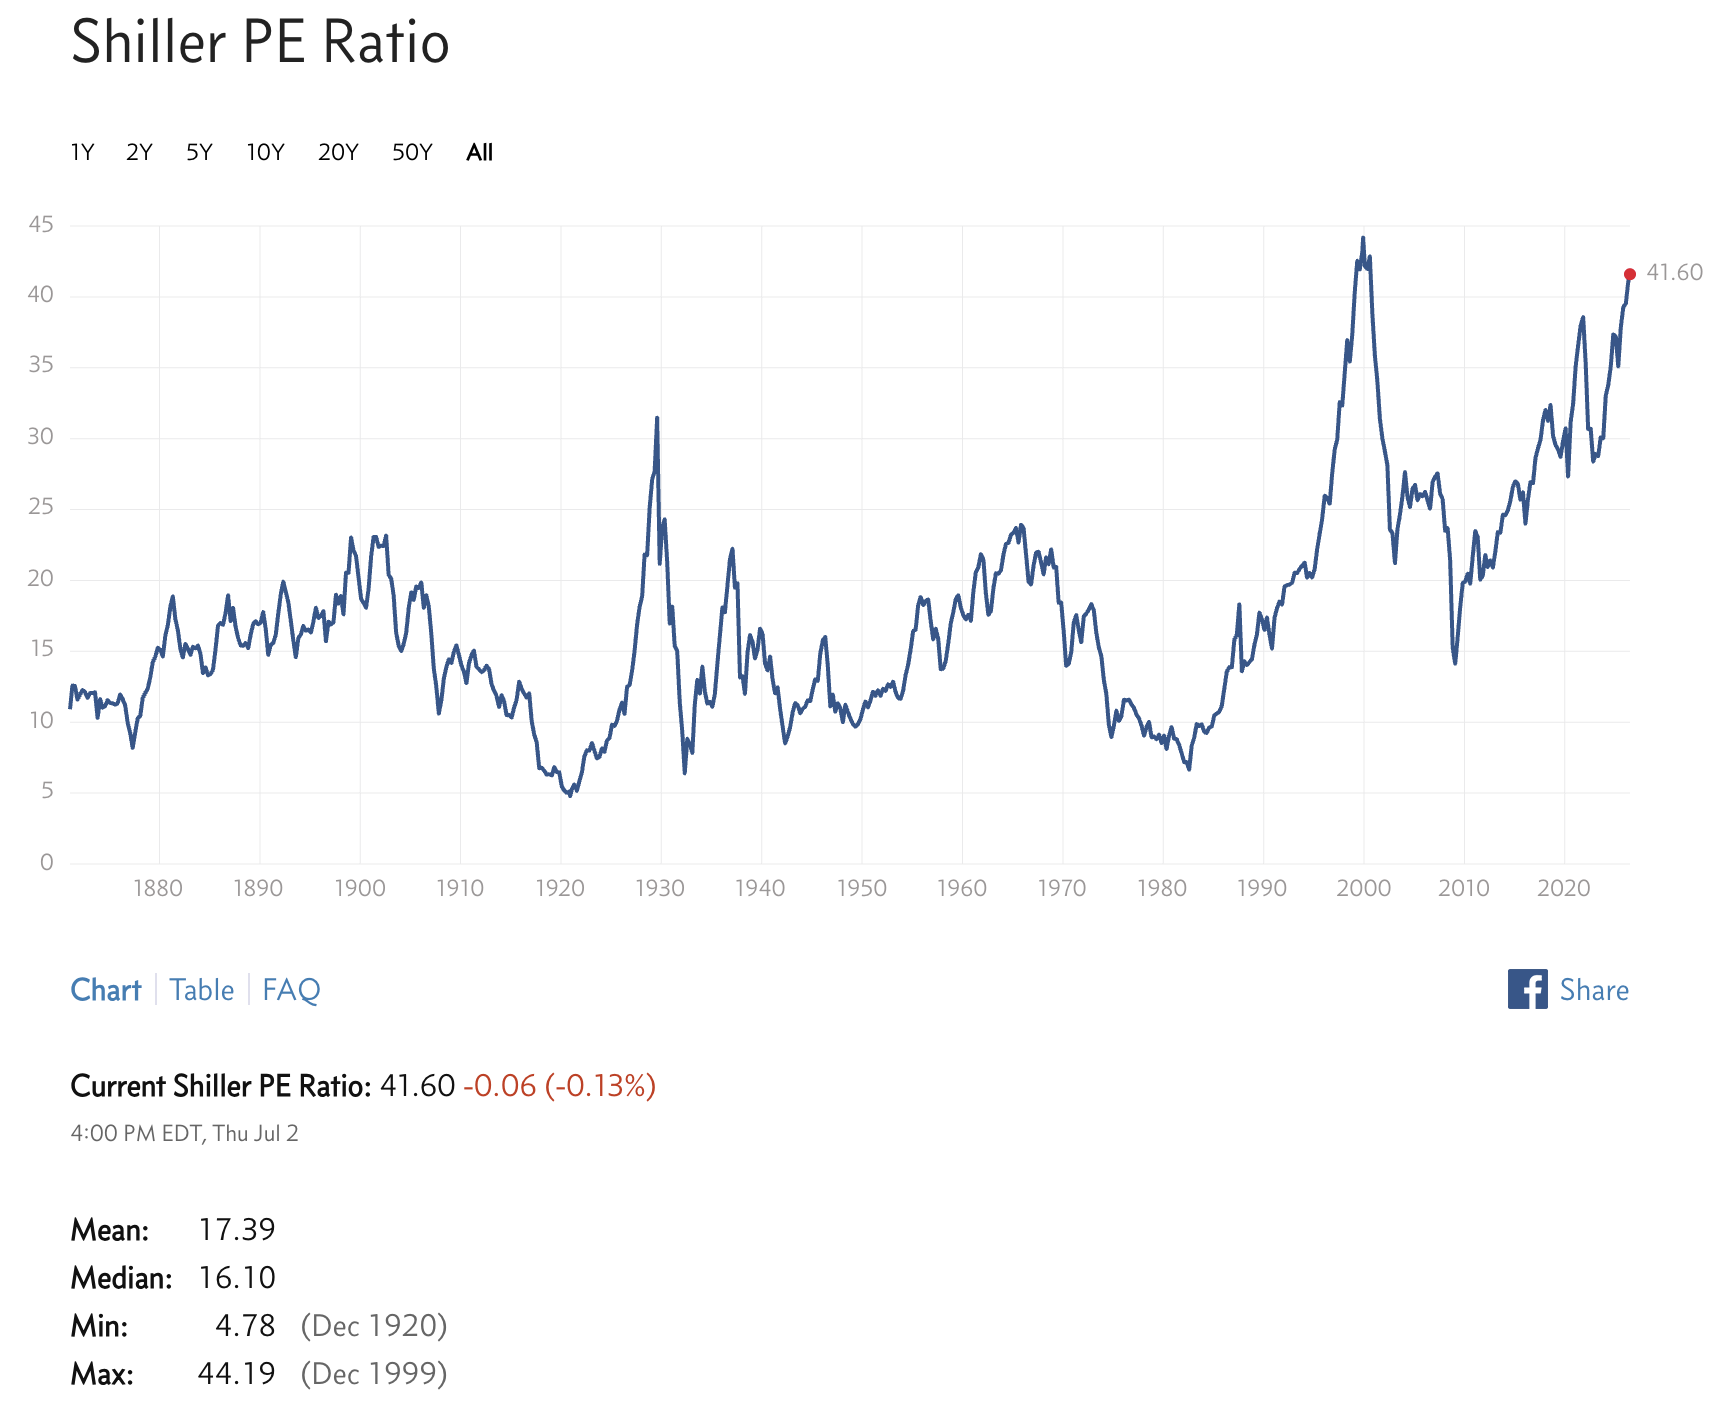
The Shiller P/E compares price to 10 years of inflation-adjusted earnings. It sits at 41.60.
The all-time record is 44.2, touched this past January.
The median across 155 years of data is roughly 16.
We are not merely above average; we are in the thinnest air the U.S. stock market has ever breathed, save a few months around the dot-com peak and this cycle's own January high.
At this level, the implied future annual return is 1.5%. Not per quarter. Per year, for a decade. Source
The historical return data in the next chart, broken down into deciles, is also informative.
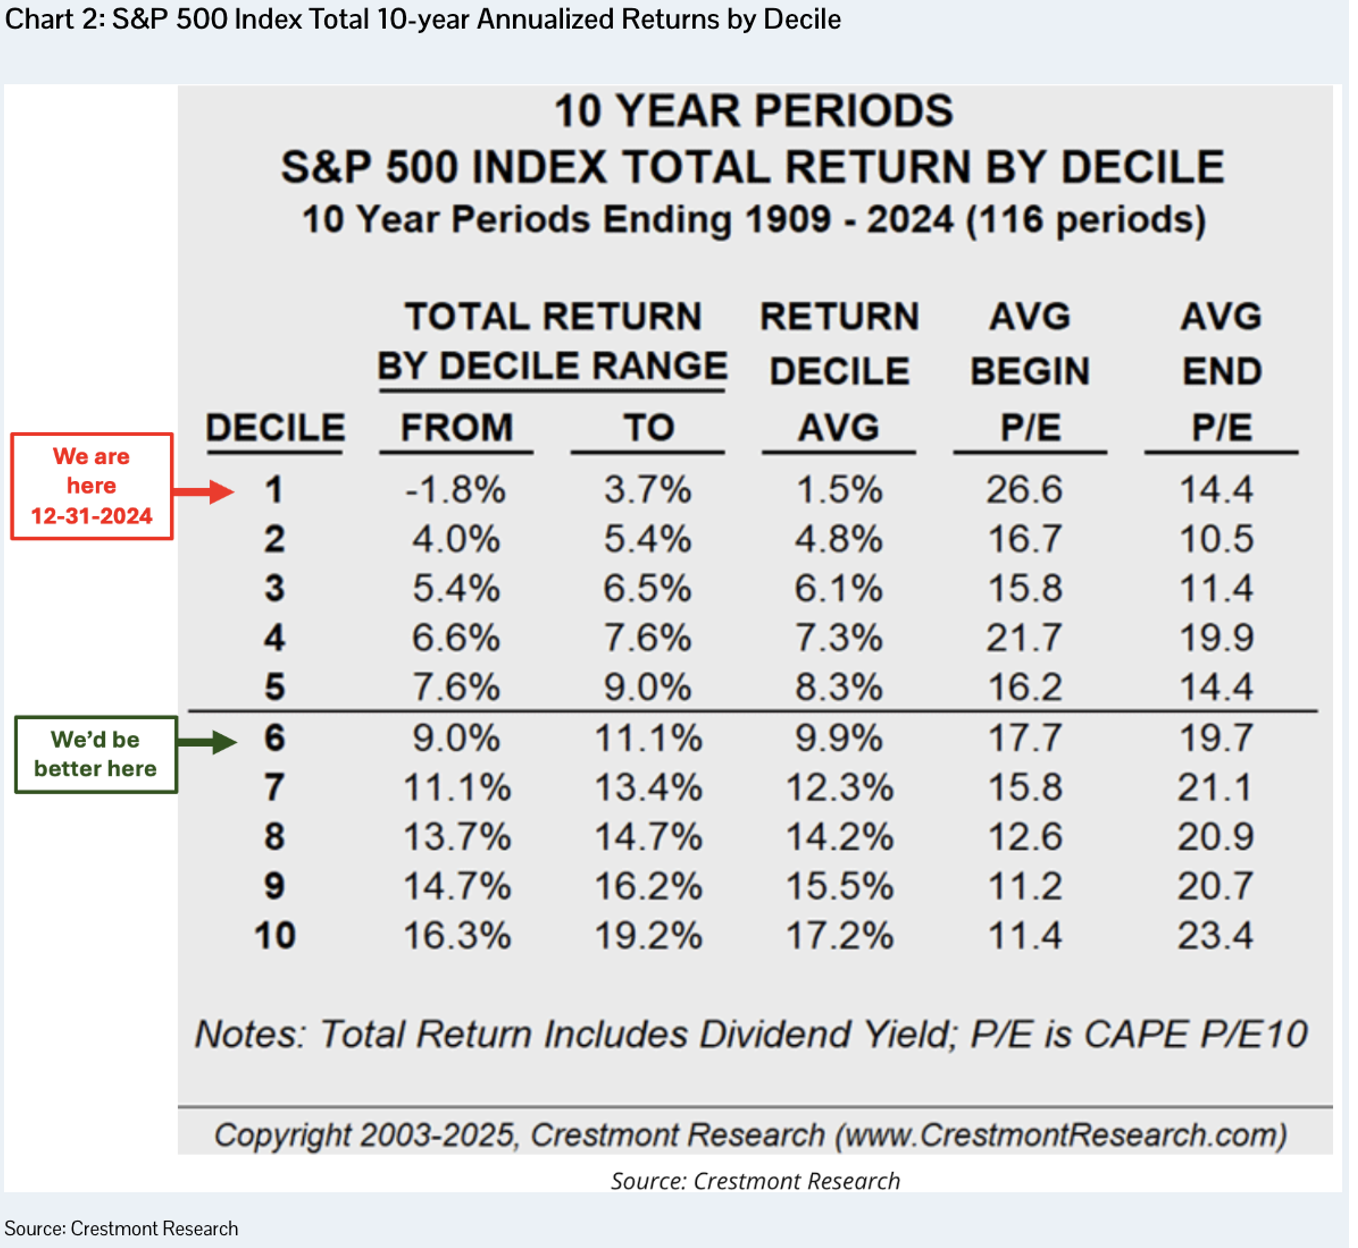
Now, Pal might say the denominator is broken, that a high multiple just tells you how much money has been printed. There's some truth in that, but here's what the liquidity argument cannot explain away: valuation has never predicted the next twelve months well, and, as you can see in the chart above, it has never predicted the next ten years poorly.
Starting points matter. Every dollar you commit at a CAPE of 41 buys you a fraction of the future earnings that same dollar would buy at a CAPE of 20. No amount of liquidity changes that arithmetic. It only changes how long the music plays.
Median PE
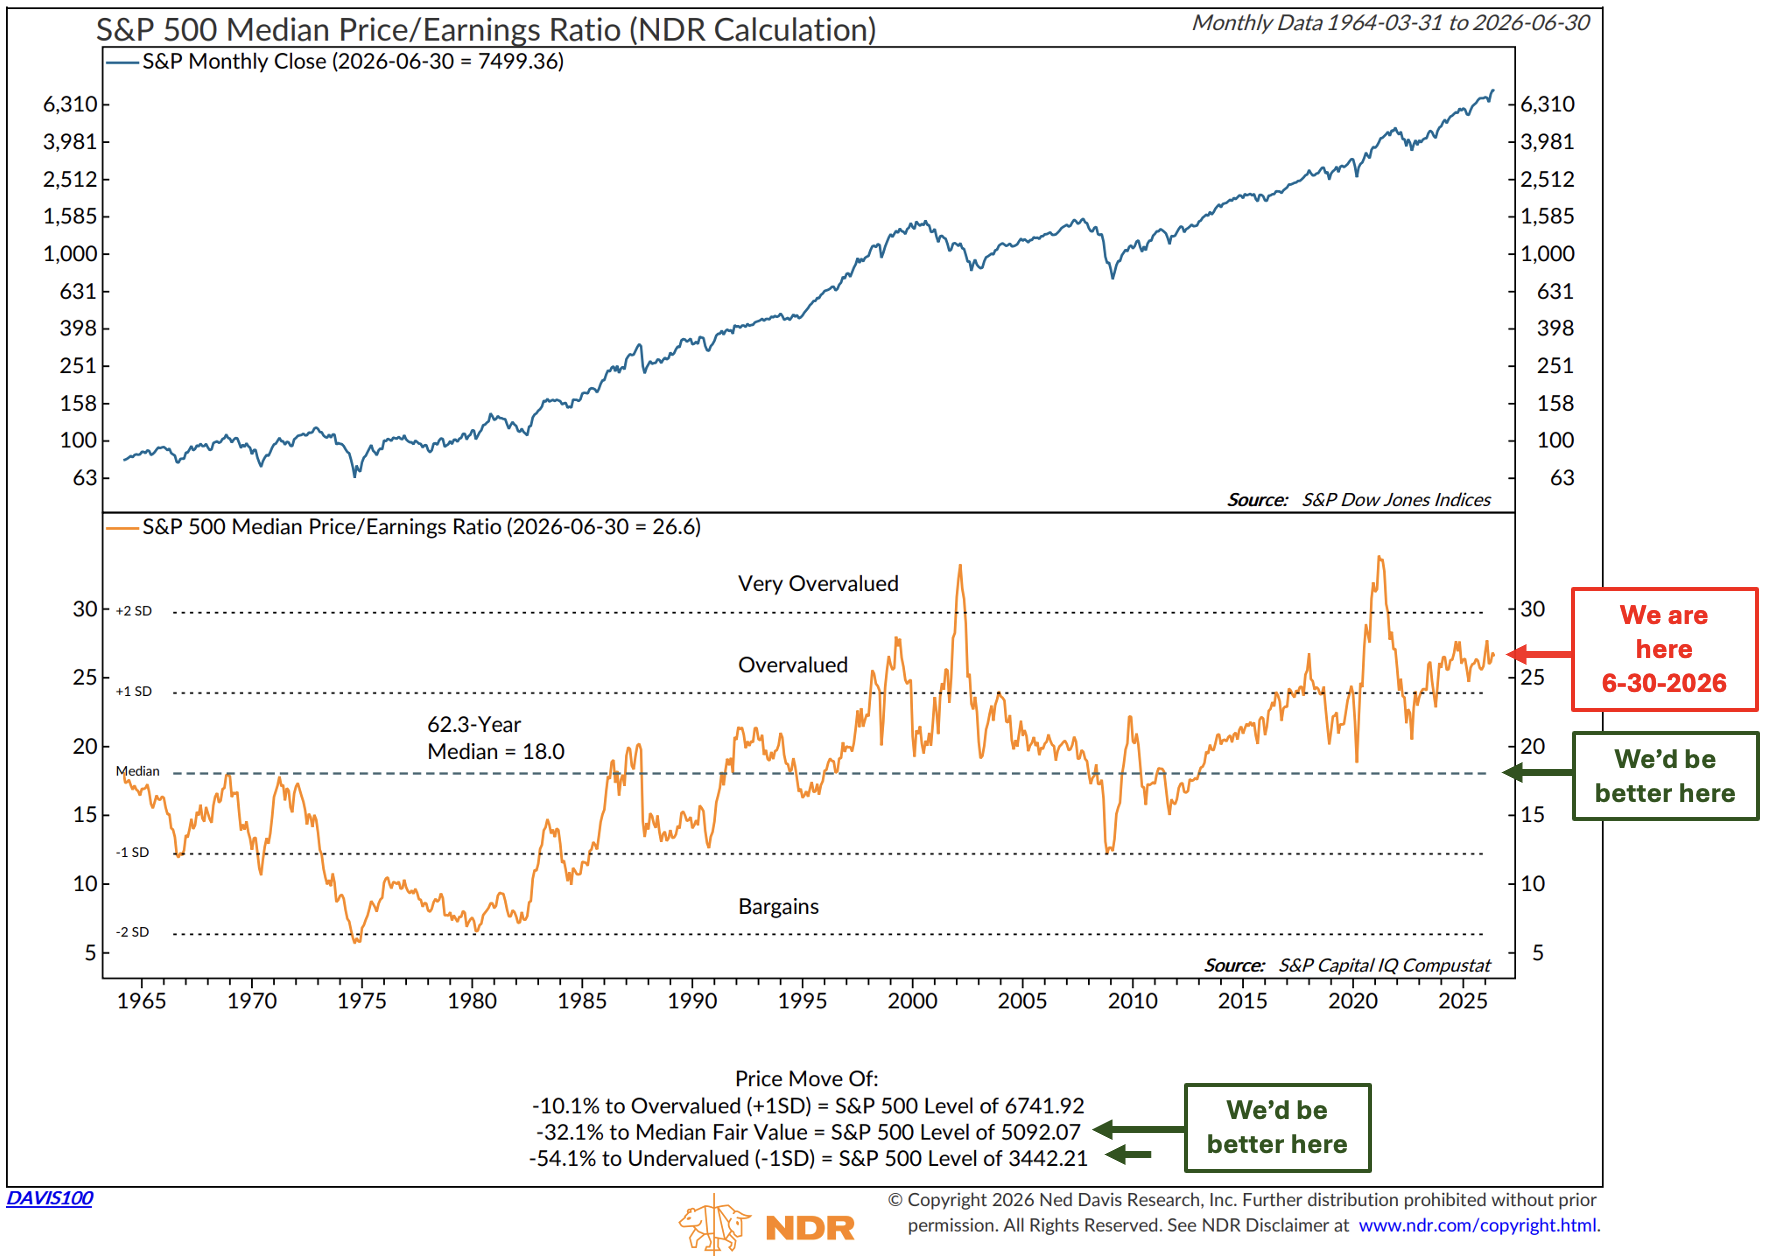
Long-time readers know this chart well.
View the next chart with the following in mind:
There are 500 stocks in the S&P 500 Index. If we took the trailing 12-month price-to-earnings ratio of each stock and ranked them from highest to lowest P/E, the median would be the P/E of the stock in the middle of the group.
The chart plots the median pe at the end of each month back to 1964.
The middle section (orange line) reflects the data over time.
NDR shows the “Median” over the last 62.3 years is a PE of 18. Think of that as “fair value” or your buying into the S&P 500 index at a good price (see green arrow).
The bottom section shows “Overvalued,” “Median Fair Value,” and “Undervalued.”
A bear market correction back to the 5,000 level is a good entry target.
Until then, hedge and risk manage exposure (though not specific advice for you - not a recommendation. Speak with your advisor.)
Source:NDR, CMG Investment Research
Margin Debt - A Fragility Gauge
Remember the Adams quote that opened this letter: coin, credit, and circulation? Here's the very next sentence he wrote to Jefferson (that was in 1787):
“When interest of twenty, thirty, even fifty percent can be made, and hopes of growing capital five hundred percent are opened by Speculations in the Stocks, commerce will not thrive.”
He warned it would overturn both commerce and government in any nation in Europe. In the same breath, he warned about leveraged stock speculation.
Some things about markets never change. Only the size of the numbers.
Hidden below the surface is margin debt.
It's credit, not money supply, and that total, according to FINRA, is $1.42 trillion. It doesn't appear anywhere in the Fed's $23 trillion M2 figure. More liquidity to raise the tide.
Hard not to see that happening right now. I find this next chart useful:
Focus on the middle section.
As long as the orange line is above the dotted black line, the liquidity train rolls on.
A drop below the line may be an early warning signal. Lights on.
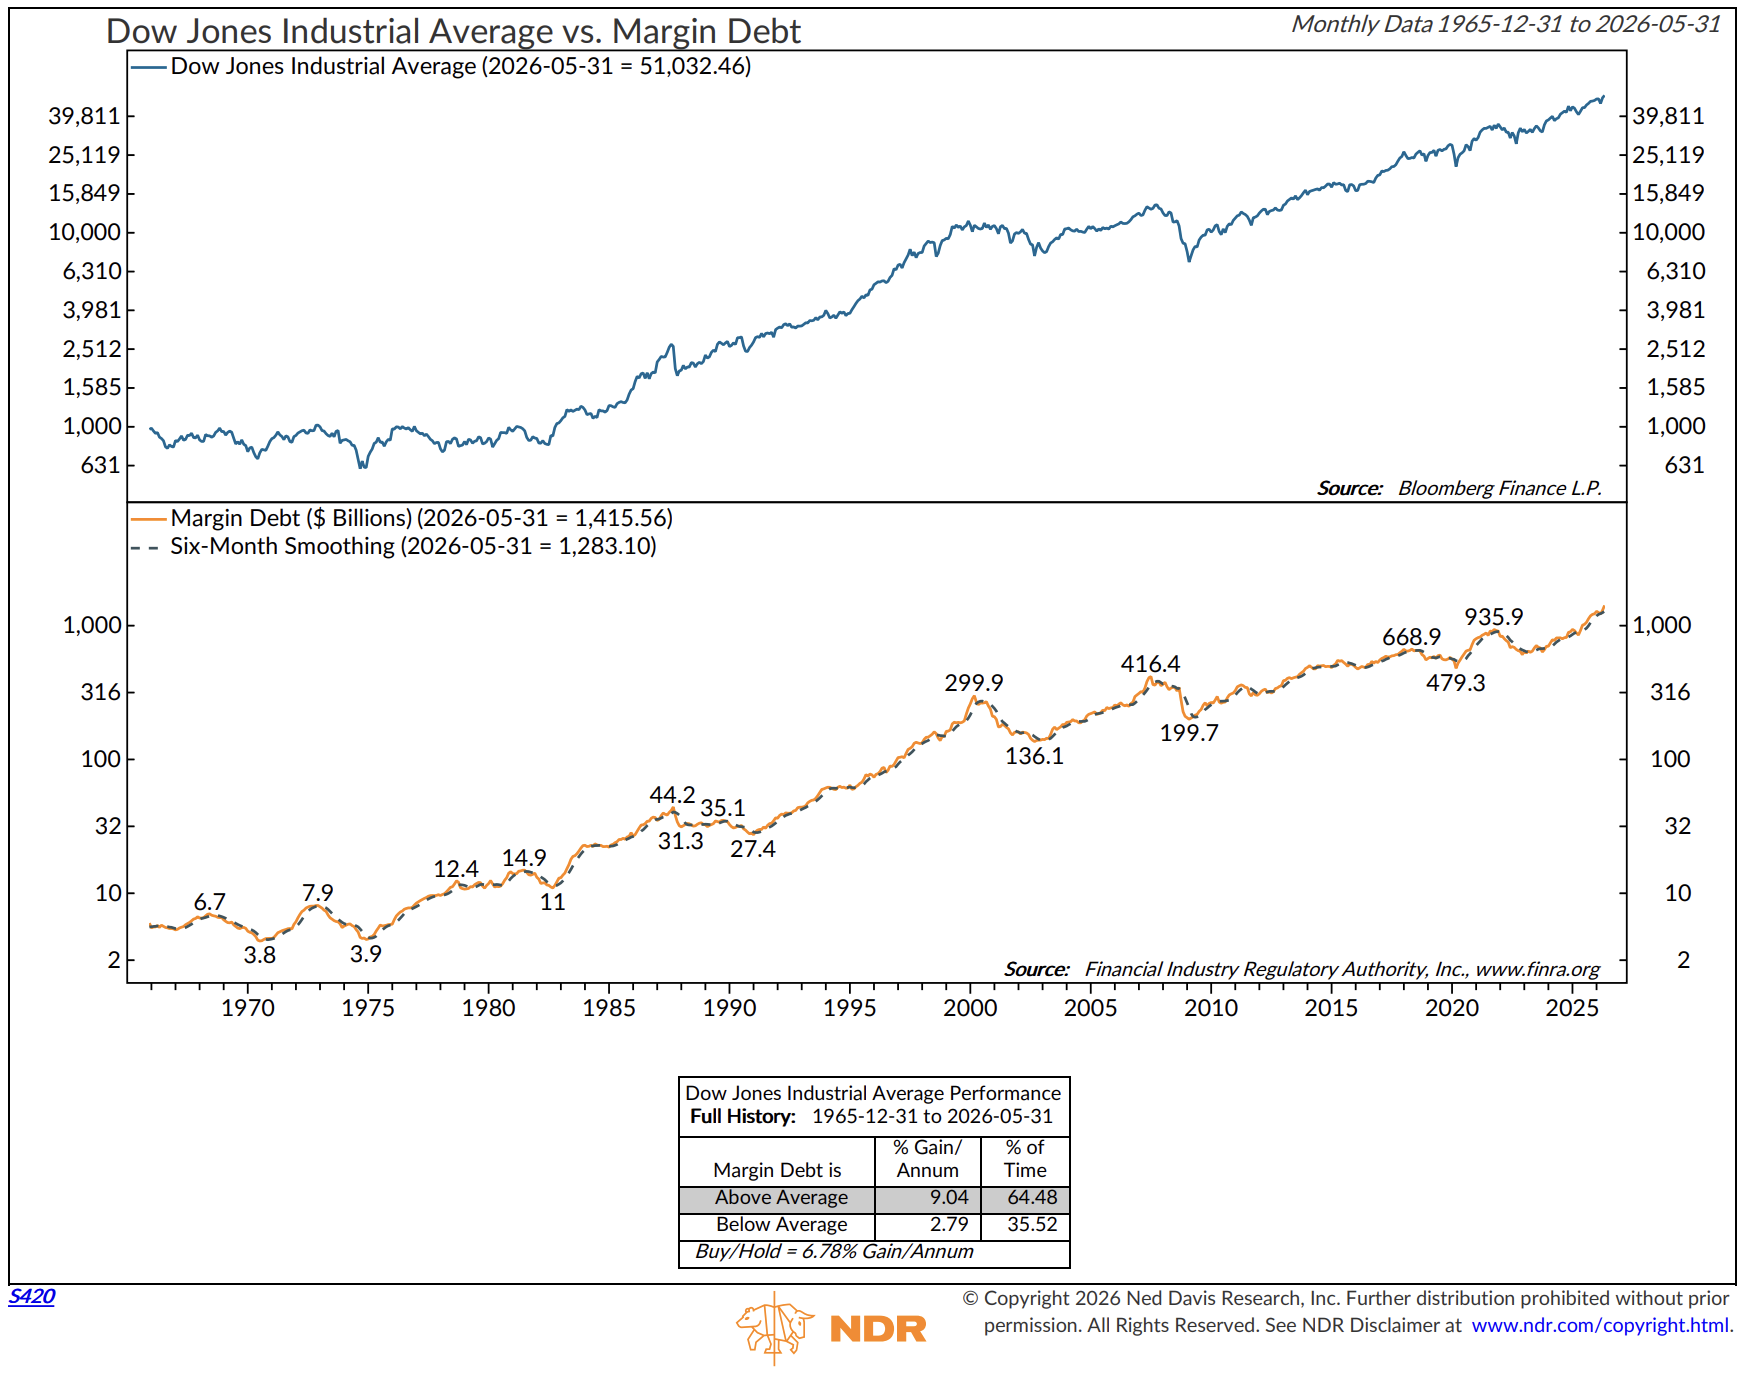
Margin debt rose for a second straight month in May, reaching a new record high of $1.42 trillion, up 8.5% in a single month and 53.7% versus a year ago. Read that again: investors have increased their borrowing against stocks by more than half in twelve months.
Since 1997, inflation-adjusted margin debt has grown by 550%, while the market has grown by 358%. Source: Advisor Perspectives
Relative to the economy, margin debt now stands at 4.45% of GDP, a record high against a historical median of 2.37%. We’ve seen similar periods of late-cycle market euphoria in 2000, 2007, and 2021.
The level of margin debt is not a timing tool; think of it as a fragility gauge. Leverage never causes the fire, but it does determine how fast and how far the fire might spread.
Leveraged ETFs
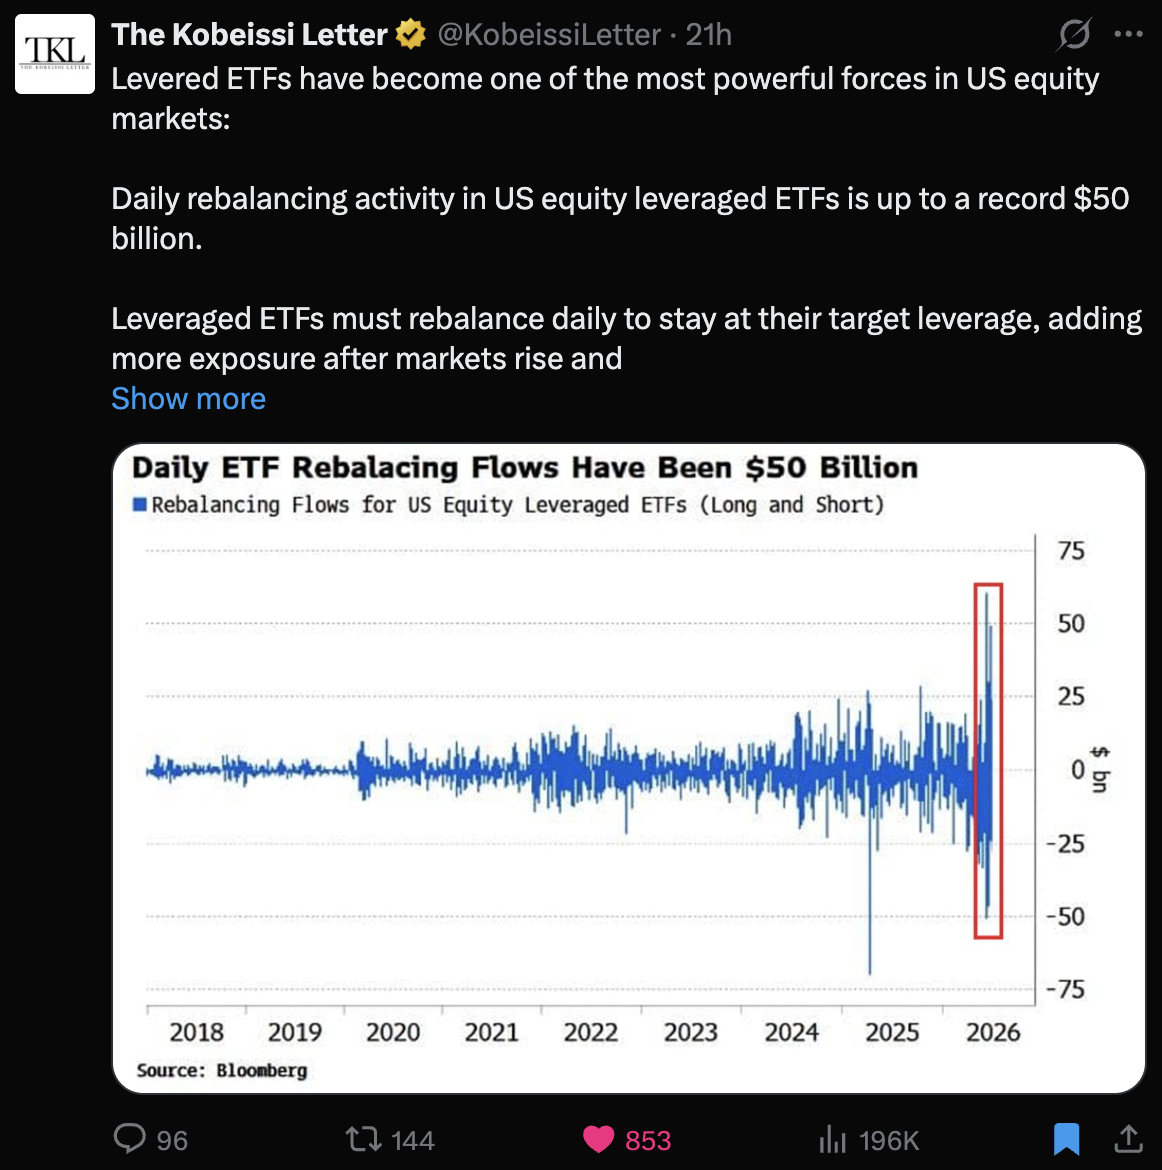
Sharing this next chart from X, as it is important to know.
Click on the chart to learn more:
Source: Bloomberg, @kobessiletter, X
Concluding Thoughts
Here is the picture at mid-year, as plainly as I can shape it.
The tide is high and still rising: money supply is at record levels, global liquidity is expanding, and a political system has every incentive to keep it that way.
Prices are high: the second-richest valuation in American history, and the boats are floating on borrowed money: record margin debt, growing at a rate we've seen only near major tops.
Pal is right that liquidity drives the level.
History shows that valuation drives returns.
Both can be true, and both convey the same message: enjoy the party and know where the door is.
Overvalued, overconcentrated, overowned, overleveraged, and now we can add: floating on the largest pool of money ever created.
You can share this letter on X by clicking here.
Opinions are subject to change. Not a recommendation to buy or sell any security. Please note that the information provided is not recommended for buying or selling any security and is provided for discussion purposes only.
Trade Signals: July 2, 2026 Update
Market Commentary
Subscribers - link below.
The Dashboard of Indicators follows next.
Trade Signals - subscribers only
The Indicators Dashboard - Stocks, Investor Sentiment, Bonds, Commodities, Currencies, and Gold
Valuations and Subsequent 10-year Returns
Supporting Charts with Explanations
About Trade Signals - Trade Signals is a paid subscription service that posts the daily, weekly, and monthly trends in the markets (and more). Free for CMG clients. Not a recommendation to buy or sell any security. For discussion purposes only.
“Extreme patience combined with extreme decisiveness. You may call that our investment process. Yes, it’s that simple.” – Charlie Munger

TRADE SIGNALS SUBSCRIPTION ACKNOWLEDGEMENT / IMPORTANT DISCLOSURES
The views expressed herein are solely those of Steve Blumenthal as of the date of this report and are subject to change without notice. Not a recommendation to buy or sell any security.
Please note that the information provided is not recommended for buying or selling any security and is provided for discussion purposes only. Current viewpoints are subject to change. Please note that the information provided is not recommended for buying or selling any security and is provided for discussion purposes only.
Personal Note: Happy 250th Birthday, America
As we head into the Fourth of July weekend, I thought I'd share the letter John Adams wrote to Abigail the day after the Continental Congress voted for independence on July 2, 1776:
"The Second Day of July 1776, will be the most memorable Epocha, in the History of America. I am apt to believe that it will be celebrated, by succeeding Generations, as the great anniversary Festival. It ought to be commemorated, as the Day of Deliverance by solemn Acts of Devotion to God Almighty. It ought to be solemnized with Pomp and Parade, with Shews, Games, Sports, Guns, Bells, Bonfires and Illuminations from one End of this Continent to the other from this Time forward forever more. You will think me transported with Enthusiasm but I am not. -- I am well aware of the Toil and Blood and Treasure, that it will cost Us to maintain this Declaration, and support and defend these States. -- Yet through all the Gloom I can see the Rays of ravishing Light and Glory. I can see that the End is more than worth all the Means. And that Posterity will tryumph in that Days Transaction, even altho We should rue it, which I trust in God We shall not."
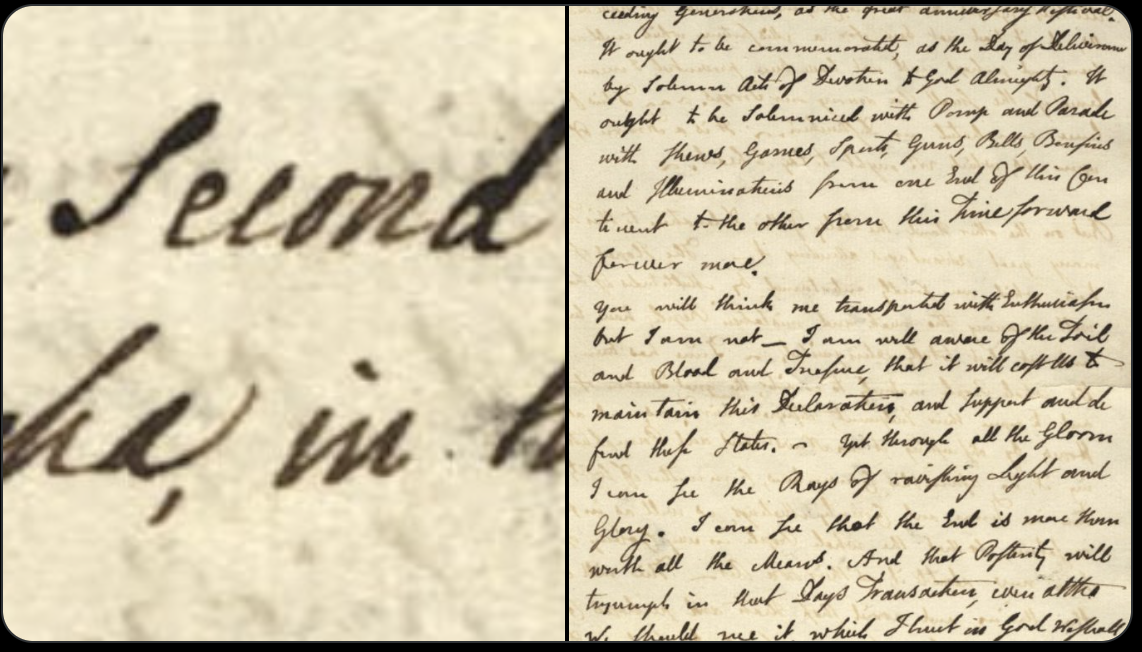
Two hundred fifty years later, here we are. Amazingly prescient.
Not without issues and flaws, Adams saw those coming, too. "Toil and Blood and Treasure," he warned. But it's the next line I keep coming back to, and my hope for us now: "Yet through all the Gloom I can see the Rays of ravishing Light and Glory. I can see that the End is more than worth all the Means."
Susan and I are heading to the France vs. Paraguay World Cup match tomorrow at Lincoln Financial Field (the Linc). Kickoff is at 5 pm ET. The plan: lunch in the city, then the subway from City Hall down Broad Street to the stadium. The world's game, in America's birthplace, on her 250th birthday. I'm not sure even John Adams, with all his enthusiasm, could have imagined the magnitude of this party - the pomp, the parade, the games, the fireworks from one end of the continent to the other.
"I am apt to believe that it will be celebrated, by succeeding Generations, as the great anniversary Festival."
And so it is. Ever forward.
Have a wonderful weekend. I hope you're catching World Cup fever - best of luck to your favorite team. Go USA!
With kind regards,
Steve
CLICK HERE TO SUBSCRIBE TO ON MY RADAR - IT’S FREE
You can share this letter on X by clicking here.
You can share this letter on LinkedIn by clicking here.
Subscribe to OMR for free by clicking the photo.
Stephen B. Blumenthal
Executive Chairman & CIO
CMG Capital Management Group, Inc.
75 Valley Stream Parkway, Suite 201,
Malvern, PA 19355
CMG Customer Relationship Summary (Form CRS)
Metric-Financial, LLC Customer Relationship Summary (Form CRS)

Stephen Blumenthal founded CMG Capital Management Group in 1992 and serves today as its Executive Chairman and CIO. Steve authors a free weekly e-letter entitled, “On My Radar.” Steve shares his views on macroeconomic research, valuations, portfolio construction, asset allocation and risk management. Author of Forbes Book: On My Radar, Navigating Stock Market Cycles.
Follow Steve on X @SBlumenthalCMG and LinkedIn.
IMPORTANT DISCLOSURE INFORMATION
This document is prepared by CMG Capital Management Group, Inc. (“CMG”) and is circulated for informational and educational purposes only. There is no consideration given to the specific investment needs, objectives, or tolerances of any of the recipients. Additionally, CMG’s actual investment positions may, and often will, vary from its conclusions discussed herein based on any number of factors, such as client investment restrictions, portfolio rebalancing, and transaction costs, among others. Recipients should consult their own advisors, including tax advisors, before making any investment decision. This material is for informational and educational purposes only and is not an offer to sell or the solicitation of an offer to buy the securities or other instruments mentioned. This material does not constitute a personal recommendation or take into account the particular investment objectives, financial situations, or needs of individual investors which are necessary considerations before making any investment decision. Investors should consider whether any advice or recommendation in this research is suitable for their particular circumstances and, where appropriate, seek professional advice, including legal, tax, accounting, investment, or other advice. The views expressed herein are solely those of Steve Blumenthal as of the date of this report and are subject to change without notice.
Investing involves risk.
This letter may contain forward-looking statements relating to the objectives, opportunities, and future performance of the various investment markets, indices, and investments. Forward-looking statements may be identified by the use of such words as; “believe,” anticipate,” “planned,” “potential,” and other similar terms. Examples of forward-looking statements include, but are not limited to, estimates with respect to financial condition, results of operations, and success or lack of success of any particular market, index, investment, or investment strategy. All are subject to various factors, including, but not limited to, general and local economic conditions, changing levels of competition within certain industries and markets, changes in legislation or regulation, Federal Reserve policy, and other economic, competitive, governmental, regulatory, and technological factors affecting markets, indices, investments, investment strategy and portfolio positioning that could cause actual results to differ materially from projected results. Such statements are forward-looking in nature and involve a number of known and unknown risks, uncertainties, and other factors, and accordingly, actual results may differ materially from those reflected or contemplated in such forward-looking statements. Investors are cautioned not to place undue reliance on any forward-looking statements or examples. All statements made herein speak only as of the date that they were made. Investing is inherently risky and all investing involves the potential risk of loss.
Past performance does not guarantee or indicate future results. Different types of investments involve varying degrees of risk, and there can be no assurance that the future performance of any specific investment, investment strategy, or product (including the investments and/or investment strategies recommended or undertaken by CMG), or any non-investment related content, made reference to directly or indirectly in this commentary will be profitable, equal any corresponding indicated historical performance level(s), be suitable for your portfolio or individual situation or prove successful. Due to various factors, including changing market conditions and/or applicable laws, the content may no longer be reflective of current opinions or positions. Moreover, you should not assume that any discussion or information contained in this commentary serves as the receipt of, or as a substitute for, personalized investment advice from CMG. Please remember to contact CMG, in writing, if there are any changes in your personal/financial situation or investment objectives for the purpose of reviewing/evaluating/revising our previous recommendations and/or services, or if you would like to impose, add, or to modify any reasonable restrictions to our investment advisory services. Unless, and until, you notify us, in writing, to the contrary, we shall continue to provide services as we do currently. CMG is neither a law firm, nor a certified public accounting firm, and no portion of the commentary content should be construed as legal or accounting advice.
No portion of the content should be construed as an offer or solicitation for the purchase or sale of any security. References to specific securities, investment programs or funds are for illustrative purposes only and are not intended to be, and should not be interpreted as recommendations to purchase or sell such securities.
This presentation does not discuss, directly or indirectly, the amount of the profits or losses realized or unrealized, by any CMG client from any specific funds or securities. Please note: In the event that CMG references performance results for an actual CMG portfolio, the results are reported net of advisory fees and inclusive of dividends. The performance referenced is that as determined and/or provided directly by the referenced funds and/or publishers, has not been independently verified, and does not reflect the performance of any specific CMG client. CMG clients may have experienced materially different performance based upon various factors during the corresponding time periods. See in links provided citing limitations of hypothetical back-tested information. Past performance cannot predict or guarantee future performance. Not a recommendation to buy or sell. Please talk to your advisor.
Information herein has been obtained from sources believed to be reliable, but we do not warrant its accuracy. This document is general communication and is provided for informational and/or educational purposes only. None of the content should be viewed as a suggestion that you take or refrain from taking any action nor as a recommendation for any specific investment product, strategy, or other such purposes.
In a rising interest rate environment, the value of fixed-income securities generally declines, and conversely, in a falling interest rate environment, the value of fixed-income securities generally increases. High-yield securities may be subject to heightened market, interest rate, or credit risk and should not be purchased solely because of the stated yield. Ratings are measured on a scale that ranges from AAA or Aaa (highest) to D or C (lowest). Investment-grade investments are those rated from highest down to BBB- or Baa3.
NOT FDIC INSURED. MAY LOSE VALUE. NO BANK GUARANTEE.
Certain information contained herein has been obtained from third-party sources believed to be reliable, but we cannot guarantee its accuracy or completeness.
In the event that there has been a change in an individual’s investment objective or financial situation, he/she is encouraged to consult with his/her investment professional.
Written Disclosure Statement. CMG is an SEC-registered investment adviser located in Malvern, Pennsylvania. Stephen B. Blumenthal is CMG’s founder and CEO. Please note: The above views are those of CMG and its CEO, Stephen Blumenthal, and do not reflect those of any sub-advisor that CMG may engage to manage any CMG strategy, or exclusively determines any internal strategy employed by CMG. A copy of CMG’s current written disclosure statement discussing advisory services and fees is available upon request or via CMG’s internet web site at www.cmgwealth.com/disclosures. CMG is committed to protecting your personal information. Click here to review CMG’s privacy policies.
See CMG Disclosures at the bottom of this page.
For more information about NDR, please visit at www.ndr.com.
NDR, Inc. (NDR), d.b.a. Ned Davis Research Group (NDRG), any NDRG affiliates or employees, or any third-party data provider, shall not have any liability for any loss sustained by anyone who has relied on the information contained in any NDRG publication. The data and analysis contained herein are provided "as is." NDRG disclaims any and all express or implied warranties, including, but not limited to, any warranties of merchantability, suitability or fitness for a particular purpose or use. NDRG's past recommendations and model results are not a guarantee of future results. This communication reflects our analysts' opinions as of the date of this communication and will not necessarily be updated as views or information change. All opinions expressed herein are subject to change without notice. NDRG or its affiliated companies or their respective shareholders, directors, officers and/or employees, may have long or short positions in the securities discussed herein and may purchase or sell such securities without notice. For NDRG's important additional disclaimers, refer to www.ndr.com/invest/public/copyright.html. Further distribution prohibited without prior permission. Copyright 2025 © NDR, Inc. All rights reserved.