On My Radar: Michael Burry Warning

March 13, 2026
By Steve Blumenthal
“There is a tension, like a coiled spring, in a market so unmoored from historic valuation measures.”
- Michael Burry, March 3, 2026
Nearly everyone watched the movie “The Big Short.”
It’s one of those rare films that made the complexities of Wall Street both entertaining and understandable. The character at the center of the story was the eccentric hedge fund manager Michael Burry, portrayed by Hollywood superstar Christian Bale.
In the film, Burry sits alone in a small office, reading through thousands of pages of mortgage documents while blasting heavy metal music through his headphones. While nearly everyone on Wall Street believed housing prices could only go up, Burry was quietly studying the plumbing of the financial system.
He is one of the most well-known investors to emerge from the 2008 financial crisis, largely because he identified the housing bubble years before most of Wall Street and structured a trade that yielded enormous profits when it collapsed.
Burry placed a massive bet against the housing market using credit default swaps. For months, his investors believed he had lost his mind. The trade bled money.
But when the housing market cracked in 2007 and 2008, Burry’s analysis proved correct. He and his clients made millions, and his story became immortalized in The Big Short.
What made the trade remarkable wasn’t simply that he was right - it was that he focused on structure rather than narrative.
That same mindset shows up again in a recent letter Burry released titled "Foundations: U.S. Market Structure & Value."
And as I read through it, I was struck by how much of his thinking overlaps with themes we’ve been discussing here in On My Radar for quite some time.
Grab that coffee and find your favorite chair.
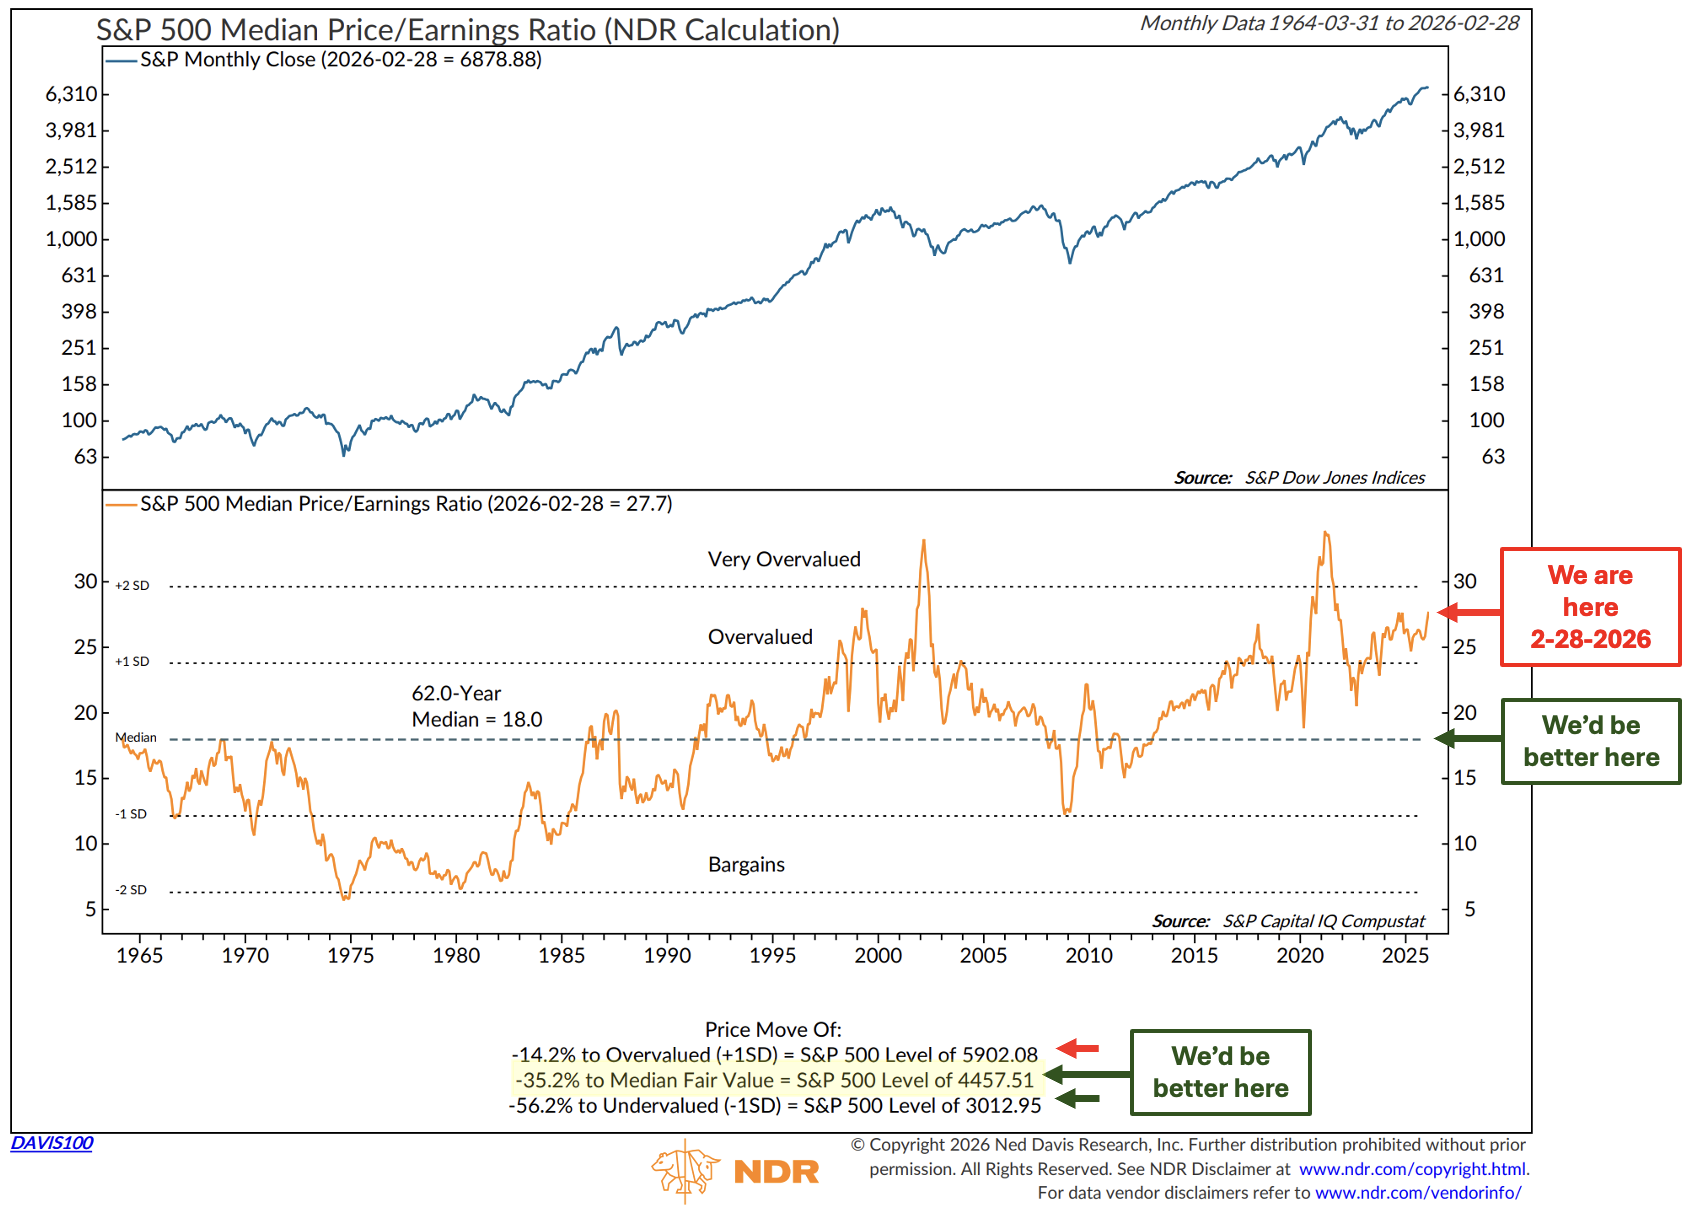
Let’s take a look. Note, I’m keeping the Median P/E chart shared with you last week to get a sense of “fair value” and “extremely overvalued” entry targets.
On My Radar:
Michael Burry - Foundations: U.S. Market Structure and Value
OMR is for informational and educational purposes only. No consideration is given to your specific investment needs, objectives, or tolerances.
Please see the Important Disclosures at the bottom of this page. Reminder: This is not a recommendation to buy or sell any security. My views may change at any time. The information is for discussion and educational purposes only.
If you like what you are reading, you can subscribe for free.

Michael Burry - Foundations: U.S. Market Structure and Value
Burry begins with something simple but powerful: valuation.
The Shiller CAPE ratio (also posted weekly in Trade Signals), one of the most widely followed long-term valuation measures, currently sits near 40 (actually 38.55 as of last night’s close), the second-highest level in history, surpassed only by the peak of the technology bubble in 2000. Source: Substack, ShillerPE
History teaches us something important about valuation cycles. They revert to the mean and, in many cases, overshoot to the downside before the next cycle begins.
Past secular bear markets have seen inflation-adjusted drawdowns in the range of:
roughly 65% during early-20th-century cycles
about 55% during the 1970s bear market
roughly 50% following the tech bubble
Markets can remain expensive for long stretches of time. But history suggests that valuation extremes eventually correct, sometimes slowly, sometimes suddenly. Source
What Really Drives Bear Markets
Many investors assume bear markets are caused primarily by falling earnings.
Burry argues that history suggests otherwise.
Stock prices are simply:
Price = Earnings × Valuation Multiple
His research shows that during major bear markets, multiple compressions, the decline in what investors are willing to pay for earnings, does much of the damage.
During the “lost decade” from 2000 to 2009, corporate earnings actually grew, yet stocks struggled because valuation multiples contracted dramatically.
In other words, when optimism fades, markets can fall even if companies remain profitable.
Passive Investing and Market Structure
One of Burry’s most important points involves how markets themselves have changed.
Over the past few decades, passive index investing has exploded.
Index funds now account for roughly 60% of equity fund assets, compared to just 6% in the mid-1990s. Source: Burry-Substack
Passive funds don’t evaluate individual companies. They simply buy the index whenever money flows in.
That means a growing share of market activity is driven by mechanical inflows rather than fundamental analysis.
And because most indices are market-cap weighted, the largest companies automatically receive the largest flows.
This helps explain the extraordinary concentration we’ve seen in recent years, where a small group of mega-cap companies has driven much of the market’s performance.
The Buyback Engine
Another powerful force supporting the market has been corporate share buybacks.
In 2000, S&P 500 companies repurchased about $140 billion of stock each year.
By 2022, that number exceeded $1 trillion annually.
But Burry notes that the buyback engine may now be slowing. Source
Large technology companies are increasingly directing capital toward massive AI infrastructure and data center investments, rather than repurchasing shares.
If that trend continues, one of the largest structural sources of demand for equities could weaken. Something I’m keeping an eye on is the potential for AI to accelerate growth at a pace we’ve never seen before.
Demographics: A Quiet but Powerful Shift
Burry also points to demographics. For decades, retirement accounts such as 401(k)s have created steady inflows into stock markets.
But the baby boom generation that fueled those inflows is now entering retirement.
Required minimum distributions will gradually force investors to withdraw assets rather than add to them.
Burry estimates that by 2028, withdrawals from retirement accounts could exceed contributions for the first time. If that occurs, one of the market’s most reliable buyers could slowly become a seller.
A Market That May Be More Fragile Than It Appears
Finally, Burry argues that the structure of markets may amplify volatility.
Today’s trading environment is dominated by:
passive index flows
high-frequency trading
quantitative hedge fund strategies
These systems can provide liquidity during calm markets but may withdraw rapidly during periods of stress.
Recent episodes of market turmoil suggest correlations across assets may also be increasing, raising the risk of broader contagion during future shocks.
Burry describes the current market as something like a coiled spring, with tensions building beneath the surface.
What struck me most reading Burry’s work was how closely it overlaps with many themes we’ve discussed in On My Radar:
historically elevated valuations
extraordinary monetary and fiscal stimulus
structural flows into passive investment vehicles
increasing concentration in mega-cap stocks
and a world filled with geopolitical uncertainty.
Burry approaches the problem primarily from a market structure perspective.
My work often focuses more on macro cycles, debt dynamics, and global political shifts.
But the conclusion is remarkably similar.
The modern market has been supported by a powerful combination of liquidity, demographics, and policy.
And those forces may not last forever. Or we get money printing forever and deal with unending waves of inflation.
I favor looking at what price is actually telling us. Does the trend direction match the fundamental view. A side note: The S&P 500 Index Daily and Weekly MACDs are signaling a down trend. The Money MACD is nearing a sell signal as well. Something I’m keeping my eyes on.
A Few Final Thoughts
None of this guarantees an imminent bear market. Markets can remain expensive far longer than most people expect. But history reminds us that valuation cycles eventually turn.
When they do, the adjustment often comes not from collapsing earnings but from investors simply deciding they are no longer willing to pay extreme prices for those earnings.
Sometimes those shifts happen slowly. Sometimes they happen all at once.
Michael Burry built his reputation by studying the structure beneath the story.
His latest warning suggests that today’s market structure may be more fragile than many investors realize.
Time will tell whether this call proves as prescient as his last.
You can find his full post on Substack here.
Views are subject to change. Not a recommendation to buy or sell any security. Please note that the information provided is not recommended for buying or selling any security and is provided for discussion purposes only. Current viewpoints are subject to change. Please note that the information provided is not recommended for buying or selling any security and is provided for discussion purposes only. See important CMG disclosures below.
Median P/E and Median Fair Value
One of the most interesting parts of the conversation was Dalio’s reminder that macro forces ultimately shape market valuations.
Which brings me to a chart I’ve been watching closely - Median P/E.
Unlike the traditional market P/E, which can be heavily influenced by a handful of mega-cap stocks, the Median P/E measures the valuation of the “typical” company in the index.
In other words, it tells us what the average stock in the market is actually trading at.
My view remains unchanged: any correction near 4,500 on the S&P 500, for index-only investors, presents a better investment opportunity. The Median Fair Value estimate as of February 28, 2026, is 4,457.51.
The following chart updates monthly. It looks at 62-years of month-end “median P/E” data.
The median P/E is the middle price-to-earnings ratio of a group of stocks.
If you line up all the companies in an index from the lowest P/E to the highest P/E, the median P/E is the one in the middle of the list. Half the companies have a lower P/E and half have a higher P/E.
Why I like it:
It reduces distortion from extreme outliers (very expensive stocks).
It gives a better picture of the “typical” company valuation in the market.
Why this matters today:
When a few mega-cap stocks have extremely high valuations, the average market P/E can look expensive, while the median P/E may show the broader market is cheaper.
Follow the orange line in the center of the chart. NDR plots valuation zones that range from Very Overvalued to Bargains. We currently sit in the upper end of the “Overvalued” zone.
Simply follow the red and green arrows and my notations.
Source: NDR, cmgprivatewealth.com
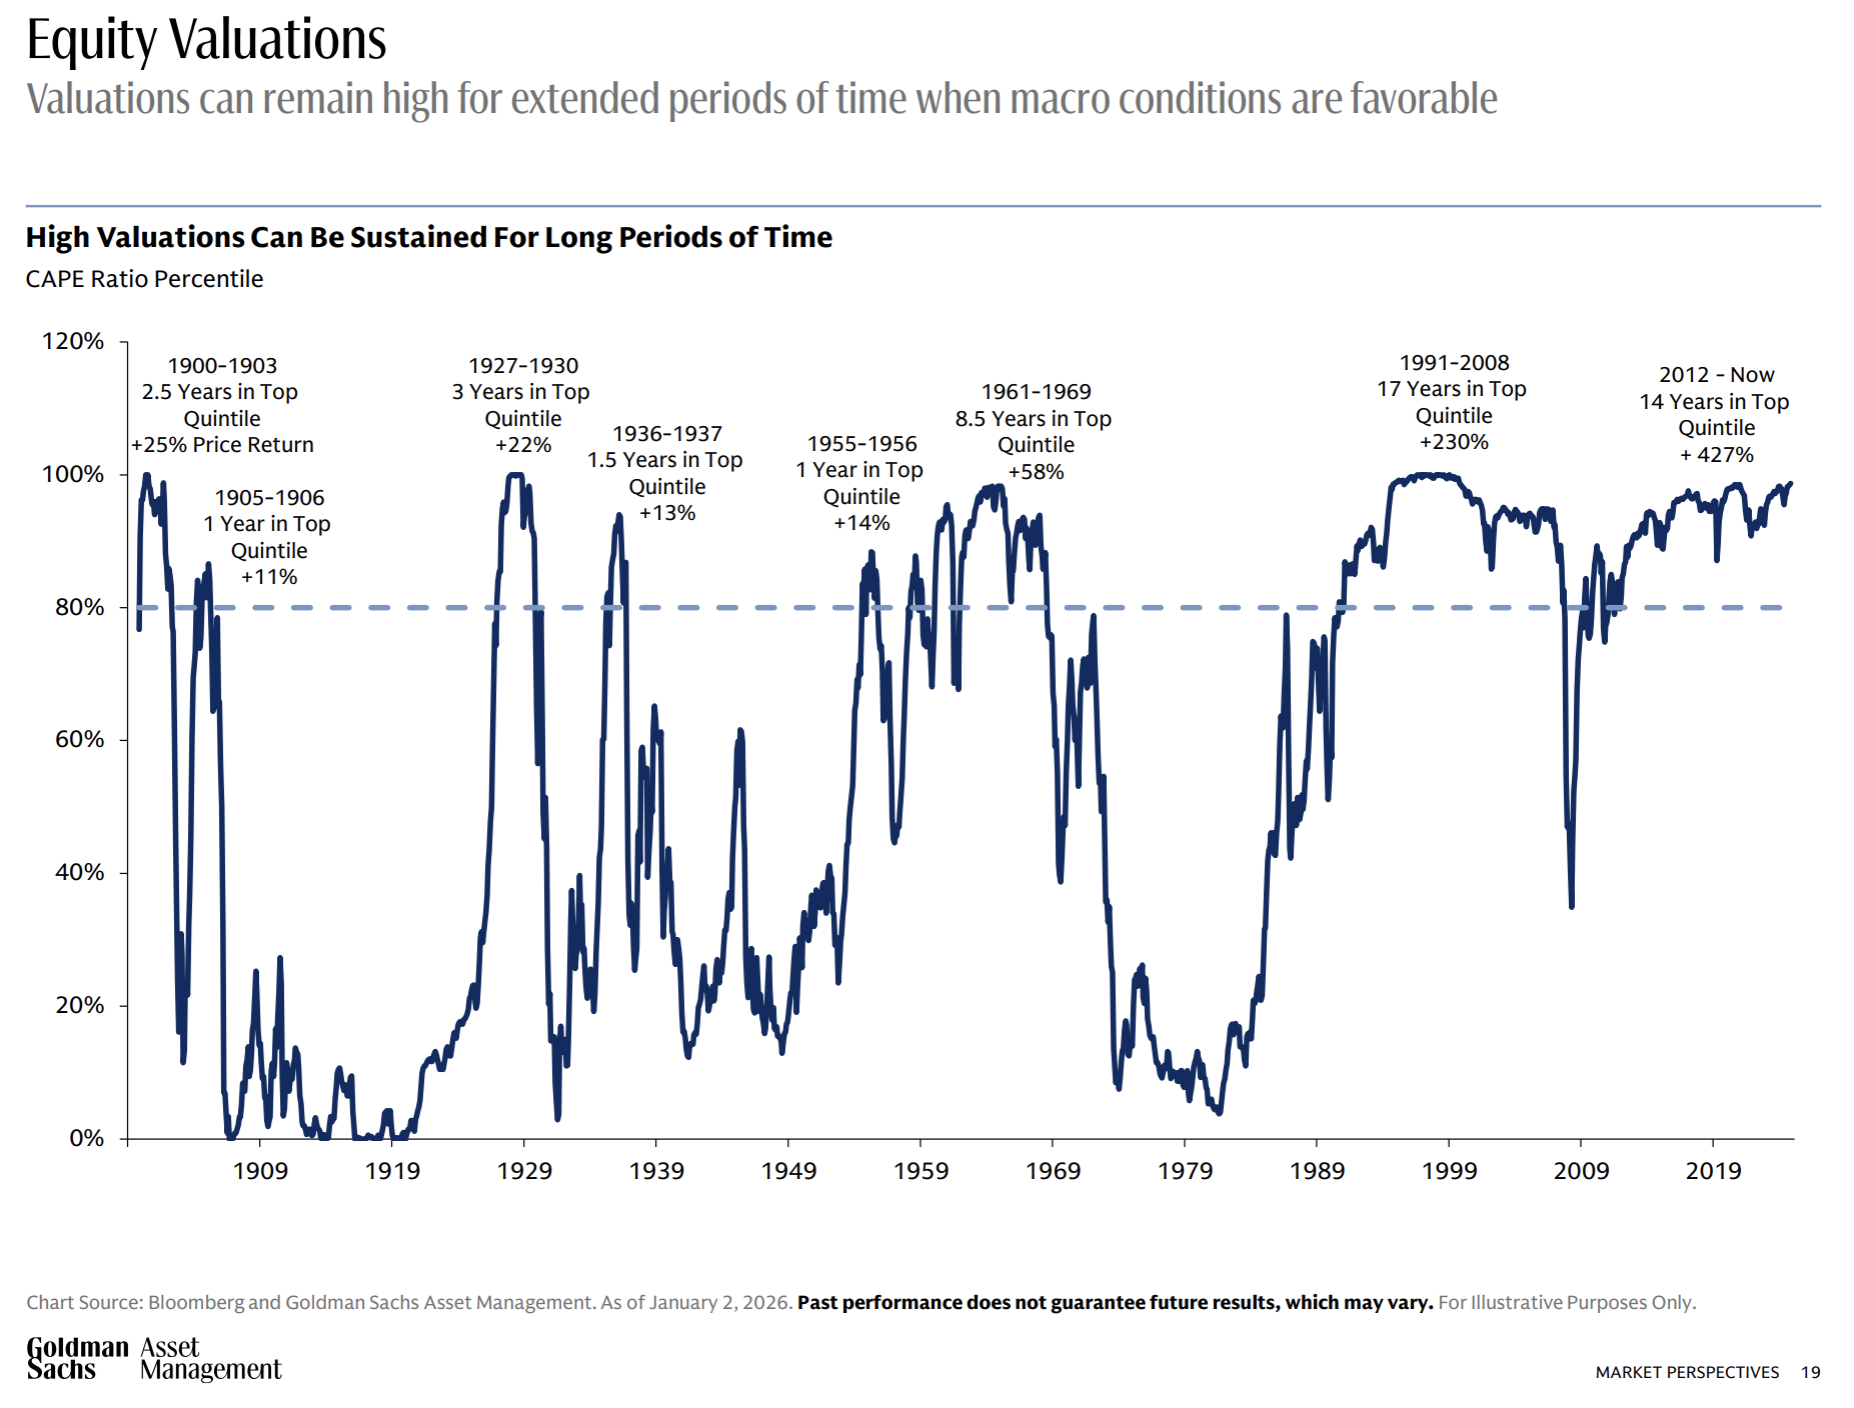
Last week, I shared with you the Goldman Sachs presentation deck from the WallachBeth Park City investment conference. It includes a chart showing that valuations can remain high for extended periods, especially when macro conditions are favorable. Take a look at the market's performance when valuations (as measured by the CAPE Ratio, similar to the Shiller PE I post in Trade Signals each week) are in the overvalued zone (above 80%).
Bottom line: It is not a time to be excited about future S&P 500 Index returns. Look back again at the Median P/E chart. I believe 4,500 is a number we should keep our eye on.
To get there, expect a lot of fear in the streets. A John Templeton, “buy when everyone else is selling moment.” Other areas are performing well. Energy, commodities, and gold in particular. Areas my firm remains bullish on.
You can find John Tousley’s presentation deck here. Worth your review.
Follow me on X @SBlumenthalCMG
The views are Steve Blumenthal’s and subject to change. Not a recommendation to buy or sell any security. Please note that the information provided is not recommended for buying or selling any security and is provided for discussion purposes only. Current viewpoints are subject to change. Please note that the information provided is not recommended for buying or selling any security and is provided for discussion purposes only. See important CMG disclosures below.
If you like what you are reading, click on the following link.
CLICK HERE TO SUBSCRIBE TO ON MY RADAR - IT’S FREE
Not a recommendation to buy or sell any security. Please note that the information provided is not recommended for buying or selling any security and is provided for discussion purposes only. Current viewpoints are subject to change. Please note that the information provided is not recommended for buying or selling any security and is provided for discussion purposes only.
Trade Signals: March 13, 2026 Update
Trade Signals Sections:
Market Commentary
The Indicators Dashboard - Stocks, Investor Sentiment, Bonds, Commodities, Currencies, and Gold
Valuations and Subsequent 10-year Returns
Supporting Charts with Explanations
Why Trend Following Matters
Not a recommendation for you to buy or sell any security. For information purposes only. Outlook and viewpoints are subject to change at a moment's notice. This material is for discussion purposes and does not give you specific advice. Please discuss needs, goals, time horizons, and risk tolerances with your advisor. Important disclosures.Not a recommendation for you to buy or sell any security. For information purposes only. Outlook and viewpoints are subject to change at a moment's notice. This material is for discussion purposes and does not give you specific advice. Please discuss needs, goals, time horizons, and risk tolerances with your advisor.
About Trade Signals - Trade Signals is a paid subscription service that posts the daily, weekly, and monthly trends in the markets (and more). Free for CMG clients. Not a recommendation to buy or sell any security. For discussion purposes only.
“Extreme patience combined with extreme decisiveness. You may call that our investment process. Yes, it’s that simple.” – Charlie Munger

TRADE SIGNALS SUBSCRIPTION ACKNOWLEDGEMENT / IMPORTANT DISCLOSURES
The views expressed herein are solely those of Steve Blumenthal as of the date of this report and are subject to change without notice. Not a recommendation to buy or sell any security.
Please note that the information provided is not recommended for buying or selling any security and is provided for discussion purposes only. Current viewpoints are subject to change. Please note that the information provided is not recommended for buying or selling any security and is provided for discussion purposes only.
Personal Note: War and Oil
Markets are already beginning to reflect the economic impact. Oil prices have moved sharply higher, and while most people think first about the price at the gas pump, energy touches nearly everything in the economy. Transportation, manufacturing, food production - higher oil prices work their way through the system in ways that eventually show up across the entire cost structure.
I’ve been constructive on oil for some time, but certainly not for this reason.
Moments like these remind us that markets do not operate in a vacuum. Economics, geopolitics, and human nature are always intertwined. As historians William Strauss and Neil Howe observed in The Fourth Turning, periods of instability and realignment arrive from time to time. They test institutions, markets, and people alike.
For now, let’s stay thoughtful, disciplined, and keep our heads on a swivel.
With gratitude for your time and trust.
Warm regards,
Steve
CLICK HERE TO SUBSCRIBE TO ON MY RADAR - IT’S FREE
You can share this letter on X by clicking here.
You can share this letter on LinkedIn by clicking here.
Subscribe to OMR for free by clicking the photo.
Stephen B. Blumenthal
Executive Chairman & CIO
CMG Capital Management Group, Inc.
75 Valley Stream Parkway, Suite 201,
Malvern, PA 19355
CMG Customer Relationship Summary (Form CRS)
Metric-Financial, LLC Customer Relationship Summary (Form CRS)

Stephen Blumenthal founded CMG Capital Management Group in 1992 and serves today as its Executive Chairman and CIO. Steve authors a free weekly e-letter entitled, “On My Radar.” Steve shares his views on macroeconomic research, valuations, portfolio construction, asset allocation and risk management. Author of Forbes Book: On My Radar, Navigating Stock Market Cycles.
Follow Steve on X @SBlumenthalCMG and LinkedIn.
IMPORTANT DISCLOSURE INFORMATION
This document is prepared by CMG Capital Management Group, Inc. (“CMG”) and is circulated for informational and educational purposes only. There is no consideration given to the specific investment needs, objectives, or tolerances of any of the recipients. Additionally, CMG’s actual investment positions may, and often will, vary from its conclusions discussed herein based on any number of factors, such as client investment restrictions, portfolio rebalancing, and transaction costs, among others. Recipients should consult their own advisors, including tax advisors, before making any investment decision. This material is for informational and educational purposes only and is not an offer to sell or the solicitation of an offer to buy the securities or other instruments mentioned. This material does not constitute a personal recommendation or take into account the particular investment objectives, financial situations, or needs of individual investors which are necessary considerations before making any investment decision. Investors should consider whether any advice or recommendation in this research is suitable for their particular circumstances and, where appropriate, seek professional advice, including legal, tax, accounting, investment, or other advice. The views expressed herein are solely those of Steve Blumenthal as of the date of this report and are subject to change without notice.
Investing involves risk.
This letter may contain forward-looking statements relating to the objectives, opportunities, and future performance of the various investment markets, indices, and investments. Forward-looking statements may be identified by the use of such words as; “believe,” anticipate,” “planned,” “potential,” and other similar terms. Examples of forward-looking statements include, but are not limited to, estimates with respect to financial condition, results of operations, and success or lack of success of any particular market, index, investment, or investment strategy. All are subject to various factors, including, but not limited to, general and local economic conditions, changing levels of competition within certain industries and markets, changes in legislation or regulation, Federal Reserve policy, and other economic, competitive, governmental, regulatory, and technological factors affecting markets, indices, investments, investment strategy and portfolio positioning that could cause actual results to differ materially from projected results. Such statements are forward-looking in nature and involve a number of known and unknown risks, uncertainties, and other factors, and accordingly, actual results may differ materially from those reflected or contemplated in such forward-looking statements. Investors are cautioned not to place undue reliance on any forward-looking statements or examples. All statements made herein speak only as of the date that they were made. Investing is inherently risky and all investing involves the potential risk of loss.
Past performance does not guarantee or indicate future results. Different types of investments involve varying degrees of risk, and there can be no assurance that the future performance of any specific investment, investment strategy, or product (including the investments and/or investment strategies recommended or undertaken by CMG), or any non-investment related content, made reference to directly or indirectly in this commentary will be profitable, equal any corresponding indicated historical performance level(s), be suitable for your portfolio or individual situation or prove successful. Due to various factors, including changing market conditions and/or applicable laws, the content may no longer be reflective of current opinions or positions. Moreover, you should not assume that any discussion or information contained in this commentary serves as the receipt of, or as a substitute for, personalized investment advice from CMG. Please remember to contact CMG, in writing, if there are any changes in your personal/financial situation or investment objectives for the purpose of reviewing/evaluating/revising our previous recommendations and/or services, or if you would like to impose, add, or to modify any reasonable restrictions to our investment advisory services. Unless, and until, you notify us, in writing, to the contrary, we shall continue to provide services as we do currently. CMG is neither a law firm, nor a certified public accounting firm, and no portion of the commentary content should be construed as legal or accounting advice.
No portion of the content should be construed as an offer or solicitation for the purchase or sale of any security. References to specific securities, investment programs or funds are for illustrative purposes only and are not intended to be, and should not be interpreted as recommendations to purchase or sell such securities.
This presentation does not discuss, directly or indirectly, the amount of the profits or losses realized or unrealized, by any CMG client from any specific funds or securities. Please note: In the event that CMG references performance results for an actual CMG portfolio, the results are reported net of advisory fees and inclusive of dividends. The performance referenced is that as determined and/or provided directly by the referenced funds and/or publishers, has not been independently verified, and does not reflect the performance of any specific CMG client. CMG clients may have experienced materially different performance based upon various factors during the corresponding time periods. See in links provided citing limitations of hypothetical back-tested information. Past performance cannot predict or guarantee future performance. Not a recommendation to buy or sell. Please talk to your advisor.
Information herein has been obtained from sources believed to be reliable, but we do not warrant its accuracy. This document is general communication and is provided for informational and/or educational purposes only. None of the content should be viewed as a suggestion that you take or refrain from taking any action nor as a recommendation for any specific investment product, strategy, or other such purposes.
In a rising interest rate environment, the value of fixed-income securities generally declines, and conversely, in a falling interest rate environment, the value of fixed-income securities generally increases. High-yield securities may be subject to heightened market, interest rate, or credit risk and should not be purchased solely because of the stated yield. Ratings are measured on a scale that ranges from AAA or Aaa (highest) to D or C (lowest). Investment-grade investments are those rated from highest down to BBB- or Baa3.
NOT FDIC INSURED. MAY LOSE VALUE. NO BANK GUARANTEE.
Certain information contained herein has been obtained from third-party sources believed to be reliable, but we cannot guarantee its accuracy or completeness.
In the event that there has been a change in an individual’s investment objective or financial situation, he/she is encouraged to consult with his/her investment professional.
Written Disclosure Statement. CMG is an SEC-registered investment adviser located in Malvern, Pennsylvania. Stephen B. Blumenthal is CMG’s founder and CEO. Please note: The above views are those of CMG and its CEO, Stephen Blumenthal, and do not reflect those of any sub-advisor that CMG may engage to manage any CMG strategy, or exclusively determines any internal strategy employed by CMG. A copy of CMG’s current written disclosure statement discussing advisory services and fees is available upon request or via CMG’s internet web site at www.cmgwealth.com/disclosures. CMG is committed to protecting your personal information. Click here to review CMG’s privacy policies.
See CMG Disclosures at the bottom of this page.
For more information about NDR, please visit at www.ndr.com.
NDR, Inc. (NDR), d.b.a. Ned Davis Research Group (NDRG), any NDRG affiliates or employees, or any third-party data provider, shall not have any liability for any loss sustained by anyone who has relied on the information contained in any NDRG publication. The data and analysis contained herein are provided "as is." NDRG disclaims any and all express or implied warranties, including, but not limited to, any warranties of merchantability, suitability or fitness for a particular purpose or use. NDRG's past recommendations and model results are not a guarantee of future results. This communication reflects our analysts' opinions as of the date of this communication and will not necessarily be updated as views or information change. All opinions expressed herein are subject to change without notice. NDRG or its affiliated companies or their respective shareholders, directors, officers and/or employees, may have long or short positions in the securities discussed herein and may purchase or sell such securities without notice. For NDRG's important additional disclaimers, refer to www.ndr.com/invest/public/copyright.html. Further distribution prohibited without prior permission. Copyright 2025 © NDR, Inc. All rights reserved.