On My Radar: The Invisible Energy Tax

May 1, 2026
By Steve Blumenthal
“It’s an energy tax. It effects everything. We just don’t see it yet.”
— Dan Gard
What you’re hearing from Dan aligns with a growing pattern across the agricultural supply chain: tight inputs, rising costs, and unreliable logistics. On the farm, the impact is immediate and real. Input costs, fuel, fertilizer, chemicals, and equipment are sharply higher, while planning has become more uncertain.
Farmers are being forced to adjust on the fly: paying up for last-minute nitrogen, scaling back applications, or reconsidering planting decisions altogether. Reports of softer seed demand and cautious ordering behavior suggest margin pressure is already working its way upstream.
The bigger picture is this is an energy-driven cost shock moving through the system. It raises production costs without boosting yields, a classic squeeze that ultimately pressures farm profitability and, unless absorbed somewhere in the chain, feeds through to higher food prices and tighter corporate margins.
High fuel prices equal higher transportation costs. Businesses either take the hit to their profit margins or pass the costs through, resulting in higher prices for their customers, who then decide whether to raise the prices of the goods they sell to you and me.
Energy is the master resource: the input to create any output. Right now, the blockade of the Strait of Hormuz is acting as an ‘invisible energy tax.’ While you see it at the pump today, it is quietly working through the plumbing of the global economy. It will soon become visible at the grocery store, the pharmacy, everywhere.
I wrote last week, “I Hear The Traing A-Coming.” That train is carrying inflation.
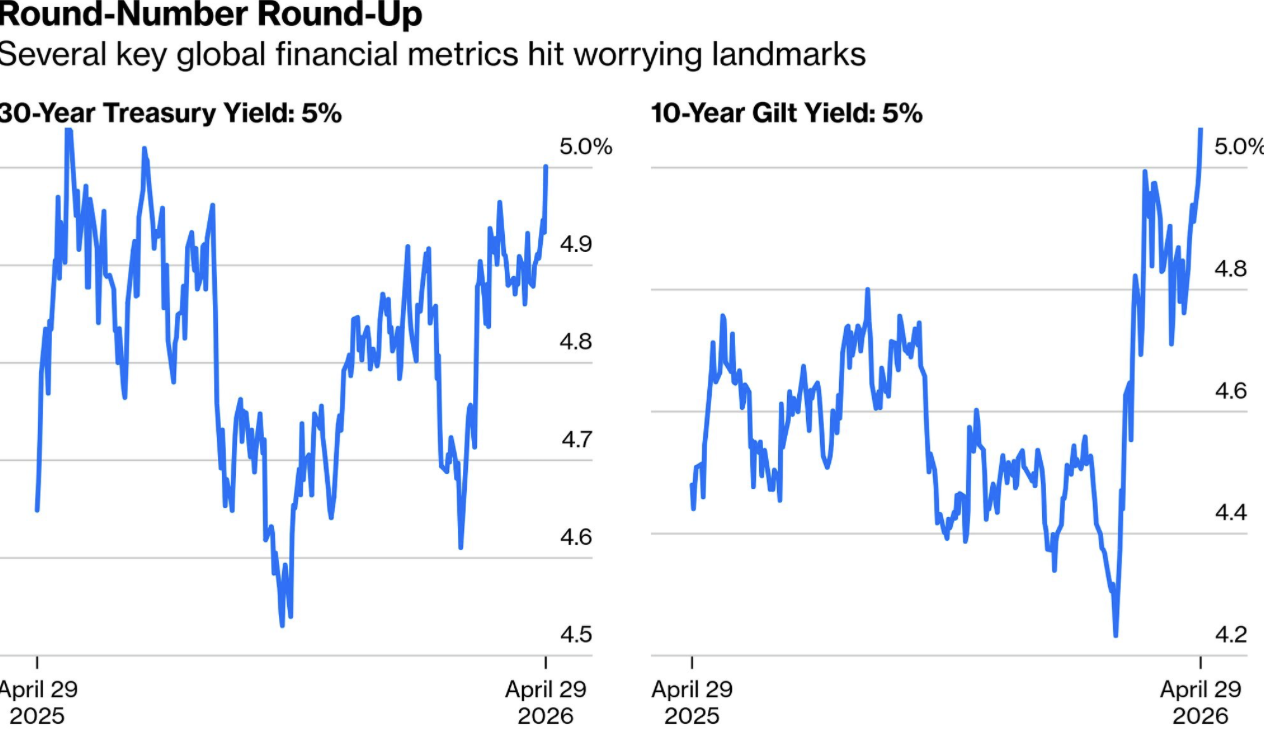
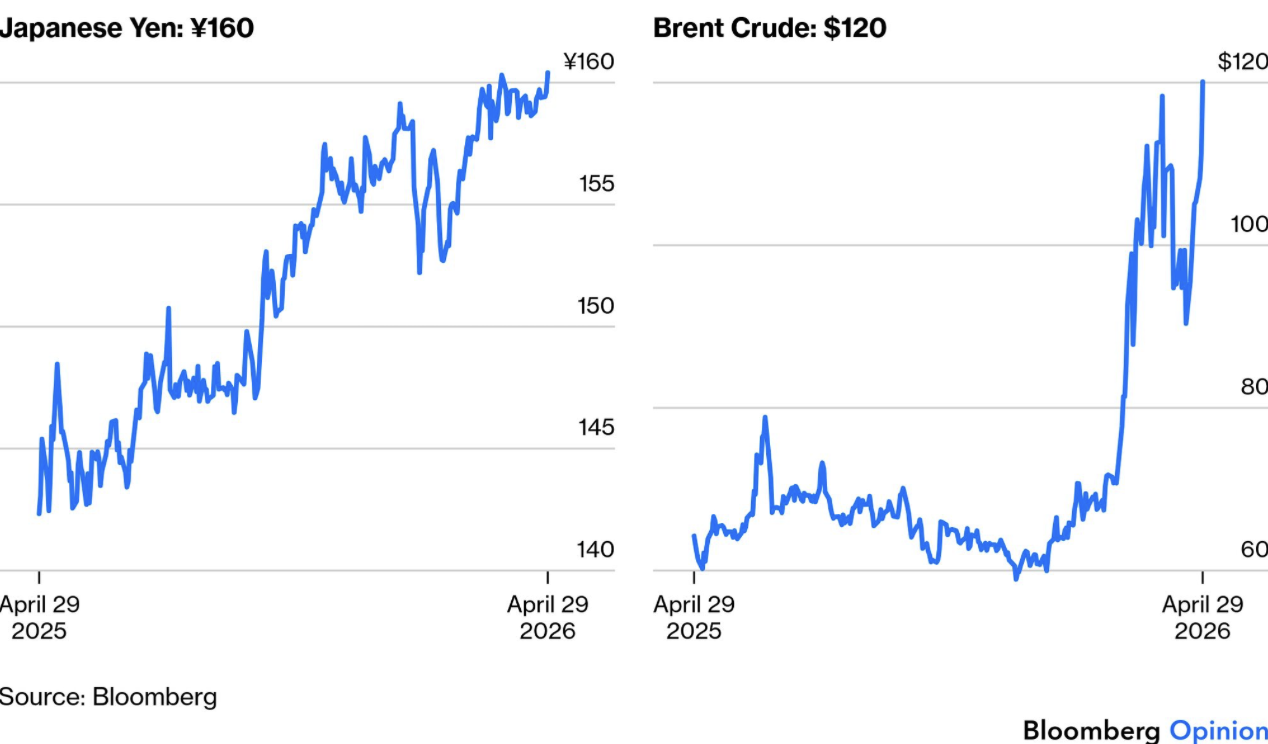
The Strait of Hormuz remains closed, and there’s no real progress toward reopening it. At this point, the idea of a quick resolution is fading fast. Oil moved sharply higher this week as Brent crude pushed above $120 per barrel, the highest level we’ve seen during this conflict, with added pressure from the UAE stepping away from OPEC+ constraints.
While the stock market is making record highs, bond markets are flashing warning signs. Yields are rising sharply across the globe. U.K. 10-year gilts moved above the 5% level. We haven’t seen it that high since the Global Financial Crisis. The U.S. 30-year Treasury is knocking on that same 5% door. Different markets. Similar message.
Inflation pressures are building. While bond investors are getting nervous, equity investors are ignoring a more prolonged and damaging economic outcome.
We may be reaching an important turning point where markets stop treating this as a contained geopolitical event and start recognizing it for what it is: inflation is a meaningful threat to global growth.
The important indicators to watch are if the 10-year Treasury yield (a breach 4.5%) and the 30-year Treasury yield (above 5%). This is due to the massive amount of government debt (and deficits). Also, keep a close eye on the dollar (declining) and the Japanese Yen (rising).
Quick add: The Yen surged by over 2% in a short period yesterday. It is widely believed that the Bank of Japan intervened aggressively to defend the yen, buying yen and selling dollars after the currency weakened toward key levels.
Japan needs a stronger yen because it imports the vast majority of its energy (oil). Since oil is priced in dollars, a declining Yen means Japan needs more Yen to buy a barrel of oil. Oil above $100 per barrel worsens inflation in Japan. Combined, this is painfully inflationary for the Japanese people. A stronger yen risks the unwinding of the leveraged yen carry trade (explained below).
Grab that coffee and find your favorite chair. Today, we take a quick look at global yields, why the direction of the Yen matters, and you’ll find a few interesting valuation charts.
On My Radar:
30-Year Treasury, 10-Year Gilt, Japanese Yen, and Brent Crude
Personal Note: Paul Tudor Jones - Joel Greenblatt
OMR is for informational and educational purposes only. No consideration is given to your specific investment needs, objectives, or tolerances.
Please see the Important Disclosures at the bottom of this page. Reminder: This is not a recommendation to buy or sell any security. My views may change at any time. The information is for discussion and educational purposes only.
If you like what you are reading, you can subscribe for free.

30-Year Treasury, 10-Year Gilt, Japanese Yen and Brent Crude
Following is a look at the yield charts I referenced above:
Next is a look at the 10-year Treasury Yield. Note that the current directional trend, as measured by MACD, is higher. 4.50% is an important ceiling. Above that level, we will likely see the Treasury and the President become aggressive. A break above 5% will be a clear sign that the bond vigilantes are revolting (selling bonds due to inflation and a loss of trust in government debt).
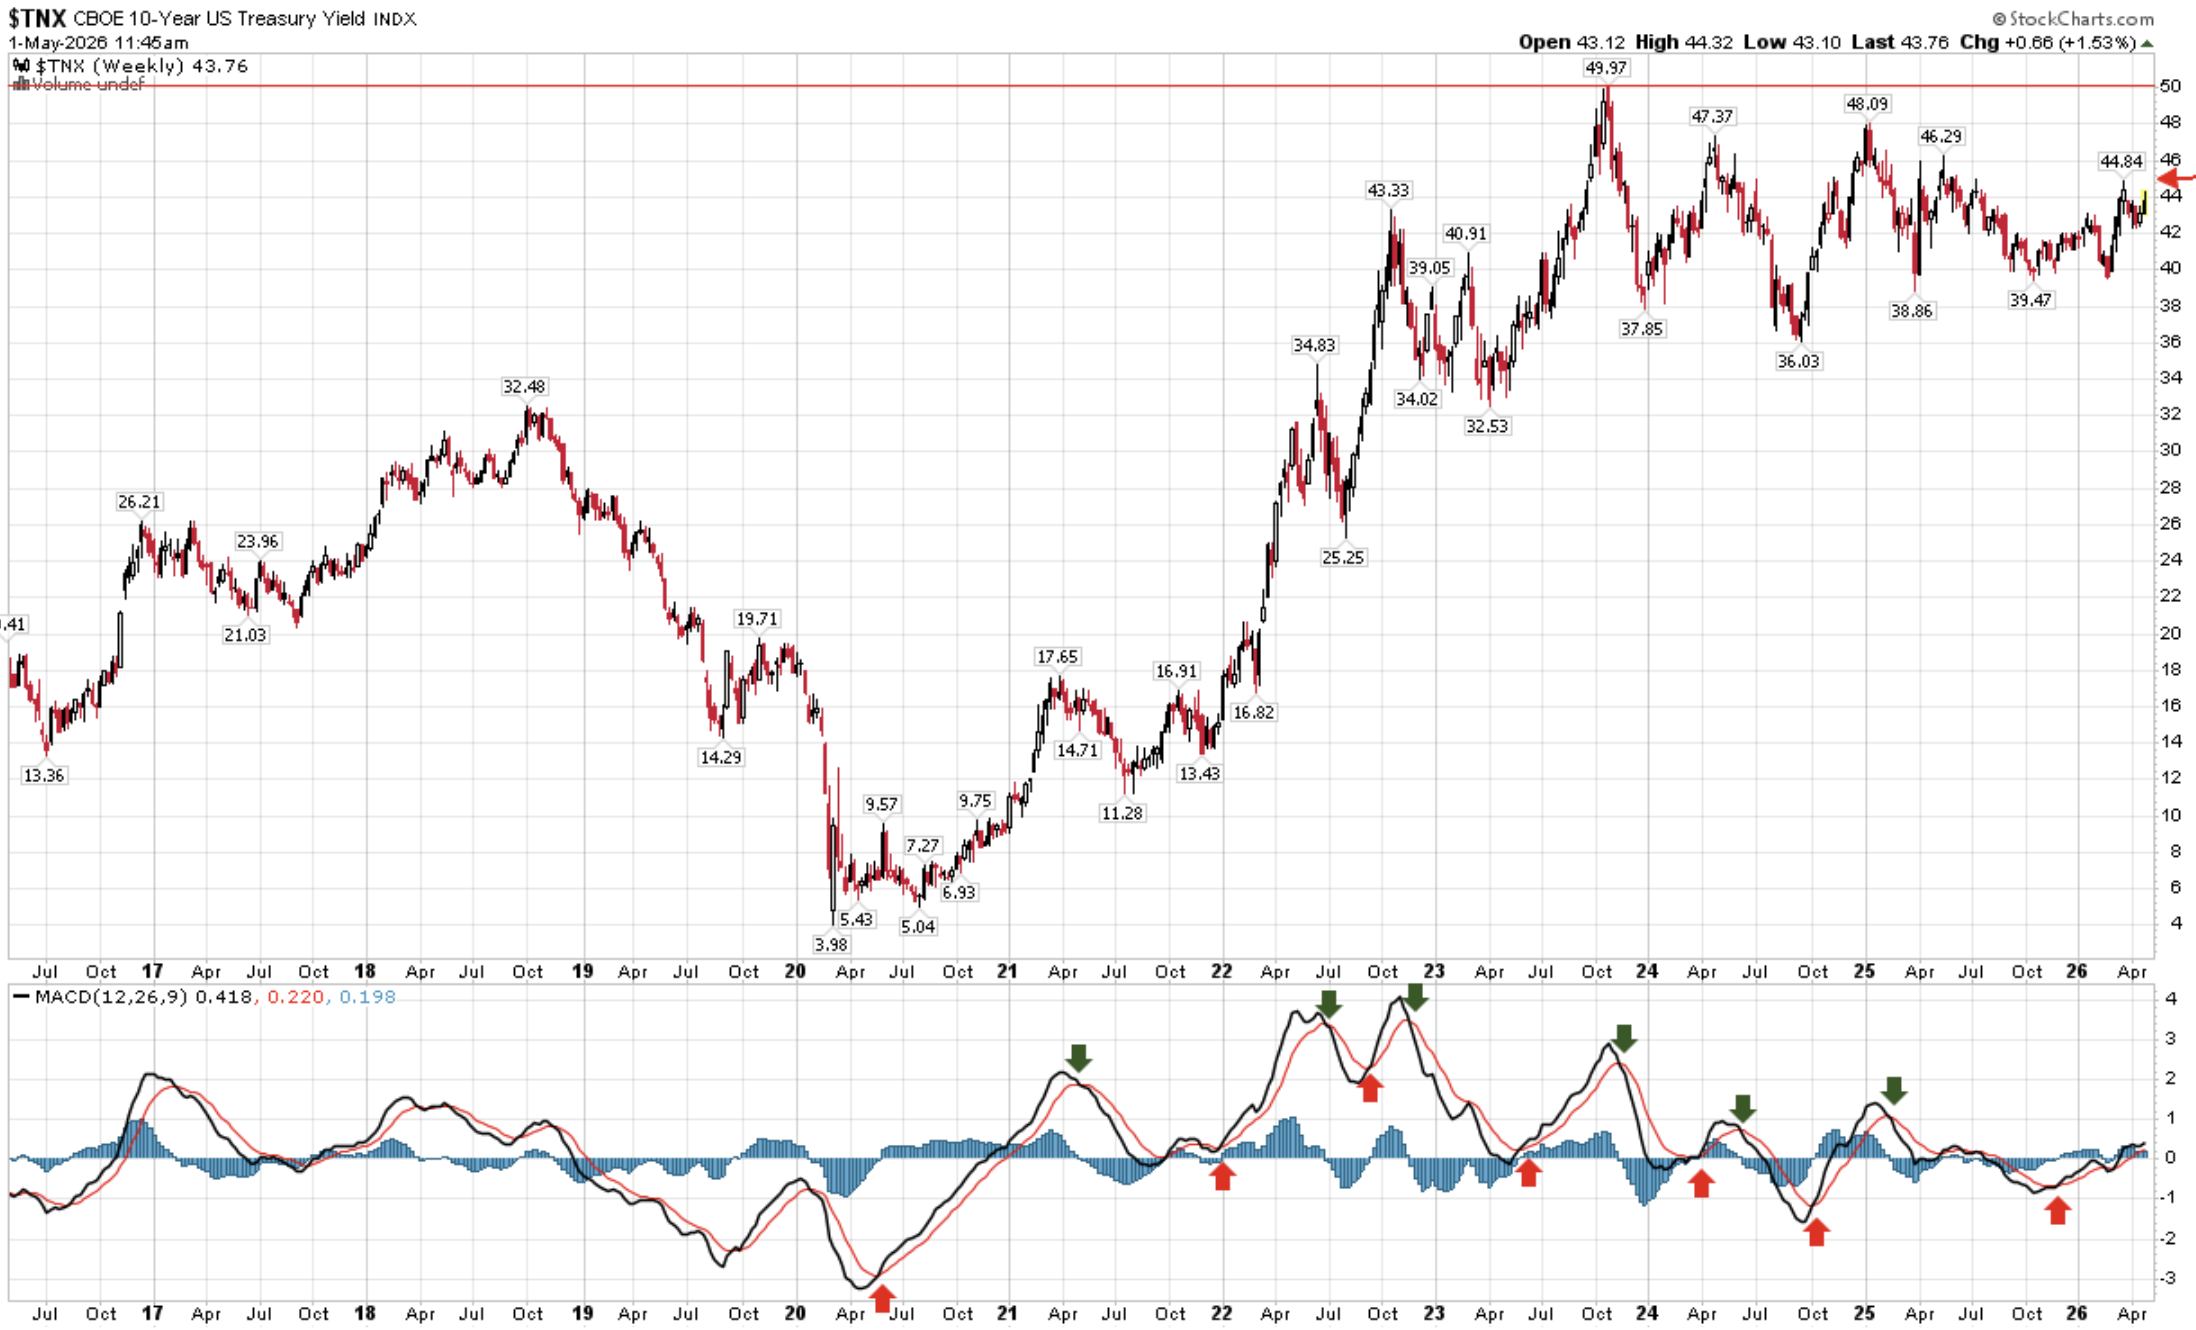
Source: Stockcharts.com and CMG annotations. Red arrows indicate rising interest rate trend. Green arrows indicate a declining interest rate trend.
Here is a look at the 30-year from my fishing friend, Jim Bianco:
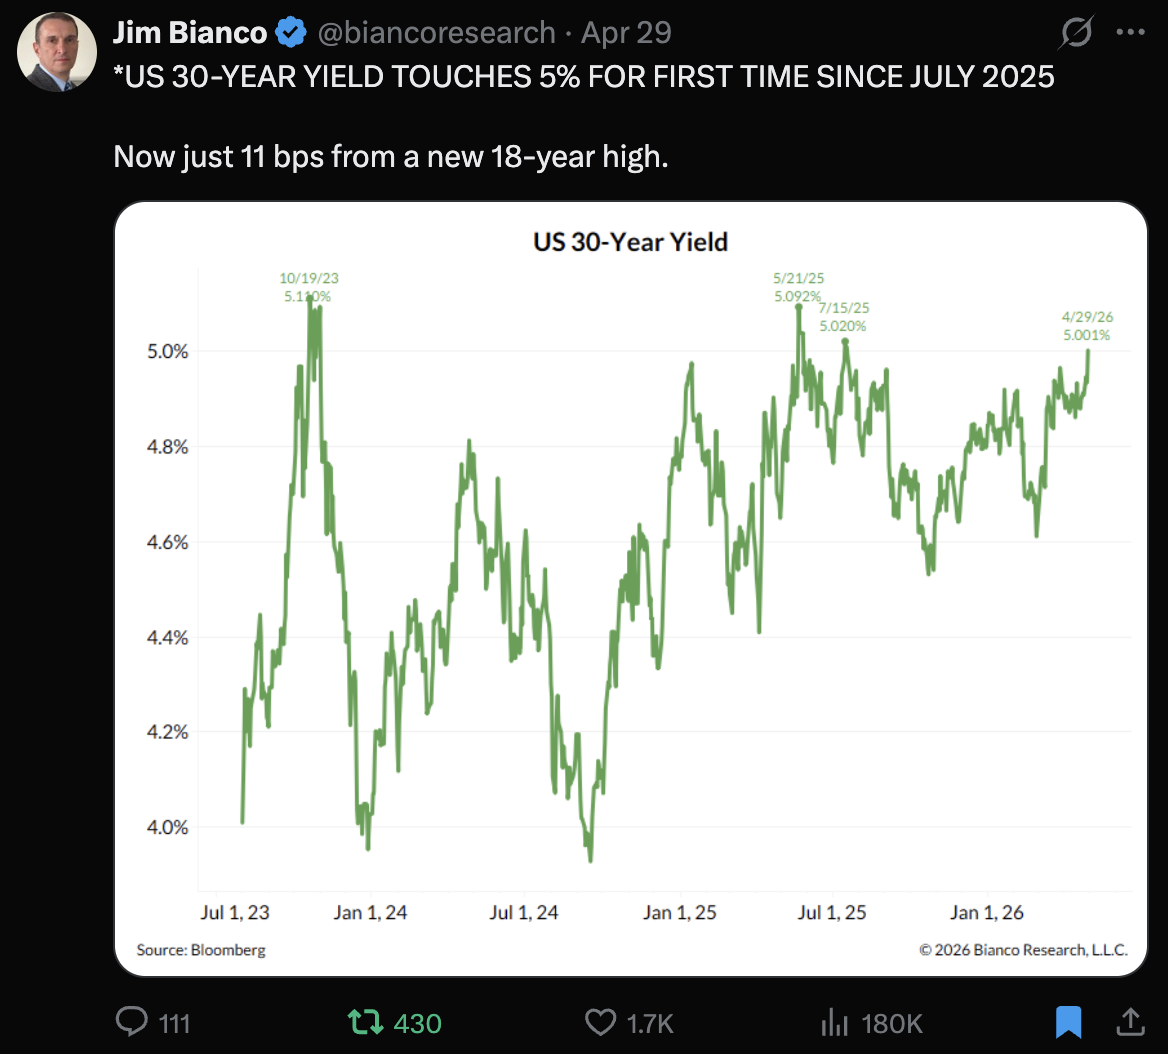
Source: @biancoresearch
The Dollar and The Yen
First, a look at the charts. Then explanations.
The Dollar:
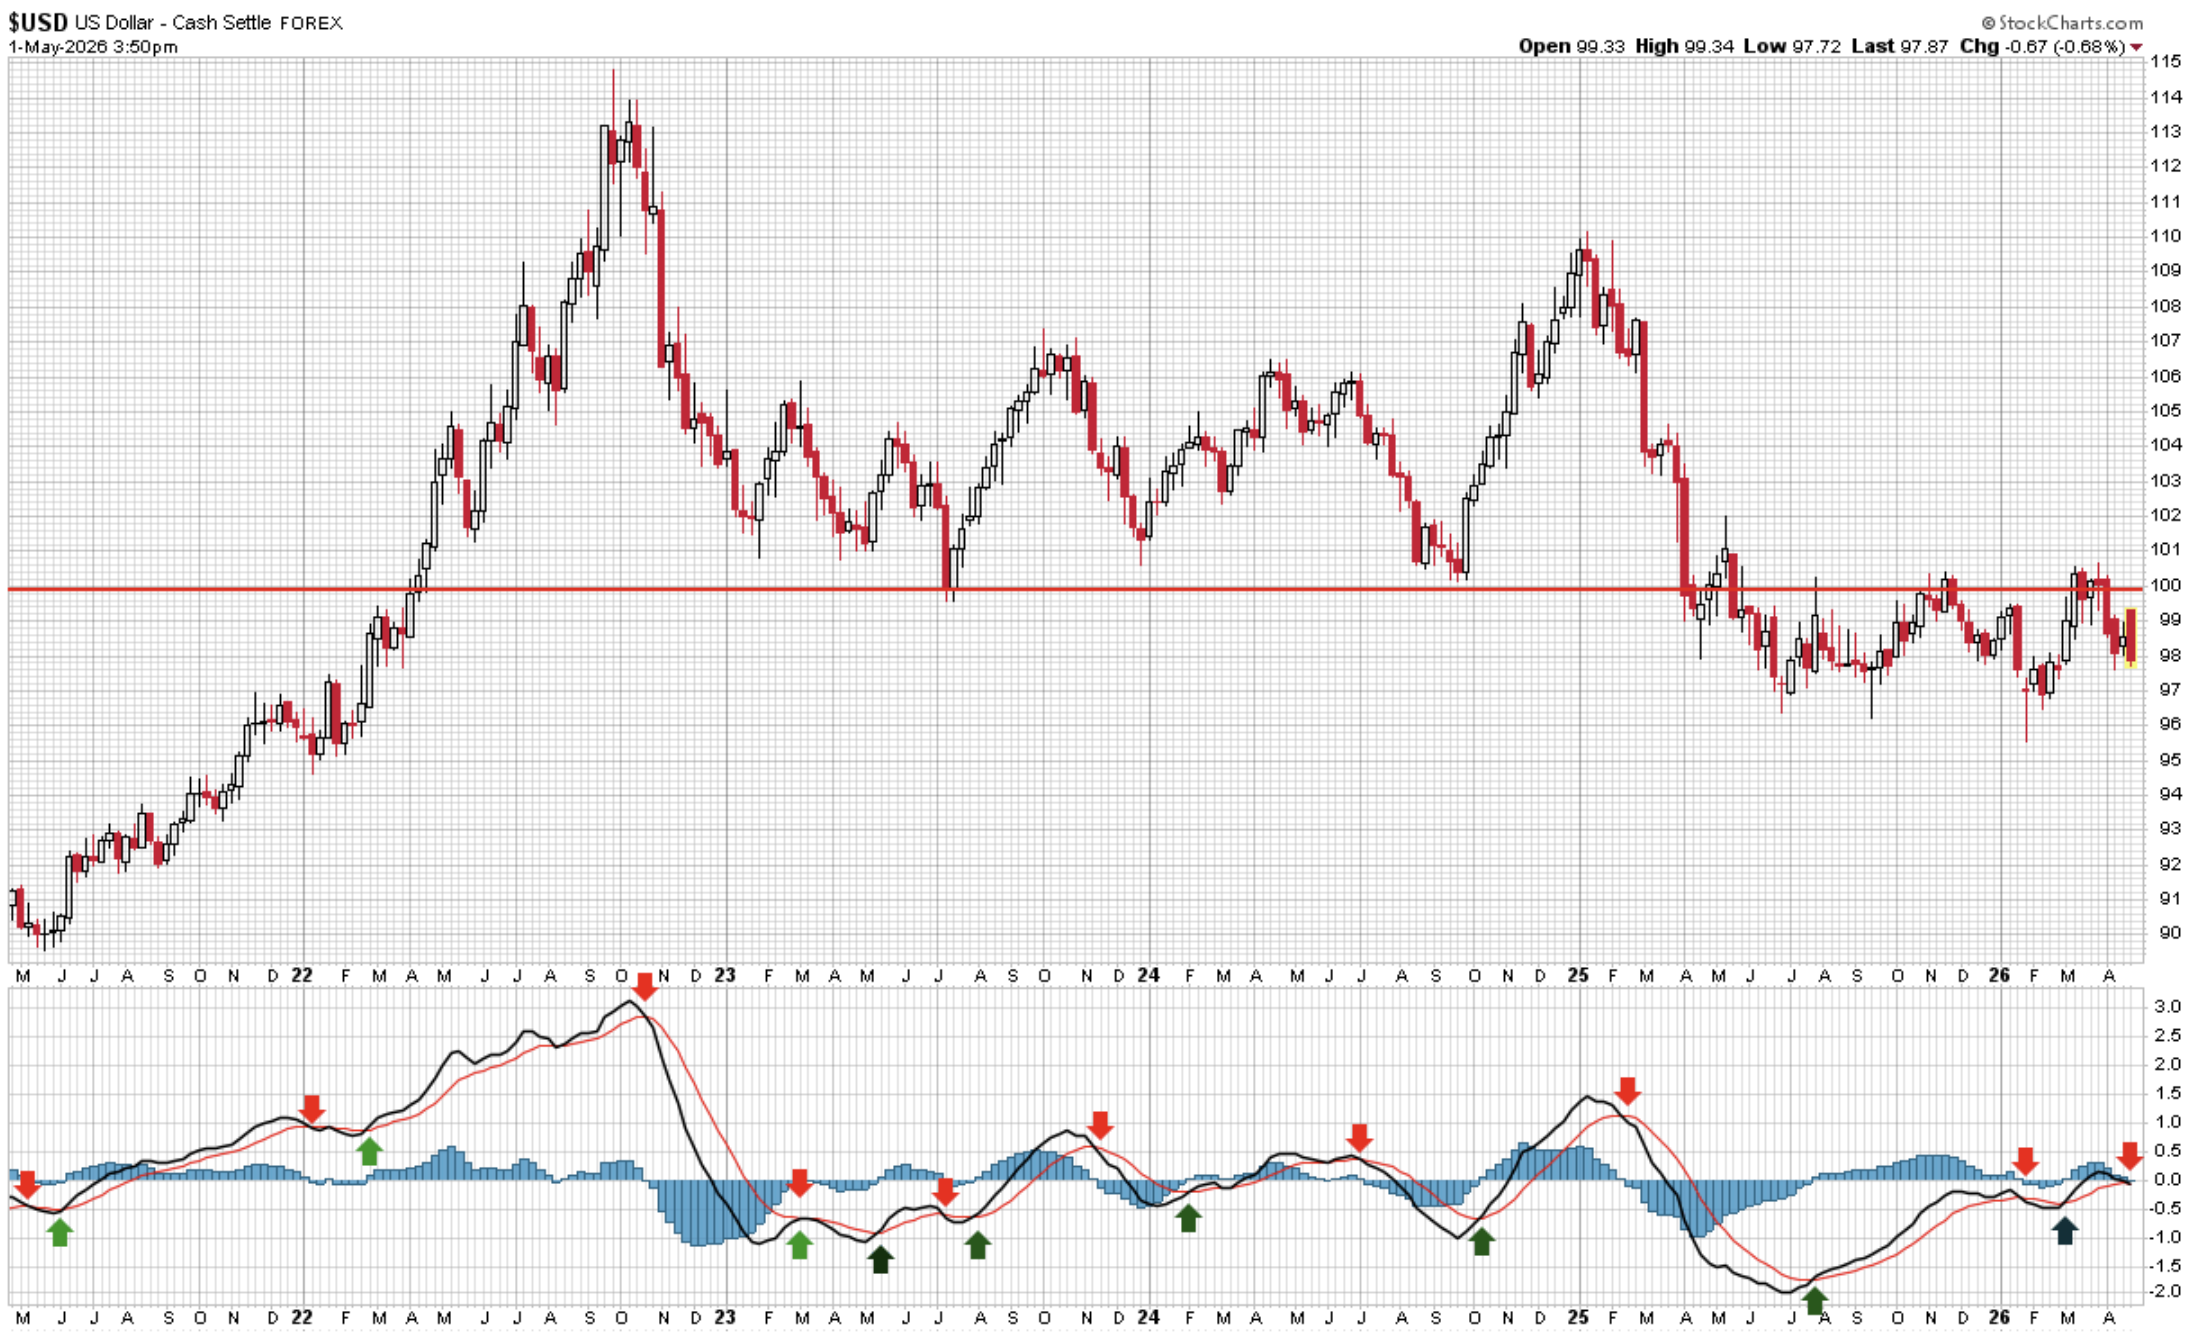
Source: Stockcharts.com and CMG annotations.
The last red bar on the far right shows a quick reversal from the week’s high price. This is likely due to the Japanese currency intervention (buying Yen, selling dollars).
My guess is that Trump and Bessent’s line in the sand is 4.50%. I believe a gap above that will rattle markets. Remember that nearly $10 trillion in Treasury debt needs to be refunded, in addition to ongoing borrowing required to finance the nearly $2 trillion annual deficit.
The Yen vs the Dollar:
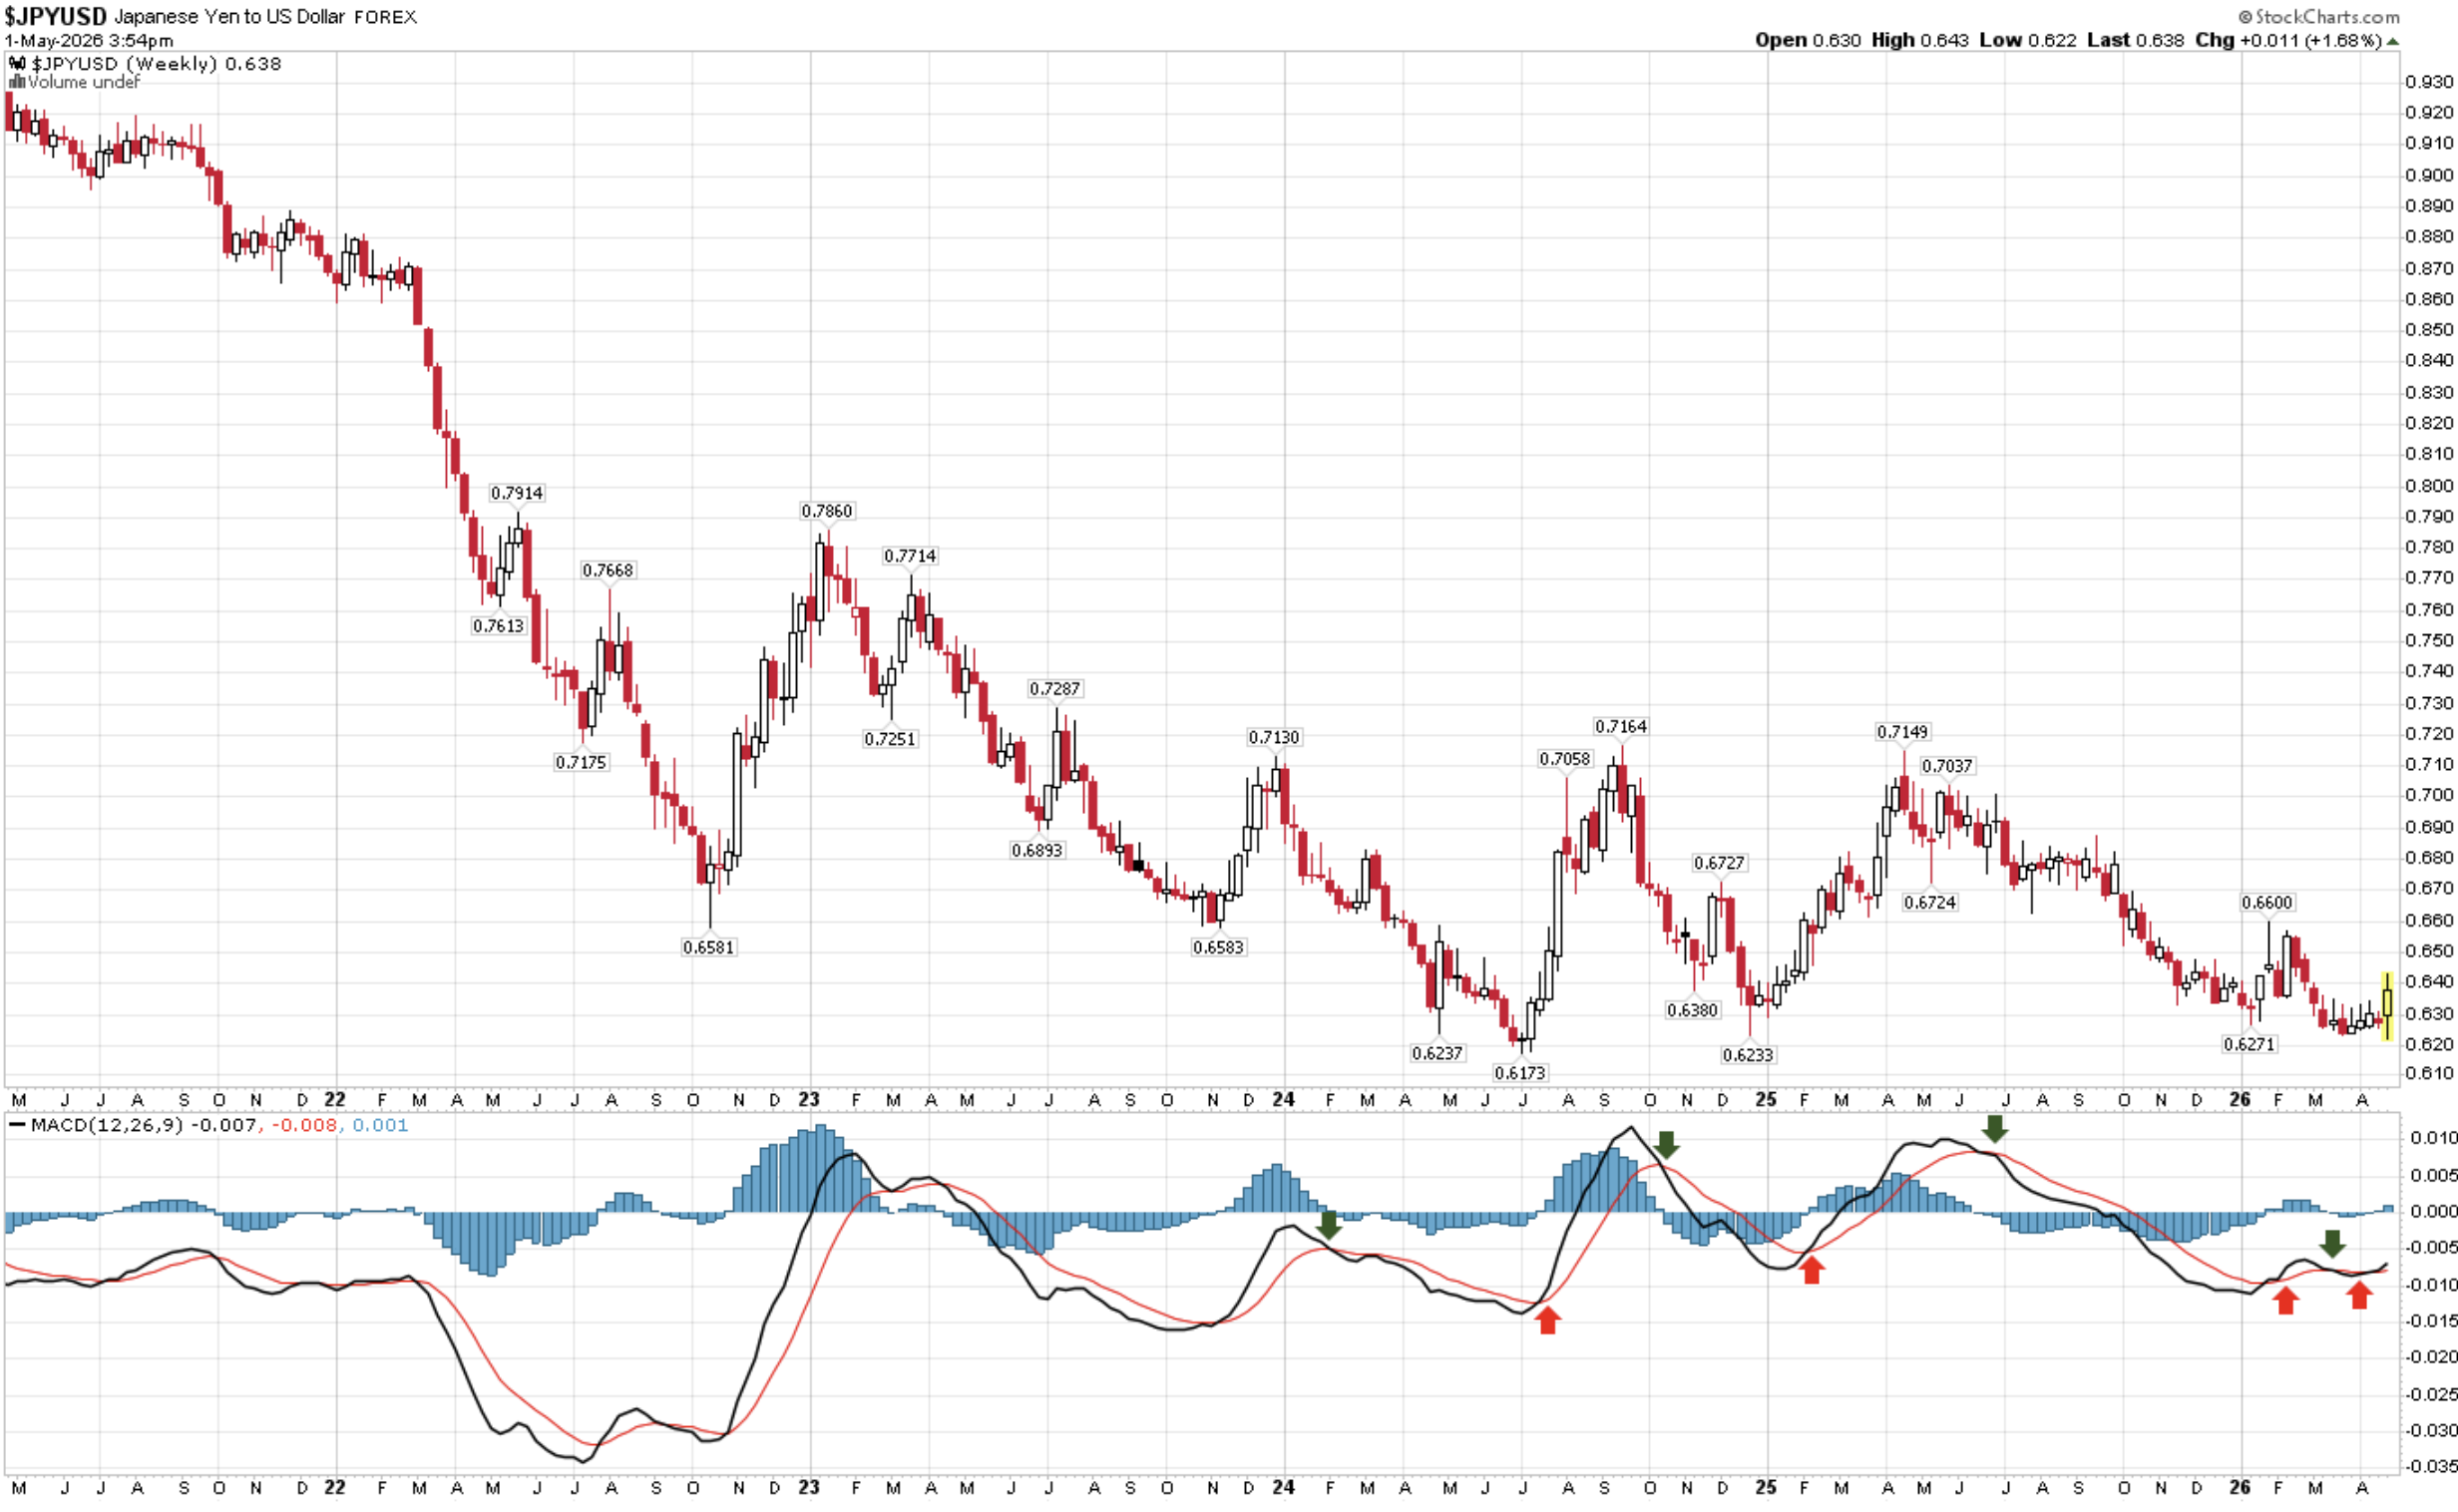
Source: Stockcharts.com and CMG arrow annotations
Some color around why this is important for global risk markets:
As mentioned above, Japan needs a stronger yen because it imports the vast majority of its energy (oil). Since oil is priced in dollars, a declining Yen means Japan needs more Yen to buy a barrel of oil. Oil above $100 per barrel worsens inflation in Japan. Combined, this is painfully inflationary for the Japanese people.
One way to fight inflation and strengthen one’s currency is to raise interest rates. That’s been happening. It is notable that, uncharacteristically, the Yen continued to decline vs the dollar until yesterday’s BoJ intervention.
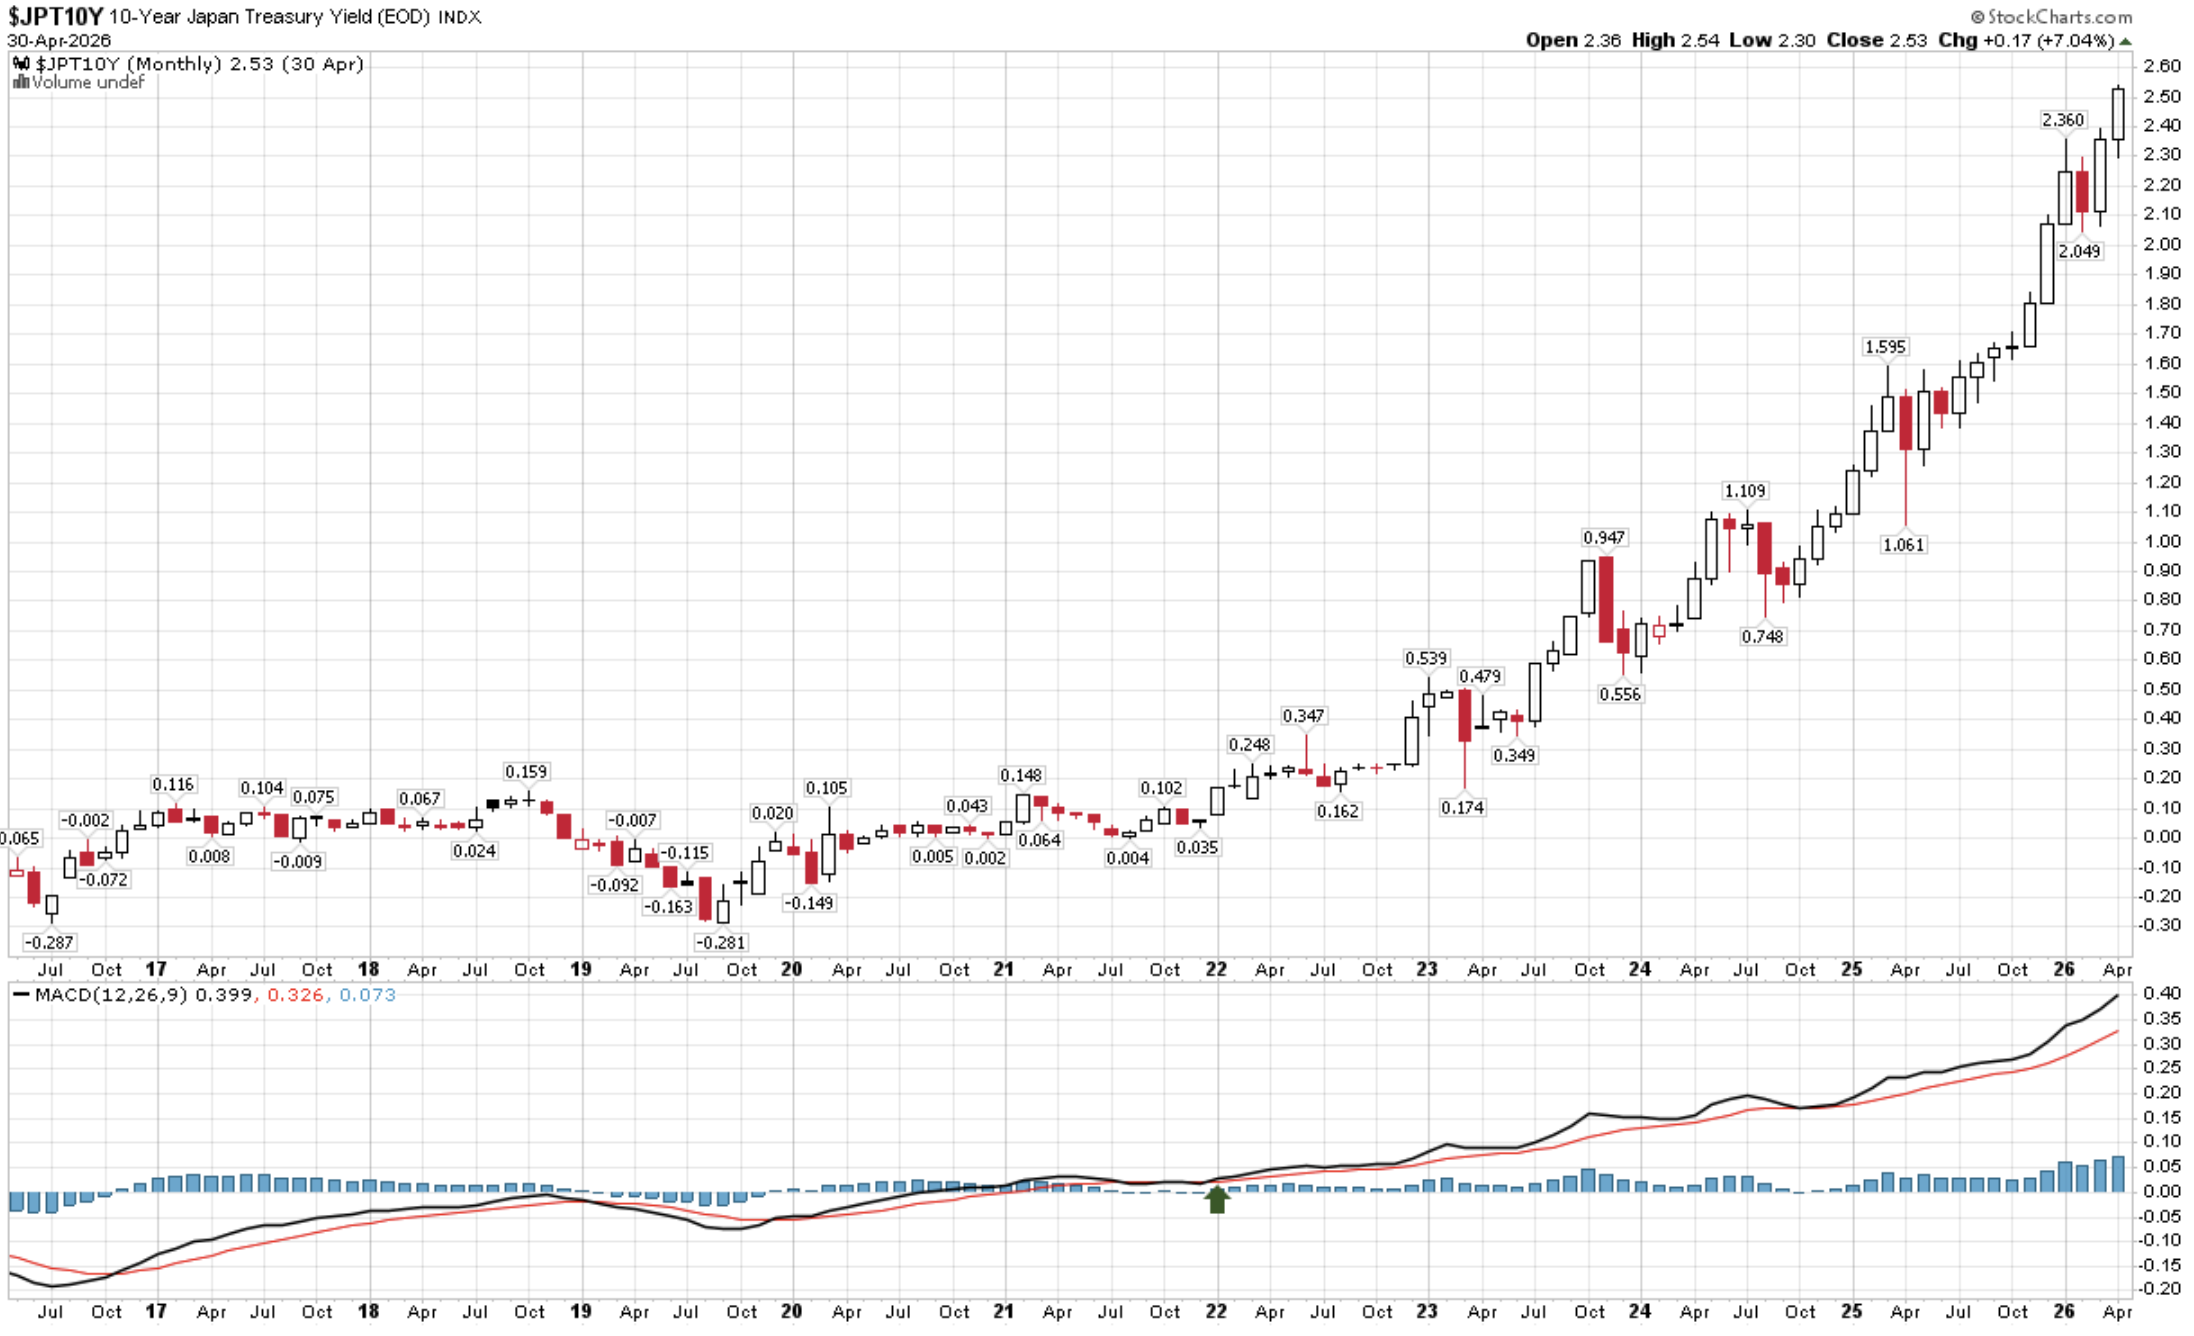
Source: Stockcharts.com
Next is a longer-term look at the 10-year Japanese Government Bond yield. Currently at the highest levels since the mid-1990s.
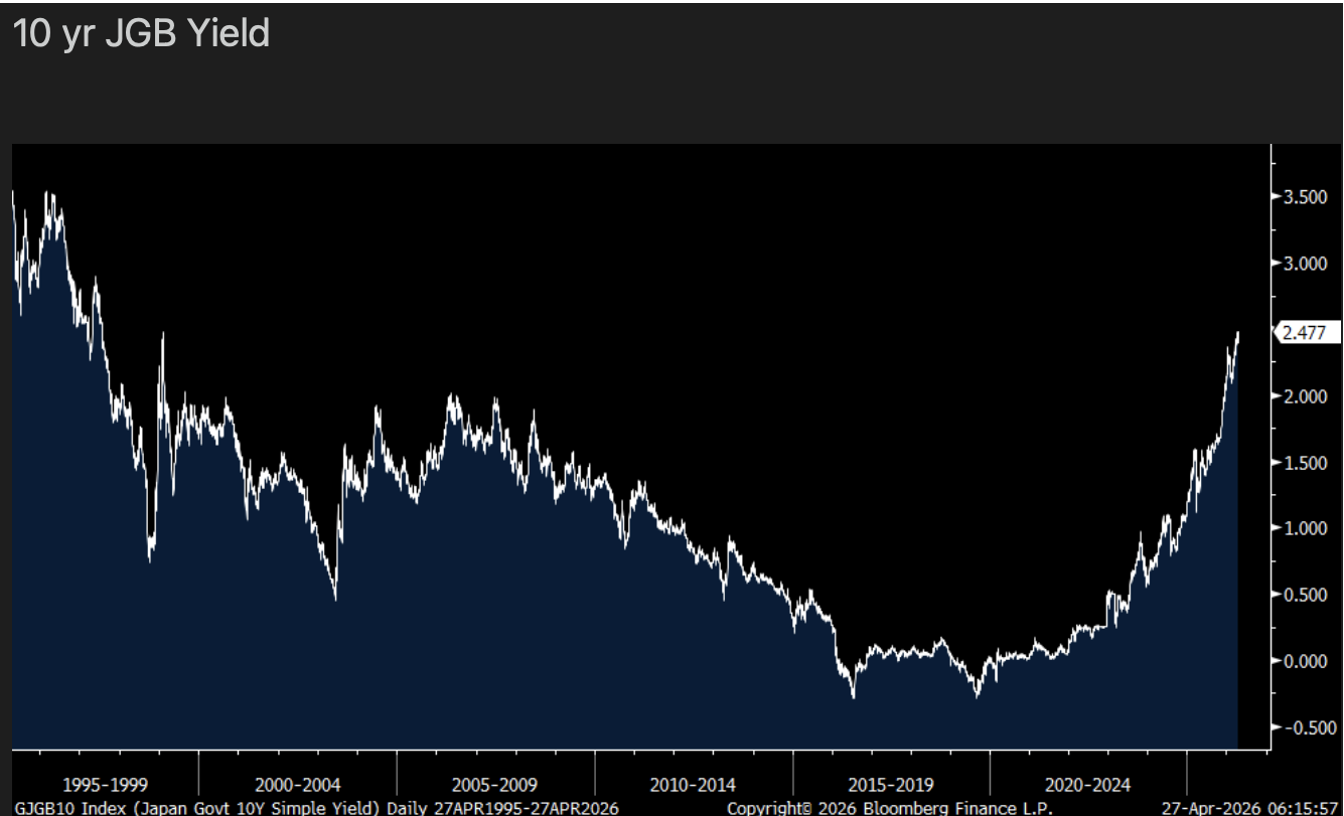
Source: Bloomberg
A rising yen is often a sign that global liquidity is tightening. It puts pressure on the yen carry trade, forcing investors to unwind positions (borrow in Yen and buy U.S. stocks or higher-yielding bonds) that were funded in low-interest-rate yen.
To unwind, the players in the yen carry trade would sell U.S. stocks, convert U.S. dollars to yen, and pay off the loans. Simply, higher borrowing costs from Japan make the trade unattractive.
It generally signals a global shift toward “risk-off.” In short: yen up, liquidity down. Typically, a headwind for equities.
Bottom line: We are in the grips of what I’ve been calling “inflation wave #2,” and inflation is problematic to pretty much everything.
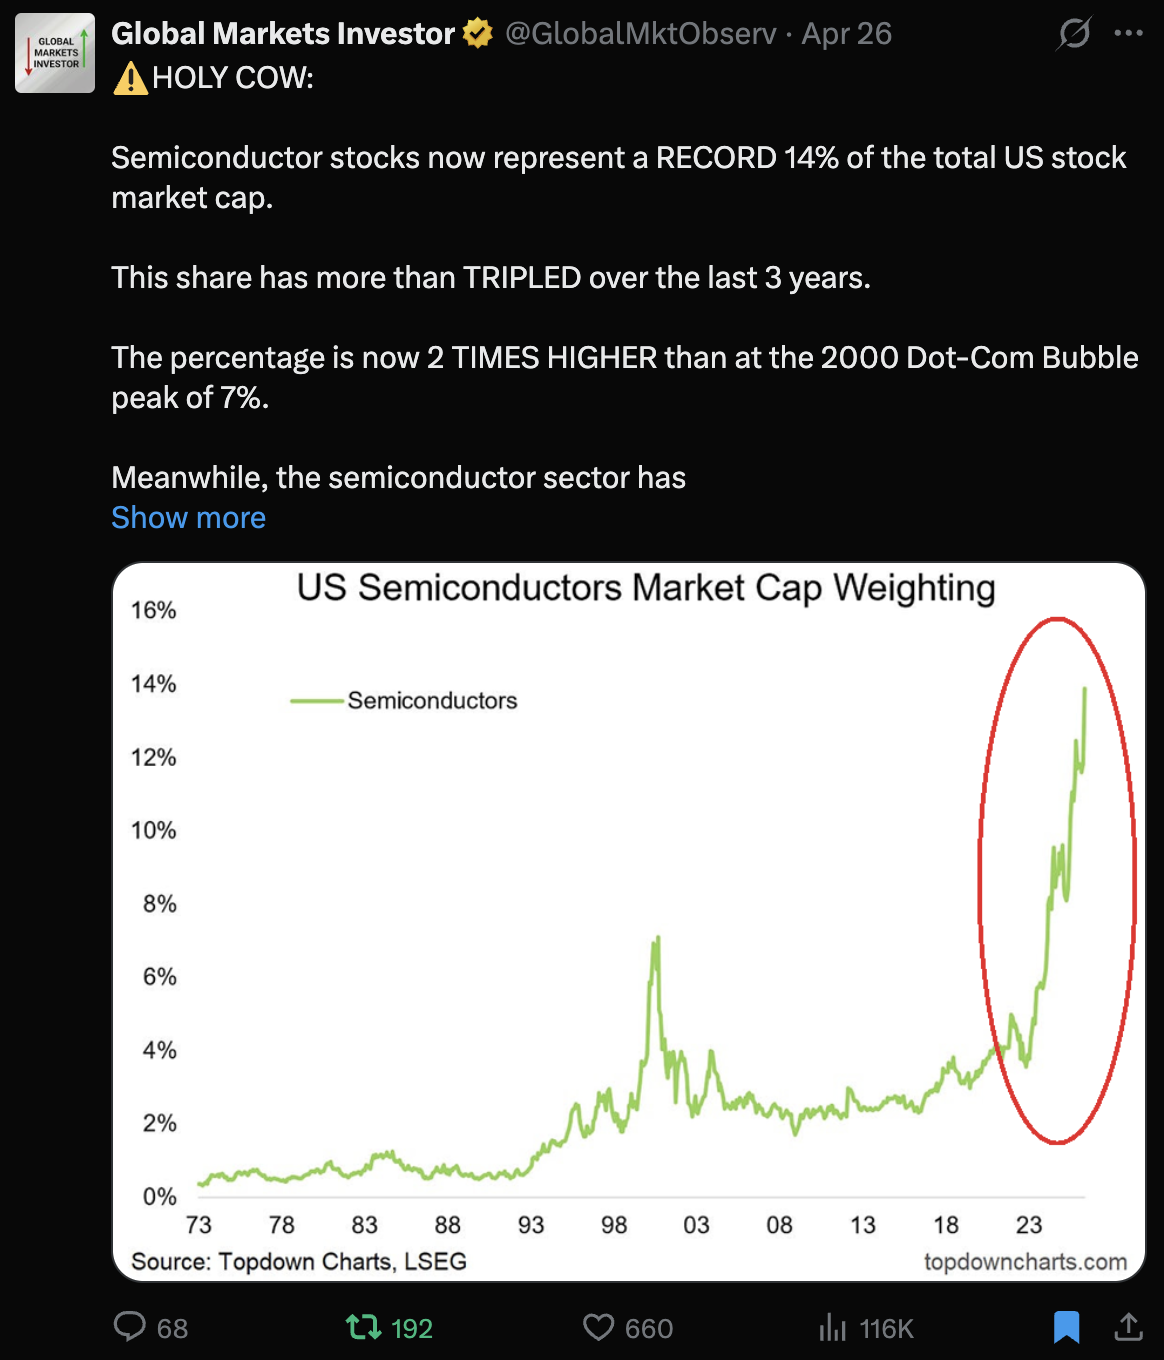
This post on X from @GlobalMktObserv:
Japan stepped into the currency market on Thursday, buying yen after FX Chief Mimura issued his "final warning" to speculators, pushing the yen from 160.72 to as strong as 155.57 per US Dollar.
In effect, Thursday's USDJPY trading volume surged to ~$90 BILLION, the highest of any intervention session on record, dwarfing all prior intervention days, including the 2022 and 2024 episodes.
BoJ data indicates Japan may have spent as much as ¥5.48 trillion (~$35 billion) in Thursday's intervention, exceeding market forecasts of ¥4 trillion to ¥4.5 trillion, per Reuters.
The intervention was coordinated with US economic officials, who were notified ahead of time in line with G7 agreements requiring counterparts to be alerted when acting to curb excess volatility.
Japanese officials also signaled readiness to intervene in CRUDE OIL FUTURES markets, where market activity has been directly linked to recent yen weakness. The yen could face further pressure next week during Japan's Golden Week holidays, when reduced market liquidity could amplify currency moves. 2 years ago, Japan intervened twice during Golden Week, ultimately spending ~$100 billion to stabilize the yen, and officials have signaled they are prepared to act again at any time.
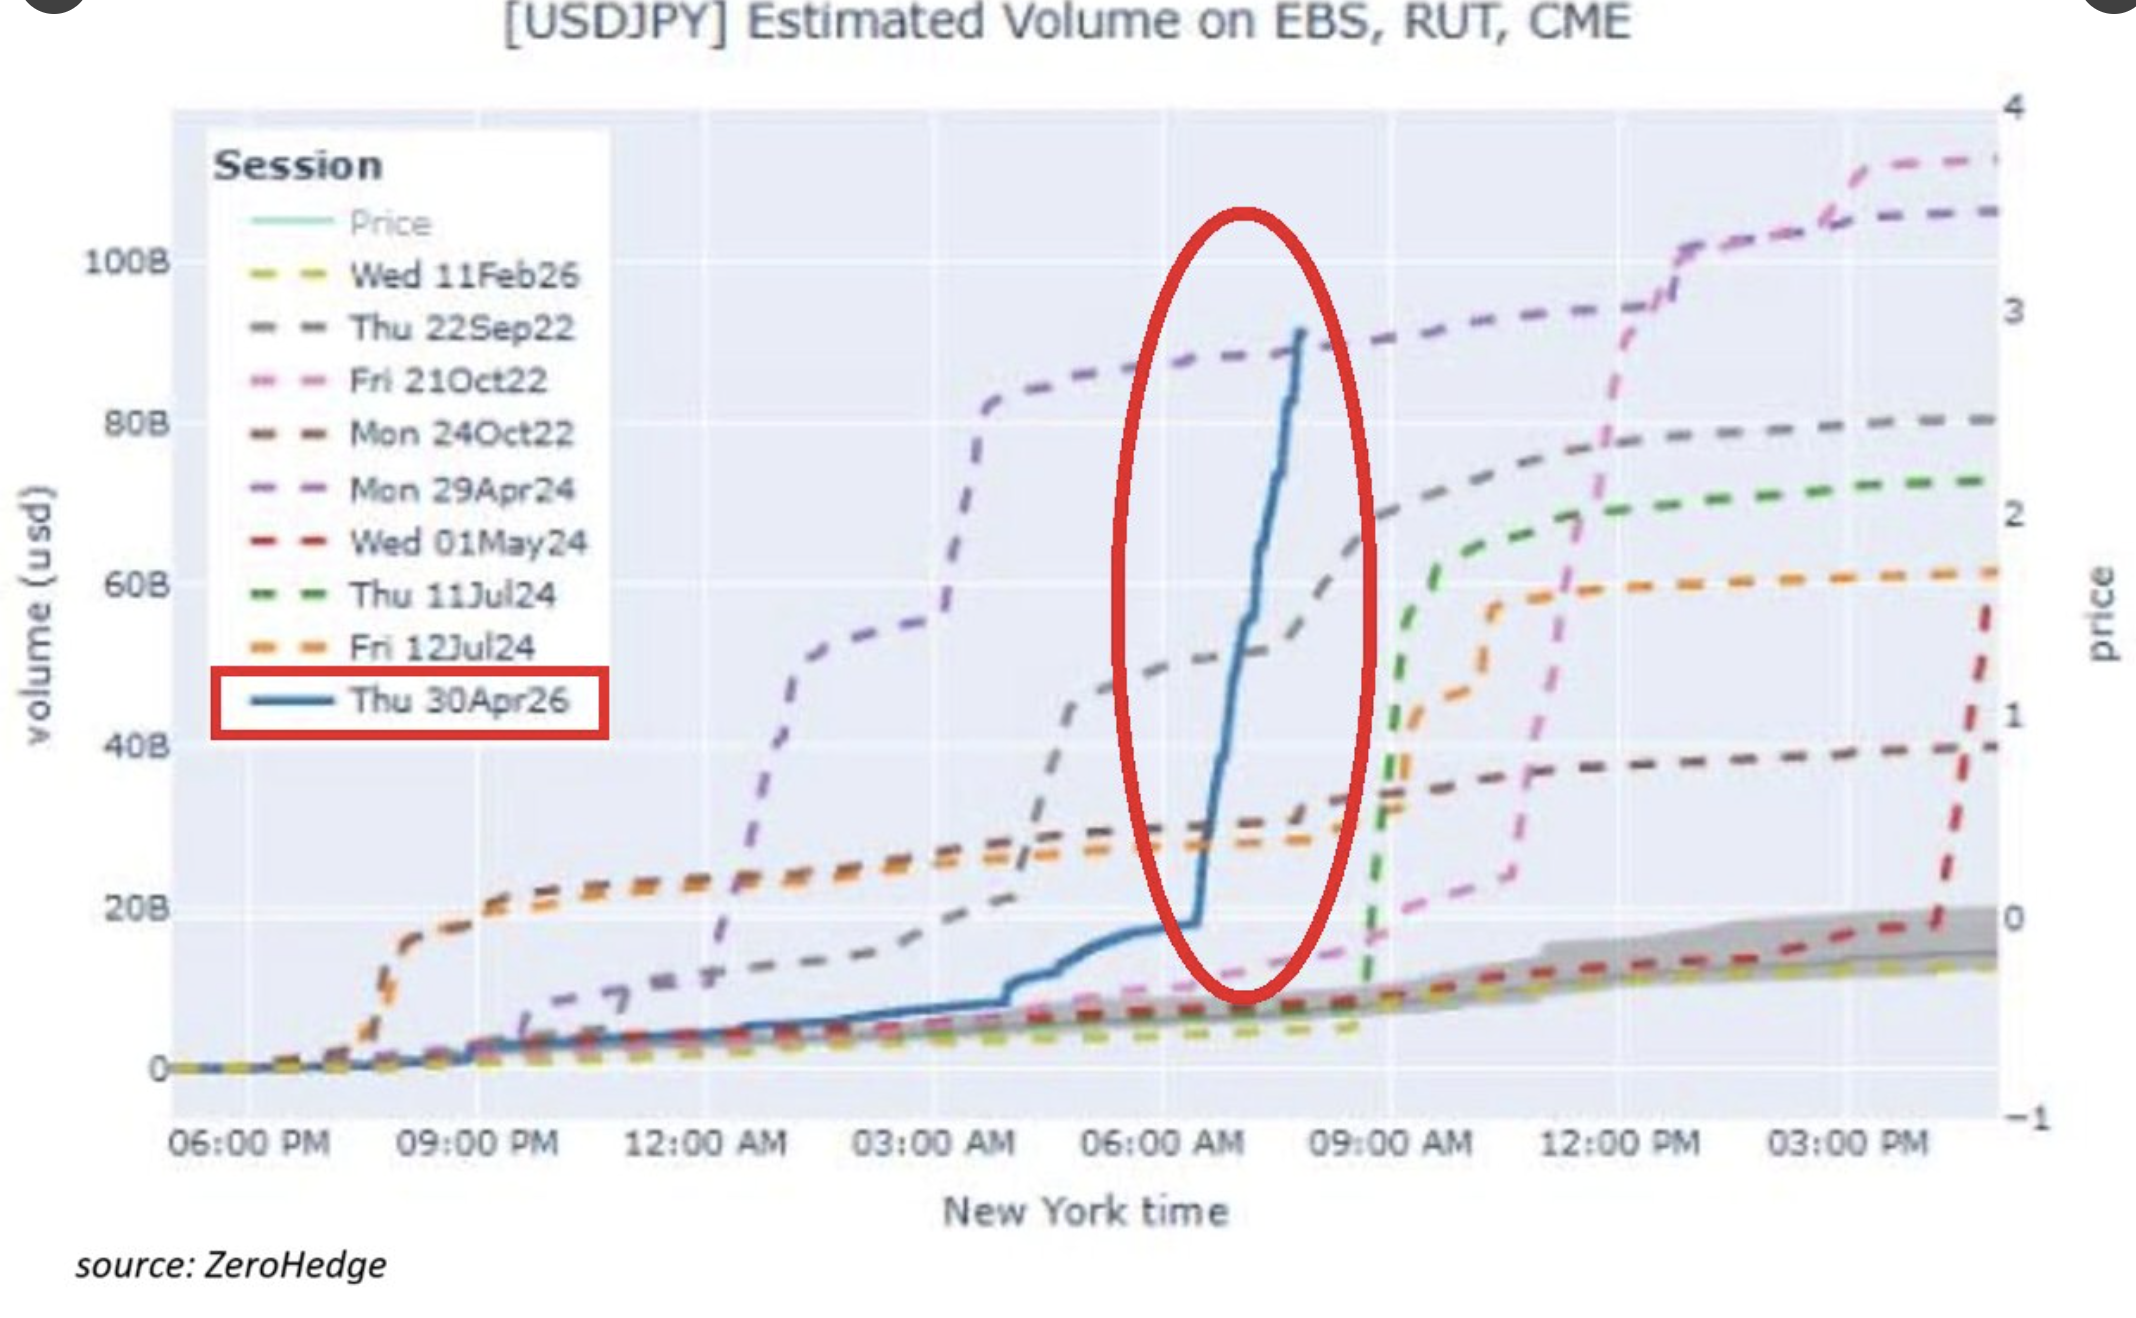
Source: Zerohedge, @GlobalMktObserv
Bottom line: Let’s keep our eyes glued to government yields, the dollar, and the yen.
Opinions are Steve Blumenthal’s. Views are subject to change. Not a recommendation to buy or sell any security. Please note that the information provided is not recommended for buying or selling any security and is provided for discussion purposes only.
Extreme Stock Index Valuations
Rates are rising, but the Honey Badger doesn’t care. The U.S. stock markets are at record highs. Our trend indicators remain positive. Our experience with past bubble equity market valuation highs suggests caution. Let’s look at a few charts.
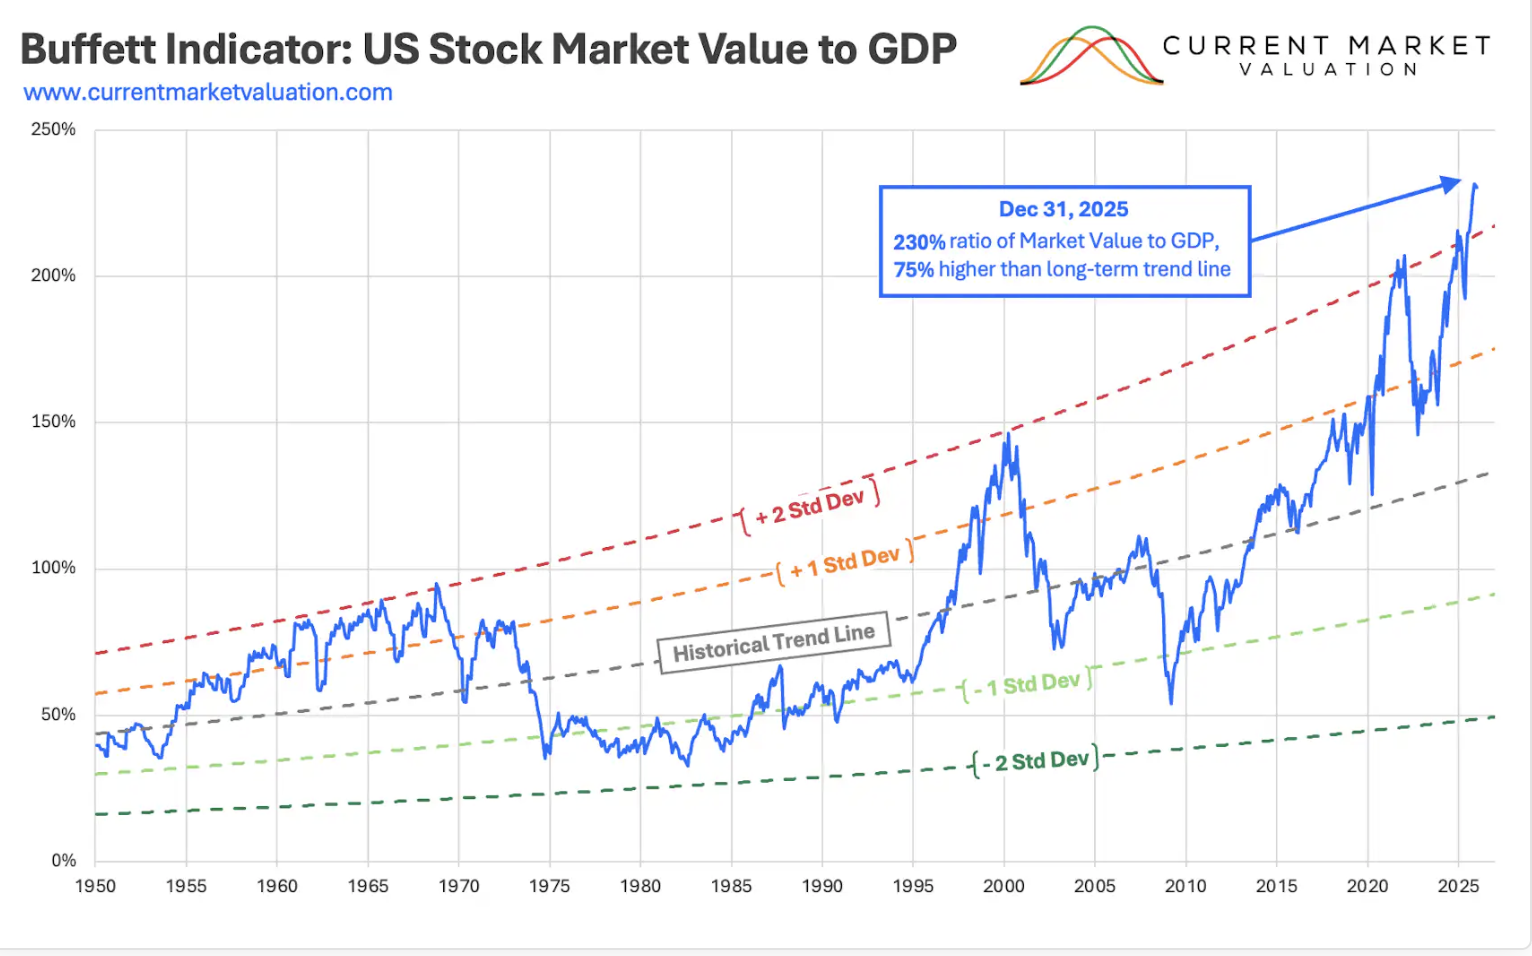
Buffett Indicator:
I listened to a podcast this week featuring Paul Tudor Jones. The following comment stood out: “At 230%+ of GDP, the Stock Market Is a Loaded Gun & why a 35% Equity Correction Will Trigger the Greatest Money Printing Event in History!”
Here is a look at the Buffett Indicator Jones is referring to, shown in an excellent chart from Current Market Valuations (note: +2 Standard Deviation moves rarely occur).
Forward PE:
The blue dot indicates the intersection of the current Forward PE valuation metric and the annualized 10-year Forward returns.
Follow the dotted blue line to the left, and you see 0%.
Click on the chart to go to the soure post.
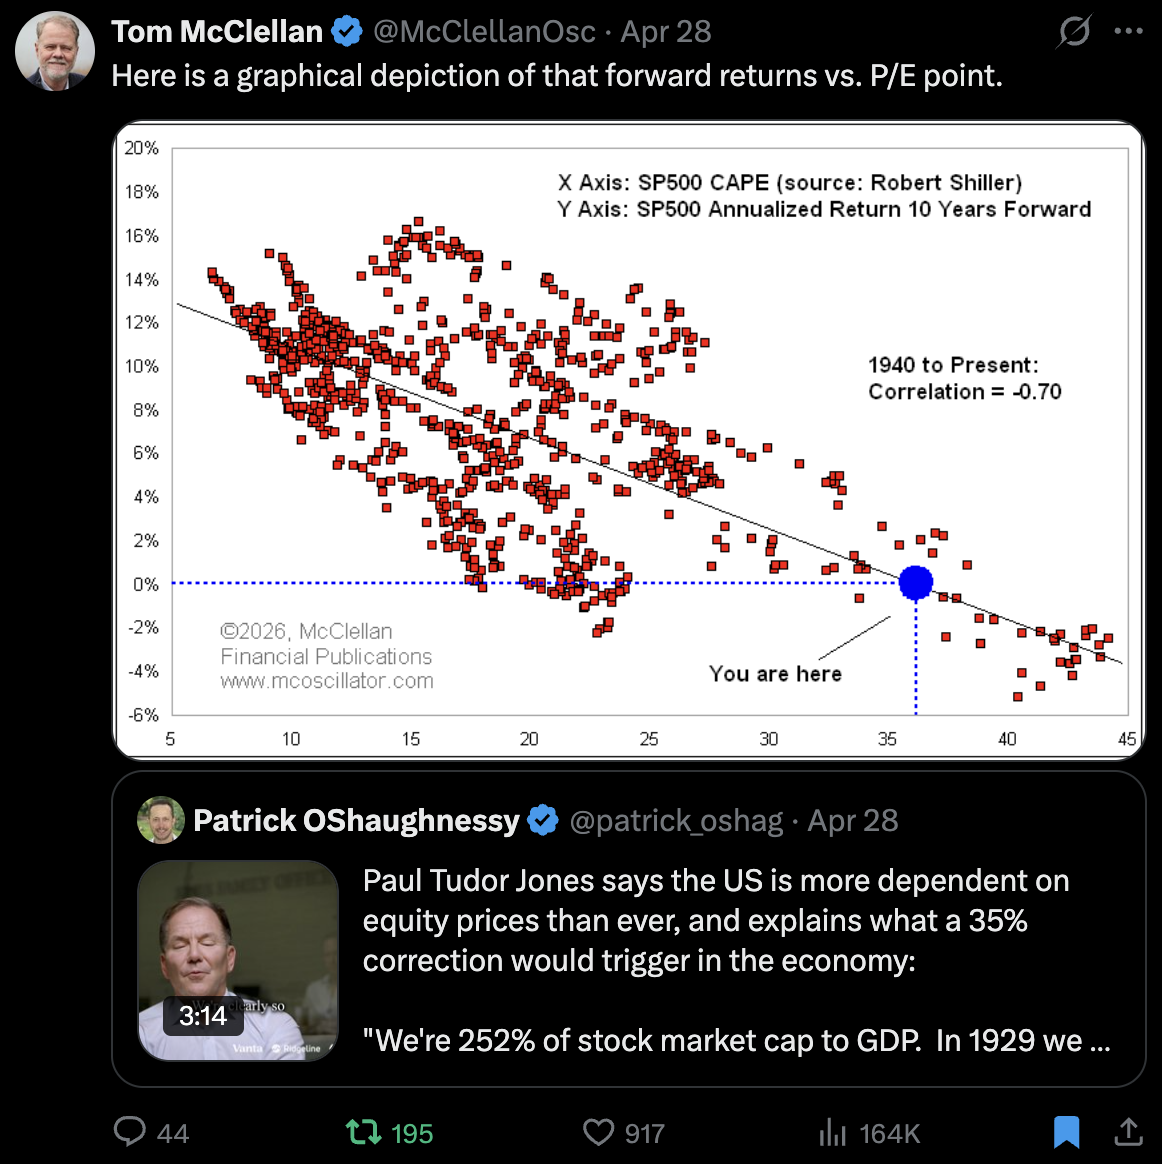
Source: @McclellanOsc, X, @patrick_oshag
Source: @globalmktobserv, X, follow me on X @SBlumenthalCMG
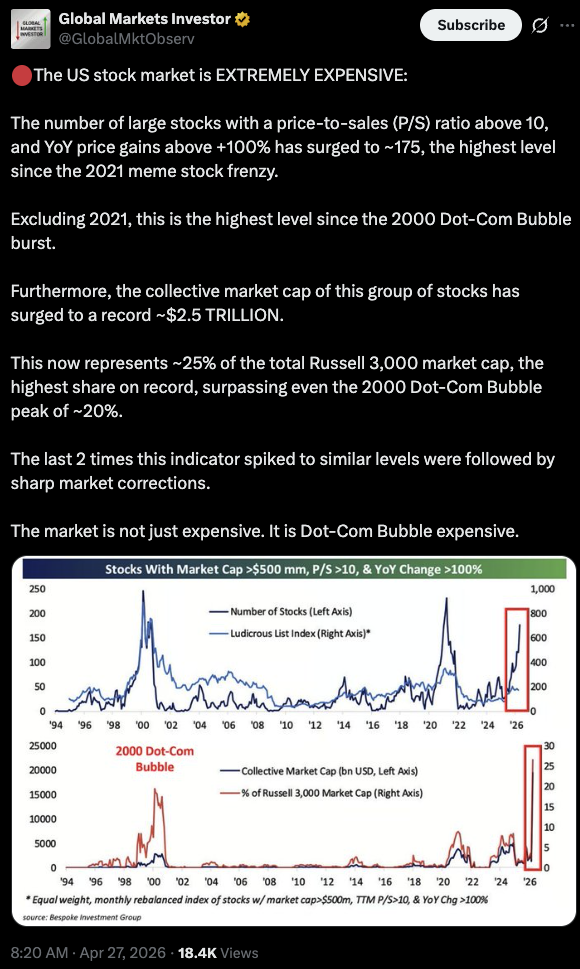
One more for your dining pleasure:
Click on the photo for the full post
Source: X, GlobalMktObserv
Bottom line: I have no idea when the mania stops, but I’m confident it will. Yes, AI is a tremendous productivity game-changer. The question is, have we priced the market to AI perfection? Also, I believe the inflation shock is being totally ignored. Risk is high. Hedge cap-weighted index funds accordingly.
* No guarantees; all investing involves risk. Views are subject to change. TRADE SIGNALS SUBSCRIPTION ACKNOWLEDGEMENT / IMPORTANT DISCLOSURES
As always, this is not investment advice. For discussion purposes only. Reach out to us if you have any questions.
Views are subject to change. Not a recommendation to buy or sell any security. Please note that the information provided is not recommended for buying or selling any security and is provided for discussion purposes only. Current viewpoints are subject to change. Please note that the information provided is not recommended for buying or selling any security and is provided for discussion purposes only. See important CMG disclosures below.
If you like what you are reading, click on the link and share it with a friend (it’s free).
CLICK HERE TO SUBSCRIBE TO ON MY RADAR - IT’S FREE
Not a recommendation to buy or sell any security. Please note that the information provided is not intended to recommend buying or selling any security and is for discussion purposes only. Current viewpoints are subject to change. Please note that the information provided is not recommended for buying or selling any security and is provided for discussion purposes only.
Trade Signals: April 30, 2026 Update
Trade Signals - subscribers only
The Indicators Dashboard - Stocks, Investor Sentiment, Bonds, Commodities, Currencies, and Gold
Valuations and Subsequent 10-year Returns
Supporting Charts with Explanations
About Trade Signals - Trade Signals is a paid subscription service that posts the daily, weekly, and monthly trends in the markets (and more). Free for CMG clients. Not a recommendation to buy or sell any security. For discussion purposes only.
“Extreme patience combined with extreme decisiveness. You may call that our investment process. Yes, it’s that simple.” – Charlie Munger

TRADE SIGNALS SUBSCRIPTION ACKNOWLEDGEMENT / IMPORTANT DISCLOSURES
The views expressed herein are solely those of Steve Blumenthal as of the date of this report and are subject to change without notice. Not a recommendation to buy or sell any security.
Please note that the information provided is not recommended for buying or selling any security and is provided for discussion purposes only. Current viewpoints are subject to change. Please note that the information provided is not recommended for buying or selling any security and is provided for discussion purposes only.
Personal Note: Paul Tudor Jones - Joel Greenblatt
“My largest positions aren’t the ones I think I’m going to make the most money from. My largest positions are the ones where I don’t think I’m going to lose money.”
- Joel Greenblatt, Gotham Asset Management
I recently listened to a fantastic podcast interview with Paul Tudor Jones. It’s a fun, insightful listen - you can find it here on Spotify.
Jones shared a moving story about being a young boy and getting separated from his mother at a crowded market. A kind stranger walked with him until they found her, and his family said prayers of gratitude for that man every night for years. Perhaps that experience set Jones on his path to giving. He is famously hands-on with his philanthropy, most notably founding the Robin Hood Foundation in 1988 to fight poverty in New York City.
In the markets, Jones is a master "top-down" trader. He’s constantly scanning the horizon, asking:
Where are interest rates heading?
How will geopolitical events ripple through the markets?
What is the trend of inflation and central bank liquidity?
He is a trend-follower who prioritizes risk management above all else. He trades price and momentum; if the market moves against him, he’s out quickly.
I stumbled across the Joel Greenblatt quote above while reviewing my notes in Evernote. (I use it to store everything from market research and golf tips to jokes and medical news - it’s been a great tool for me over the years.)
While Jones scans the horizon, Greenblatt lives in the details. He is the ultimate "bottom-up" special situations investor. In 1985, he launched Gotham Capital with just $7 million. Through the early ’90s, Gotham compounded capital at an eye-popping 50% annually before fees by hunting in overlooked corners: spinoffs, restructurings, and mispriced "good businesses." Source: Wikipedia
Greenblatt asks a different set of questions:
Is this business cheap relative to its earnings?
Does it have a high return on capital?
Is there a "special situation" that the market has missed?
Greenblatt is valuation-driven and incredibly patient. He doesn’t worry much about the macro backdrop; if a business is cheap enough with a large margin of safety, he buys and waits for the market to realize its value.
The Bottom Line
These two legends represent entirely different paths to the same goal. From an "endowment model" perspective, this is a perfect example of the power of diversification. By combining a top-down macro approach with a bottom-up valuation approach, you create a portfolio that can thrive in many different seasons.
Sadly, both Jones and Greenblatt have largely moved away from taking outside capital, but their philosophies remain among the best "tips" in the investing world.
I’ll be home this weekend and through most of May. Susan and I are hoping to sneak away for a long weekend, but for now, the "board" mostly consists of fixing a pond leak, yard work, and, of course, a little bit of golf.
Wishing you a fun and restful weekend.
With kind regards,
Steve
CLICK HERE TO SUBSCRIBE TO ON MY RADAR - IT’S FREE
You can share this letter on X by clicking here.
You can share this letter on LinkedIn by clicking here.
Subscribe to OMR for free by clicking the photo.
Stephen B. Blumenthal
Executive Chairman & CIO
CMG Capital Management Group, Inc.
75 Valley Stream Parkway, Suite 201,
Malvern, PA 19355
CMG Customer Relationship Summary (Form CRS)
Metric-Financial, LLC Customer Relationship Summary (Form CRS)

Stephen Blumenthal founded CMG Capital Management Group in 1992 and serves today as its Executive Chairman and CIO. Steve authors a free weekly e-letter entitled, “On My Radar.” Steve shares his views on macroeconomic research, valuations, portfolio construction, asset allocation and risk management. Author of Forbes Book: On My Radar, Navigating Stock Market Cycles.
Follow Steve on X @SBlumenthalCMG and LinkedIn.
IMPORTANT DISCLOSURE INFORMATION
This document is prepared by CMG Capital Management Group, Inc. (“CMG”) and is circulated for informational and educational purposes only. There is no consideration given to the specific investment needs, objectives, or tolerances of any of the recipients. Additionally, CMG’s actual investment positions may, and often will, vary from its conclusions discussed herein based on any number of factors, such as client investment restrictions, portfolio rebalancing, and transaction costs, among others. Recipients should consult their own advisors, including tax advisors, before making any investment decision. This material is for informational and educational purposes only and is not an offer to sell or the solicitation of an offer to buy the securities or other instruments mentioned. This material does not constitute a personal recommendation or take into account the particular investment objectives, financial situations, or needs of individual investors which are necessary considerations before making any investment decision. Investors should consider whether any advice or recommendation in this research is suitable for their particular circumstances and, where appropriate, seek professional advice, including legal, tax, accounting, investment, or other advice. The views expressed herein are solely those of Steve Blumenthal as of the date of this report and are subject to change without notice.
Investing involves risk.
This letter may contain forward-looking statements relating to the objectives, opportunities, and future performance of the various investment markets, indices, and investments. Forward-looking statements may be identified by the use of such words as; “believe,” anticipate,” “planned,” “potential,” and other similar terms. Examples of forward-looking statements include, but are not limited to, estimates with respect to financial condition, results of operations, and success or lack of success of any particular market, index, investment, or investment strategy. All are subject to various factors, including, but not limited to, general and local economic conditions, changing levels of competition within certain industries and markets, changes in legislation or regulation, Federal Reserve policy, and other economic, competitive, governmental, regulatory, and technological factors affecting markets, indices, investments, investment strategy and portfolio positioning that could cause actual results to differ materially from projected results. Such statements are forward-looking in nature and involve a number of known and unknown risks, uncertainties, and other factors, and accordingly, actual results may differ materially from those reflected or contemplated in such forward-looking statements. Investors are cautioned not to place undue reliance on any forward-looking statements or examples. All statements made herein speak only as of the date that they were made. Investing is inherently risky and all investing involves the potential risk of loss.
Past performance does not guarantee or indicate future results. Different types of investments involve varying degrees of risk, and there can be no assurance that the future performance of any specific investment, investment strategy, or product (including the investments and/or investment strategies recommended or undertaken by CMG), or any non-investment related content, made reference to directly or indirectly in this commentary will be profitable, equal any corresponding indicated historical performance level(s), be suitable for your portfolio or individual situation or prove successful. Due to various factors, including changing market conditions and/or applicable laws, the content may no longer be reflective of current opinions or positions. Moreover, you should not assume that any discussion or information contained in this commentary serves as the receipt of, or as a substitute for, personalized investment advice from CMG. Please remember to contact CMG, in writing, if there are any changes in your personal/financial situation or investment objectives for the purpose of reviewing/evaluating/revising our previous recommendations and/or services, or if you would like to impose, add, or to modify any reasonable restrictions to our investment advisory services. Unless, and until, you notify us, in writing, to the contrary, we shall continue to provide services as we do currently. CMG is neither a law firm, nor a certified public accounting firm, and no portion of the commentary content should be construed as legal or accounting advice.
No portion of the content should be construed as an offer or solicitation for the purchase or sale of any security. References to specific securities, investment programs or funds are for illustrative purposes only and are not intended to be, and should not be interpreted as recommendations to purchase or sell such securities.
This presentation does not discuss, directly or indirectly, the amount of the profits or losses realized or unrealized, by any CMG client from any specific funds or securities. Please note: In the event that CMG references performance results for an actual CMG portfolio, the results are reported net of advisory fees and inclusive of dividends. The performance referenced is that as determined and/or provided directly by the referenced funds and/or publishers, has not been independently verified, and does not reflect the performance of any specific CMG client. CMG clients may have experienced materially different performance based upon various factors during the corresponding time periods. See in links provided citing limitations of hypothetical back-tested information. Past performance cannot predict or guarantee future performance. Not a recommendation to buy or sell. Please talk to your advisor.
Information herein has been obtained from sources believed to be reliable, but we do not warrant its accuracy. This document is general communication and is provided for informational and/or educational purposes only. None of the content should be viewed as a suggestion that you take or refrain from taking any action nor as a recommendation for any specific investment product, strategy, or other such purposes.
In a rising interest rate environment, the value of fixed-income securities generally declines, and conversely, in a falling interest rate environment, the value of fixed-income securities generally increases. High-yield securities may be subject to heightened market, interest rate, or credit risk and should not be purchased solely because of the stated yield. Ratings are measured on a scale that ranges from AAA or Aaa (highest) to D or C (lowest). Investment-grade investments are those rated from highest down to BBB- or Baa3.
NOT FDIC INSURED. MAY LOSE VALUE. NO BANK GUARANTEE.
Certain information contained herein has been obtained from third-party sources believed to be reliable, but we cannot guarantee its accuracy or completeness.
In the event that there has been a change in an individual’s investment objective or financial situation, he/she is encouraged to consult with his/her investment professional.
Written Disclosure Statement. CMG is an SEC-registered investment adviser located in Malvern, Pennsylvania. Stephen B. Blumenthal is CMG’s founder and CEO. Please note: The above views are those of CMG and its CEO, Stephen Blumenthal, and do not reflect those of any sub-advisor that CMG may engage to manage any CMG strategy, or exclusively determines any internal strategy employed by CMG. A copy of CMG’s current written disclosure statement discussing advisory services and fees is available upon request or via CMG’s internet web site at www.cmgwealth.com/disclosures. CMG is committed to protecting your personal information. Click here to review CMG’s privacy policies.
See CMG Disclosures at the bottom of this page.
For more information about NDR, please visit at www.ndr.com.
NDR, Inc. (NDR), d.b.a. Ned Davis Research Group (NDRG), any NDRG affiliates or employees, or any third-party data provider, shall not have any liability for any loss sustained by anyone who has relied on the information contained in any NDRG publication. The data and analysis contained herein are provided "as is." NDRG disclaims any and all express or implied warranties, including, but not limited to, any warranties of merchantability, suitability or fitness for a particular purpose or use. NDRG's past recommendations and model results are not a guarantee of future results. This communication reflects our analysts' opinions as of the date of this communication and will not necessarily be updated as views or information change. All opinions expressed herein are subject to change without notice. NDRG or its affiliated companies or their respective shareholders, directors, officers and/or employees, may have long or short positions in the securities discussed herein and may purchase or sell such securities without notice. For NDRG's important additional disclaimers, refer to www.ndr.com/invest/public/copyright.html. Further distribution prohibited without prior permission. Copyright 2025 © NDR, Inc. All rights reserved.