On My Radar: Cycles, Concentration, and Consequences

May 22, 2026
By Steve Blumenthal
“What the wise man does in the beginning, the fool does in the end.”
— Warren Buffett
A lot is going on this week. I want to begin by summarizing what I see as the top-down major macroeconomic issues we are facing today. I’m constantly saying to clients, “I pray I’m wrong, I fear I’m right.” The objective is to handicap the risk, probability, and position wealth to perform well regardless of whether I am right or wrong. Keep that in the back of your mind as you read on.
The Big Picture - State of Play
Three major macroeconomic themes are reshaping the global economy: deglobalization, electrification, and redistribution. There will be investment winners in the decade ahead. I believe AI will absolutely be one of them. But there is another side to the story, and it deserves careful attention.
The U.S. stock market today is historically expensive, heavily leveraged, and dangerously concentrated. We should be on high alert. This is a historically vulnerable setup that has preceded other secular bull market tops. Yet, the trend in stock prices has been bullish, and based on the charts I post in Trade Signals, the evidence remains bullish.
Expensive, leveraged, and overconcentrated:
The Buffett Indicator is at a record 222% total stock market cap to nominal GDP
Margin debt is a record $1.3 trillion
43% of the S&P 500 sits in just two sectors: Information Technology and Communication Services
What struck me this week was looking back at the last great commodity bull market peak in 1980–1981. Back then, the setup was almost the exact opposite of today.
At the top of that cycle:
Energy represented roughly 25%–30% of the S&P 500
Materials represented another 10%–12%
Combined, Energy and Materials approached nearly 40% of the index
Technology barely registered at roughly 3%–6%
Today, Energy and Materials combined represent only about 6% of the index. The pendulum has swung the other way completely. Technology and Communication Services dominate market leadership, while hard assets, commodities, and inflation beneficiaries have become an afterthought. Commodity hedge fund exposure today is close to nonexistent.
Markets move in long cycles. Leadership rotates. Capital rotates.
And the biggest secular investment opportunities often emerge where investors have the least exposure.
My concern is not simply valuation. It is the interaction between valuation, leverage, concentration, and human behavior.
Baby boomers, who can least afford a major drawdown, are heavily exposed to equities. Foreign ownership of U.S. equities is near record highs. Everyone is crowded onto the same side of the boat. Markets have a way of humbling consensus trades.
If technology leadership begins to normalize and valuation multiples compress, the capital rotation could be measured not in billions, but trillions.
Today, Technology and Communication Services represent roughly 43% of the $66 trillion U.S. equity market. If that weighting were to revert to a more historically normal 25%, it would imply a shift of roughly 18% in the $66 trillion or ~ $10 trillion. Source, Source
Of course, some of that money will be lost, but the selling will create an enormous amount of money that will be looking for a new home.
The so-called Buffett Ratio, named after Warren Buffett, reflects the total U.S. stock market capitalization relative to GDP, and currently sits at a record high 222%. For perspective, it stood near 70% at the top of the secular bull market in 1966, 68% before the 1987 crash, 170% at the peak of the dot-com bubble in 2000, and 125% before the 2008 Global Financial Crisis (blue line in chart). To me, the important takeaway is the distance between the current level and the dotted uptrending line. Think of the dotted line as a good fair value level for the market, but notice that when markets mean-revert, they tend to drop well below the dotted line. That’s leverage unwinding and buyers having little desire to buy.
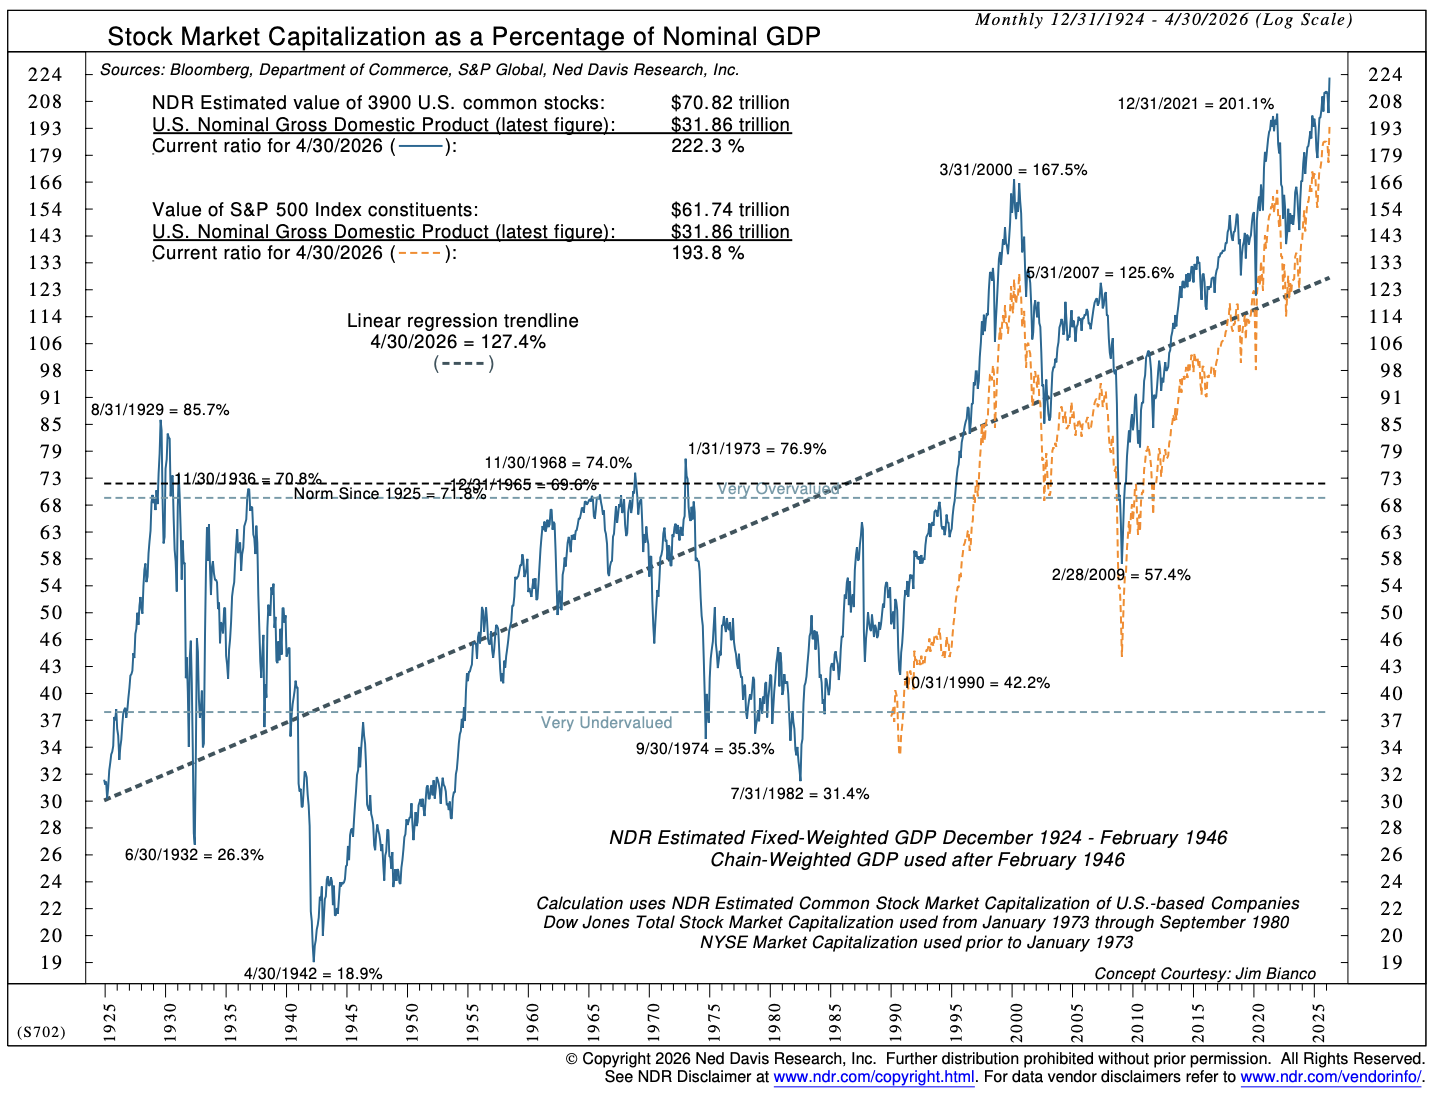
Source: NDR
Today’s reading is the highest in history.
Paul Tudor Jones recently framed the risk this way: when market capitalization reaches these extremes relative to GDP, even a “normal” valuation reset can have massive economic consequences. Historically, major bear markets often see declines near 35%. They tend to happen in recessions. As Dr. Lacy Hunt pointed out recently (here), recessions tend to follow oil price shocks by 5-6 months. That points to the August/September time frame.
A 35% decline in the U.S. stock market today would erase approximately $23 trillion in wealth. Given record-high market leverage, a 50% decline is possible.
Think about that for a moment.
The reverse wealth effect would be profound. Consumer confidence weakens. Spending slows. Capital gains tax revenues evaporate just as government deficits continue to explode.
And this is occurring near the end of what many macro thinkers, including Ray Dalio, describe as an 80-year debt supercycle.
Approximately 26% of U.S. federal debt matures within one year. As that debt rolls over at higher interest rates, interest expense surges. Annual federal interest costs are now running near $1.25 trillion, consuming roughly 25% of government receipts. Source, Source
That trajectory is not sustainable indefinitely.
Historically, policymakers have responded by increasing liquidity creation, increasing debt monetization, and printing more money. That may temporarily support financial assets, but it also risks sustaining inflationary pressures and keeping upward pressure on long-term interest rates. The probable outcome is inflation/stagflation. Inflation and higher interest rates lead to weaker economic growth.
Which brings me back to commodities.
In my view, a new commodity supercycle was already forming before the closure of the Strait of Hormuz added a geopolitical security premium to energy markets. That premium is unlikely to prove transitory. Brent crude appears poised for a structural breakout, not simply a temporary spike.
And that may ultimately lead to a very different set of market winners in the decade ahead than the ones that dominated the last ten years.
Secular Cycles
Throughout history, markets have moved from bull to bear to bull. The long-term cycles are called secular cycles, and the short-term bull-bear cycles are called cyclical cycles.
The following from NDR details the stock market in the upper section, the bond market in the middle section (though I think they are wrong in that the bond bear started in 2020), and the commodity market in the lower section:
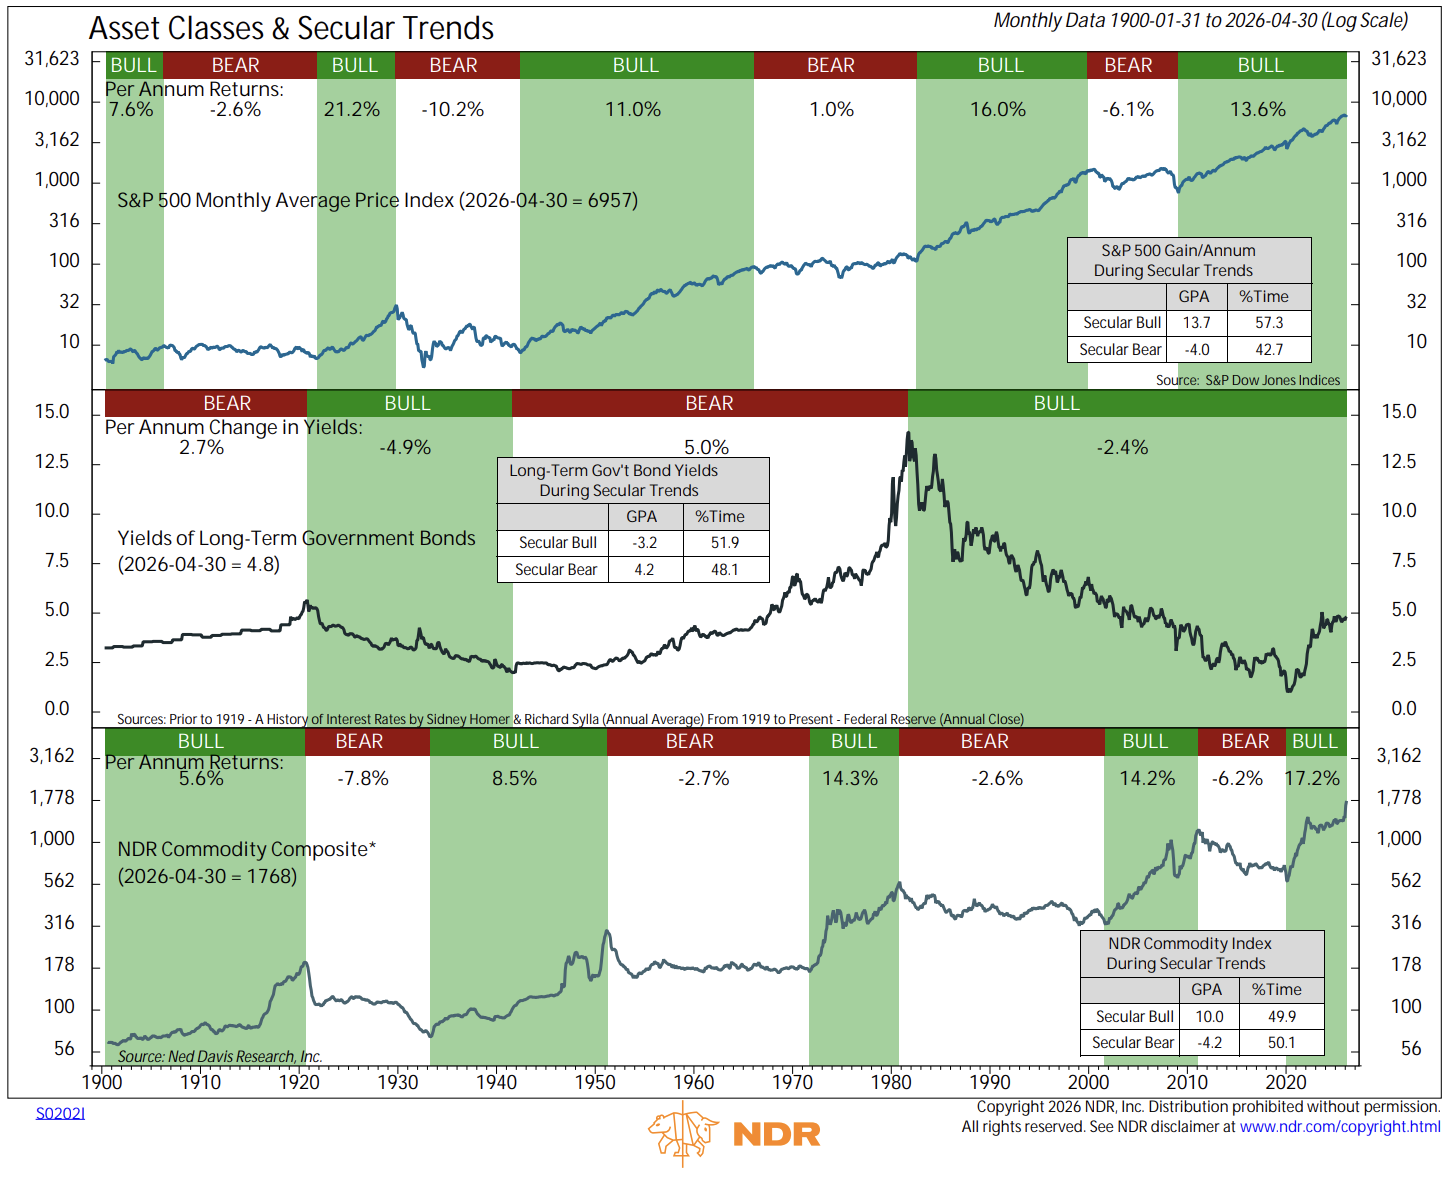
Source: NDR
I hear you, “what about AI?”
AI is a game-changer for productivity and growth. I’m not saying don’t own it. I’m saying hedge it here, and own it long-term. Sized in an appropriate way suitable to your needs, goals, and time horizon.
Be in a position to take advantage of the opportunity a 30%–50% stock market correction creates.
I’m simply saying, be aware of the enormity of the current risk. Be aware of human behavior and the emotional swings between greed and fear. And when the time comes, be prepared to seize the day!
Said differently, sell and/or hedge greed. Buy fear. You’ll know it when it presents. You’ll probably feel fearful yourself. I know I will, and that’s the point of opportunity.
Grab your coffee and find your favorite chair. I realize the above is a lot to digest, but stick with me here. My dear friend Barry Habib presented at the Mauldin Economics’ Strategic Investment conference earlier this month. Barry is my go-to for all things real estate and mortgage rates. Barry is the founder of MBS Highway, a Fannie Mae board member, and a four-time winner of Zillow’s Crystal Ball Award for the most accurate real estate forecast among 150 economists. He didn’t disappoint. Go grab a second cup of coffee, and let’s go!
On My Radar:
Personal Note: To Love The Game
OMR is for informational and educational purposes only. No consideration is given to your specific investment needs, objectives, or tolerances.
Please see the Important Disclosures at the bottom of this page. Reminder: This is not a recommendation to buy or sell any security. My views may change at any time. The information is for discussion and educational purposes only.
If you like what you are reading, you can subscribe for free.

Barry Habib on Housing, Mortgage Rates, and Macro Outlook
Following is my bullet-point summary of Barry Habib's SIC May 11, 2026, presentation:
Oil & Iran
The US-Iran peace proposal was rejected; the Strait of Hormuz remains a critical flashpoint
20% of the world's oil supply has effectively come off the market
Iran is losing an estimated $4–5 billion per week, but has historically shown a high tolerance for pain
Iran's onshore and offshore oil storage is nearing capacity, which may force a deal or well shutdowns (which damage production capacity and take months to restore)
The key question: does elevated oil lead to inflation (rates stay higher) or recession (rates come down)?
History is clear: every time WTI oil prices have doubled in a short period, a recession has followed. With WTI near $117 at peak (vs. $67 pre-war), that signal is flashing
On Inflation
Barry's forecast for April CPI: 3.7% headline, 2.6% core — a significant jump (SB here: inflation came in at 3.8% the week after Barry’s presentation. He nailed it.)
The shelter component (44% of core CPI) is actually helping keep the inflation number down. Real-world rents are rising at roughly 1%, while the BLS is reporting 3%, using methodology unchanged since 1985
Tariffs are a one-time price adjustment, not cumulative inflation, so their year-over-year effect will fade, reducing reported inflation by roughly 0.3%
The Fed's December QE ($40B/month in short-term Treasuries) expanded the money supply by over 9% while output grew ~1.5%. This is the classic too-many-dollars-chasing-too-few-goods = inflation.
True underlying inflation, stripping out shelter lag and tariff distortions, is likely closer to 2.5%
Base case: inflation settles near 3% once oil normalizes and shelter continues declining. Still this is above the Fed's 2% target
The Labor Market
Initial jobless claims look benign, but the numbers are misleading because the gig economy (Uber, DoorDash, Instacart) allows displaced workers to generate income without filing claims
ADP job creation is barely above zero; The BLS numbers are wildly unreliable. 2025 initial BLS reports showed 1.7M jobs created; the QCEW (98% accuracy) revised that to 123,000, resulting in a BLS report error of 93%. As you can see, we cannot rely on the BLS numbers
Barry's unemployment forecast: rises to 4.6% from 4.3% today
The Fed & Interest Rates
New Fed Chair Kevin Warsh is likely to be more forward-looking than Powell. Barry believes Warsh may shift focus to the Dallas Fed Trimmed Mean (which strips out the highest 31% and lowest 24% of price changes) for a cleaner inflation read. (SB: Keep your eye on the Dallas Fed Trimmed Mean report)
Barry's view: two quarter-point cuts over the next 12 months, bringing Fed funds to ~3.125% (SB: note this is counter to the most recent consensus, which went from rate cuts to a small probability of a rate increase.)
The bond market moves when the Fed telegraphs, not on the day of the cut. He noted that this is important for timing
The name Barry mentioned is Nick Timiraos, who's the chief economics correspondent at The Wall Street Journal. Habib referred to him as the Fed's go-to for telegraphing policy moves to the market before official announcements
Barry shared that Treasury Secretary Scott Bessent's private target for the 10-year Treasury is 3.9% (it’s at 4.60% today)
Barry's target low is 4.0%
Bessent has the flexibility to term government debt (refinancing and issuing new debt) at shorter maturities, which he said could help keep the 10-year yield contained. (SB: This will be problematic if inflation runs higher and longer than expected. It will be hard for Warsh to keep short-duration Treasury Bill rates low without some form of interest-rate control (which would be very bad for markets and inflationary).
Key thing to watch: bond investors revolting, refusing to buy, and selling their longer-duration Treasury holdings)
Mortgage Rates
The mortgage spread (30-year fixed vs. 10-year Treasury) has returned to a normal ~2%
If the 10-year reaches 4% and the spread narrows slightly to 1.9%, that puts 30-year fixed mortgages at roughly 5.9–6.125%, which is Barry's target low range
His advice: if you see mortgage rates in the 5.9–6.125% range, lock in
Housing
Home price forecast: A gain of ~3%, which is roughly in line with consensus, he sees higher appreciation if rates decline
Supply is constrained. Builders have pulled back and won't be able to ramp quickly if demand spikes on lower rates, supporting prices
Existing home sales have been flat for four years but prices keep rising. Supply/demand imbalance remains the dominant force
He also touched on something few real estate experts focus on - household formation units. Here is what he said:
The US was averaging 1.8 million household formations per year
When mortgage rates spiked, demand froze — "deer in the headlights" — creating pent-up demand
That demand is now bouncing back toward historical norms, which he viewed as a positive for the demand side of housing
Supply vs Demand
Builders got smart and pulled back supply to match the slowdown in demand. They weren't going to carry vacant inventory at high cost
The problem: if rates drop and demand spikes back up, builders cannot instantaneously respond, as it takes time to build homes
That lag between demand recovery and supply response is what creates the price appreciation opportunity
State-level inventory:
Texas and Florida show significantly more inventory relative to pre-pandemic levels, but he noted that's been largely offset by migration into those states, so it looks worse than it is
The potential setup:
Demand recovering toward 1.8M household formations + constrained supply + potential rate decline means that prices are likely biased to the upside
His core point: without a meaningful surge in new supply, the slight imbalance favoring demand should keep home prices supported. The 3% appreciation forecast could move higher if rates cooperate
He noted that real estate has posted positive gains 79 of the last 84 years
The wealth argument: homeowners have a net worth 44x that of renters; he said that two-thirds of American net worth comes from home equity
The leverage math: a 3% appreciation on a $600K home (with $60K down) equals a 30% return on invested capital, which far exceeds stock market gains on an unleveraged basis
Bottom Line from Barry: The oil situation is the wildcard factor for everything: rates, inflation, recession risk, and housing. If it resolves, the path to lower rates and higher home values is clear. If it persists, stagflation risk grows.
Either way, housing supply remains tight, the labor market is weaker than headlines suggest, and the new Fed leadership under Warsh may prove more disciplined and consistent than its predecessors.
You can view the Mauldin Economics 2026SIC agenda and subscribe to view the recordings here. (Please know, I am not compensated in any way. Just a big fan.)
Opinions are subject to change. Not a recommendation to buy or sell any security. Please note that the information provided is not recommended for buying or selling any security and is provided for discussion purposes only.
* No guarantees; all investing involves risk. Views are subject to change. TRADE SIGNALS SUBSCRIPTION ACKNOWLEDGEMENT / IMPORTANT DISCLOSURES
As always, this is not investment advice. For discussion purposes only. Reach out to us if you have any questions.
Views are subject to change. Not a recommendation to buy or sell any security. Please note that the information provided is not recommended for buying or selling any security and is provided for discussion purposes only. Current viewpoints are subject to change. Please note that the information provided is not recommended for buying or selling any security and is provided for discussion purposes only. See important CMG disclosures below.
If you like what you are reading, click on the link and share it with a friend (it’s free).
CLICK HERE TO SUBSCRIBE TO ON MY RADAR - IT’S FREE
Not a recommendation to buy or sell any security. Please note that the information provided is not intended to recommend buying or selling any security and is for discussion purposes only. Current viewpoints are subject to change. Please note that the information provided is not recommended for buying or selling any security and is provided for discussion purposes only.
Trade Signals: May 21, 2026 Update
Market Commentary
Here’s the weekly recap through Thursday:
Stocks - Another volatile but ultimately flat week for equities. The S&P 500 snapped a three-day losing streak on Wednesday, while Thursday saw the rally continue modestly and the Dow Industrials close at another all-time high.
The big catalyst midweek was another monster earnings report from NVIDIA. The company reported adjusted earnings per share of $1.87 on revenue of $81.6 billion, up 85% year-over-year and well ahead of Wall Street expectations. Source: Investors
The market’s reaction, however, was muted. That tells us something important. Investors are increasingly focused less on earnings and more on macro risks: inflation, interest rates, deficits, and the Middle East.
Bonds - The bond market remained the dominant story this week.
The 10-year Treasury yield surged toward the 4.6%–4.7% area earlier in the week, reaching its highest level in roughly a year before easing modestly into Thursday, near 4.58%–4.62%. Source: MarketWatch
That move rattled equity markets. Higher yields act like gravity on richly valued assets, particularly long-duration growth stocks. The pressure eased somewhat late in the week as headlines suggested progress toward a possible ceasefire or negotiated settlement with Iran.
Still, the message from the bond market remains clear: inflation risk and fiscal concerns are not going away.
Gold - Gold consolidated this week after a massive run higher over the past year. Prices remain elevated despite some near-term profit taking.
The important point is this: gold is no longer trading purely as an inflation hedge. It is increasingly trading as a confidence hedge against deficits, debt monetization, geopolitical instability, and central bank credibility.
The long-term trend remains higher in my view.
Oil & Commodities - Oil and commodity markets were driven almost entirely by geopolitical headlines.
Midweek, crude prices declined as optimism grew around a possible U.S.-Iran agreement. President Trump told reporters negotiations were in the “final stages,” temporarily easing fears around the Strait of Hormuz.
Then came Thursday’s uranium-related directive headlines, and oil reversed sharply higher.
Bottom line: oil is currently trading on a headline-to-headline basis. That makes short-term positioning exceptionally difficult. But stepping back, the bigger picture remains important: the geopolitical security premium in energy is no longer negligible.
And if the Strait of Hormuz remains unstable, the inflation implications become significant very quickly.
Fed - Fed policy expectations quietly shifted this week.
Recent FOMC minutes showed policymakers remain concerned that inflation could stay above target longer than markets expect. Several participants reportedly pushed back against maintaining any perception of an easing bias.
Markets are still pricing the Fed largely on hold, but rate-cut expectations continue to fade. Meanwhile, the probability of an additional rate hike later this year has increased materially versus just a few weeks ago. (Reuters)
The important takeaway: the Fed is no longer talking like a central bank preparing to ease aggressively. Inflation and energy risks have changed the tone.
Bottom line: The Iran conflict continues to drive nearly every major asset class. Bond yields remain elevated and breaking higher, oil is headline-sensitive and volatile, gold is consolidating near historically high levels, and the Fed’s tone has become noticeably more hawkish.
The market remains highly dependent on geopolitical outcomes. The yield on longer-dated Treasurys is likely the match that lights the fuse, forcing a repricing of markets.
That’s worth watching closely.
The Dashboard of Indicators follows next.
Trade Signals - subscribers only
The Indicators Dashboard - Stocks, Investor Sentiment, Bonds, Commodities, Currencies, and Gold
Valuations and Subsequent 10-year Returns
Supporting Charts with Explanations
About Trade Signals - Trade Signals is a paid subscription service that posts the daily, weekly, and monthly trends in the markets (and more). Free for CMG clients. Not a recommendation to buy or sell any security. For discussion purposes only.
“Extreme patience combined with extreme decisiveness. You may call that our investment process. Yes, it’s that simple.” – Charlie Munger

TRADE SIGNALS SUBSCRIPTION ACKNOWLEDGEMENT / IMPORTANT DISCLOSURES
The views expressed herein are solely those of Steve Blumenthal as of the date of this report and are subject to change without notice. Not a recommendation to buy or sell any security.
Please note that the information provided is not recommended for buying or selling any security and is provided for discussion purposes only. Current viewpoints are subject to change. Please note that the information provided is not recommended for buying or selling any security and is provided for discussion purposes only.
Personal Note: To Love The Game
“To know the game is great.
To play the game is greater.
But to love the game is the greatest of all.”
- Author Unknown
The Palestra is one of the most iconic arenas in American sports history. Opened in 1927, it is Penn basketball's home court and is widely known as “The Cathedral of College Basketball.”
There’s something special about walking into the Palestra. The old cathedral of college basketball. You can almost feel the echoes in the walls: sneakers squeaking, bands blaring, generations of players chasing something bigger than themselves.
Susan and I attended a Cornell v Penn lacrosse game a few weeks ago, and outside the stadium (Franklin Field), just next to the Palestra, sits a plaque with the above quote.
That feels true well beyond sports.
The best athletes I’ve known weren’t always the most gifted. They were the ones who simply loved the game. They loved the early mornings, the bus rides, the practices nobody remembers, and the chance to compete one more time. Win or lose, they kept showing up.
I’ve seen it standing on soccer sidelines with Susan. I’ve seen it in young players learning confidence through teamwork and older players refusing to let age take away their joy for competition. The love of the game becomes something deeper than the scoreboard.
Maybe that’s one of life’s great lessons.
Love what you do. Love the preparation. Love the process. Love the people beside you on the journey.
Because eventually the trophies collect dust, the crowds go quiet, and the final score fades away.
But the love of the game? That stays with you forever.
And speaking of basketball, the NY Knicks destroyed my Philadelphia 76ers and are now up two games against the Cleveland Cavaliers. The Knicks are undefeated in the playoffs, and I must admit (don’t tell my kids), I’m pulling for them to go all the way. They are an exceptionally fun team to watch. “Love the people beside you on the journey.” You can see it amongst the players.
I hope this weekend finds you spending time with your loved ones. Rain and 60 degrees are in the weekend forecast. I’ve moved Saturday golf to Sunday afternoon. I see exercise, a long walk with Susan, and a cold IPA in the immediate future.
Wishing you a wonderful Memorial Day Weekend.
Steve
CLICK HERE TO SUBSCRIBE TO ON MY RADAR - IT’S FREE
You can share this letter on X by clicking here.
You can share this letter on LinkedIn by clicking here.
Subscribe to OMR for free by clicking the photo.
Stephen B. Blumenthal
Executive Chairman & CIO
CMG Capital Management Group, Inc.
75 Valley Stream Parkway, Suite 201,
Malvern, PA 19355
CMG Customer Relationship Summary (Form CRS)
Metric-Financial, LLC Customer Relationship Summary (Form CRS)

Stephen Blumenthal founded CMG Capital Management Group in 1992 and serves today as its Executive Chairman and CIO. Steve authors a free weekly e-letter entitled, “On My Radar.” Steve shares his views on macroeconomic research, valuations, portfolio construction, asset allocation and risk management. Author of Forbes Book: On My Radar, Navigating Stock Market Cycles.
Follow Steve on X @SBlumenthalCMG and LinkedIn.
IMPORTANT DISCLOSURE INFORMATION
This document is prepared by CMG Capital Management Group, Inc. (“CMG”) and is circulated for informational and educational purposes only. There is no consideration given to the specific investment needs, objectives, or tolerances of any of the recipients. Additionally, CMG’s actual investment positions may, and often will, vary from its conclusions discussed herein based on any number of factors, such as client investment restrictions, portfolio rebalancing, and transaction costs, among others. Recipients should consult their own advisors, including tax advisors, before making any investment decision. This material is for informational and educational purposes only and is not an offer to sell or the solicitation of an offer to buy the securities or other instruments mentioned. This material does not constitute a personal recommendation or take into account the particular investment objectives, financial situations, or needs of individual investors which are necessary considerations before making any investment decision. Investors should consider whether any advice or recommendation in this research is suitable for their particular circumstances and, where appropriate, seek professional advice, including legal, tax, accounting, investment, or other advice. The views expressed herein are solely those of Steve Blumenthal as of the date of this report and are subject to change without notice.
Investing involves risk.
This letter may contain forward-looking statements relating to the objectives, opportunities, and future performance of the various investment markets, indices, and investments. Forward-looking statements may be identified by the use of such words as; “believe,” anticipate,” “planned,” “potential,” and other similar terms. Examples of forward-looking statements include, but are not limited to, estimates with respect to financial condition, results of operations, and success or lack of success of any particular market, index, investment, or investment strategy. All are subject to various factors, including, but not limited to, general and local economic conditions, changing levels of competition within certain industries and markets, changes in legislation or regulation, Federal Reserve policy, and other economic, competitive, governmental, regulatory, and technological factors affecting markets, indices, investments, investment strategy and portfolio positioning that could cause actual results to differ materially from projected results. Such statements are forward-looking in nature and involve a number of known and unknown risks, uncertainties, and other factors, and accordingly, actual results may differ materially from those reflected or contemplated in such forward-looking statements. Investors are cautioned not to place undue reliance on any forward-looking statements or examples. All statements made herein speak only as of the date that they were made. Investing is inherently risky and all investing involves the potential risk of loss.
Past performance does not guarantee or indicate future results. Different types of investments involve varying degrees of risk, and there can be no assurance that the future performance of any specific investment, investment strategy, or product (including the investments and/or investment strategies recommended or undertaken by CMG), or any non-investment related content, made reference to directly or indirectly in this commentary will be profitable, equal any corresponding indicated historical performance level(s), be suitable for your portfolio or individual situation or prove successful. Due to various factors, including changing market conditions and/or applicable laws, the content may no longer be reflective of current opinions or positions. Moreover, you should not assume that any discussion or information contained in this commentary serves as the receipt of, or as a substitute for, personalized investment advice from CMG. Please remember to contact CMG, in writing, if there are any changes in your personal/financial situation or investment objectives for the purpose of reviewing/evaluating/revising our previous recommendations and/or services, or if you would like to impose, add, or to modify any reasonable restrictions to our investment advisory services. Unless, and until, you notify us, in writing, to the contrary, we shall continue to provide services as we do currently. CMG is neither a law firm, nor a certified public accounting firm, and no portion of the commentary content should be construed as legal or accounting advice.
No portion of the content should be construed as an offer or solicitation for the purchase or sale of any security. References to specific securities, investment programs or funds are for illustrative purposes only and are not intended to be, and should not be interpreted as recommendations to purchase or sell such securities.
This presentation does not discuss, directly or indirectly, the amount of the profits or losses realized or unrealized, by any CMG client from any specific funds or securities. Please note: In the event that CMG references performance results for an actual CMG portfolio, the results are reported net of advisory fees and inclusive of dividends. The performance referenced is that as determined and/or provided directly by the referenced funds and/or publishers, has not been independently verified, and does not reflect the performance of any specific CMG client. CMG clients may have experienced materially different performance based upon various factors during the corresponding time periods. See in links provided citing limitations of hypothetical back-tested information. Past performance cannot predict or guarantee future performance. Not a recommendation to buy or sell. Please talk to your advisor.
Information herein has been obtained from sources believed to be reliable, but we do not warrant its accuracy. This document is general communication and is provided for informational and/or educational purposes only. None of the content should be viewed as a suggestion that you take or refrain from taking any action nor as a recommendation for any specific investment product, strategy, or other such purposes.
In a rising interest rate environment, the value of fixed-income securities generally declines, and conversely, in a falling interest rate environment, the value of fixed-income securities generally increases. High-yield securities may be subject to heightened market, interest rate, or credit risk and should not be purchased solely because of the stated yield. Ratings are measured on a scale that ranges from AAA or Aaa (highest) to D or C (lowest). Investment-grade investments are those rated from highest down to BBB- or Baa3.
NOT FDIC INSURED. MAY LOSE VALUE. NO BANK GUARANTEE.
Certain information contained herein has been obtained from third-party sources believed to be reliable, but we cannot guarantee its accuracy or completeness.
In the event that there has been a change in an individual’s investment objective or financial situation, he/she is encouraged to consult with his/her investment professional.
Written Disclosure Statement. CMG is an SEC-registered investment adviser located in Malvern, Pennsylvania. Stephen B. Blumenthal is CMG’s founder and CEO. Please note: The above views are those of CMG and its CEO, Stephen Blumenthal, and do not reflect those of any sub-advisor that CMG may engage to manage any CMG strategy, or exclusively determines any internal strategy employed by CMG. A copy of CMG’s current written disclosure statement discussing advisory services and fees is available upon request or via CMG’s internet web site at www.cmgwealth.com/disclosures. CMG is committed to protecting your personal information. Click here to review CMG’s privacy policies.
See CMG Disclosures at the bottom of this page.
For more information about NDR, please visit at www.ndr.com.
NDR, Inc. (NDR), d.b.a. Ned Davis Research Group (NDRG), any NDRG affiliates or employees, or any third-party data provider, shall not have any liability for any loss sustained by anyone who has relied on the information contained in any NDRG publication. The data and analysis contained herein are provided "as is." NDRG disclaims any and all express or implied warranties, including, but not limited to, any warranties of merchantability, suitability or fitness for a particular purpose or use. NDRG's past recommendations and model results are not a guarantee of future results. This communication reflects our analysts' opinions as of the date of this communication and will not necessarily be updated as views or information change. All opinions expressed herein are subject to change without notice. NDRG or its affiliated companies or their respective shareholders, directors, officers and/or employees, may have long or short positions in the securities discussed herein and may purchase or sell such securities without notice. For NDRG's important additional disclaimers, refer to www.ndr.com/invest/public/copyright.html. Further distribution prohibited without prior permission. Copyright 2025 © NDR, Inc. All rights reserved.