September 4, 2026
By Steve Blumenthal
“Listening is where love begins: listening to ourselves and then to our neighbors.”
— Fred Rogers
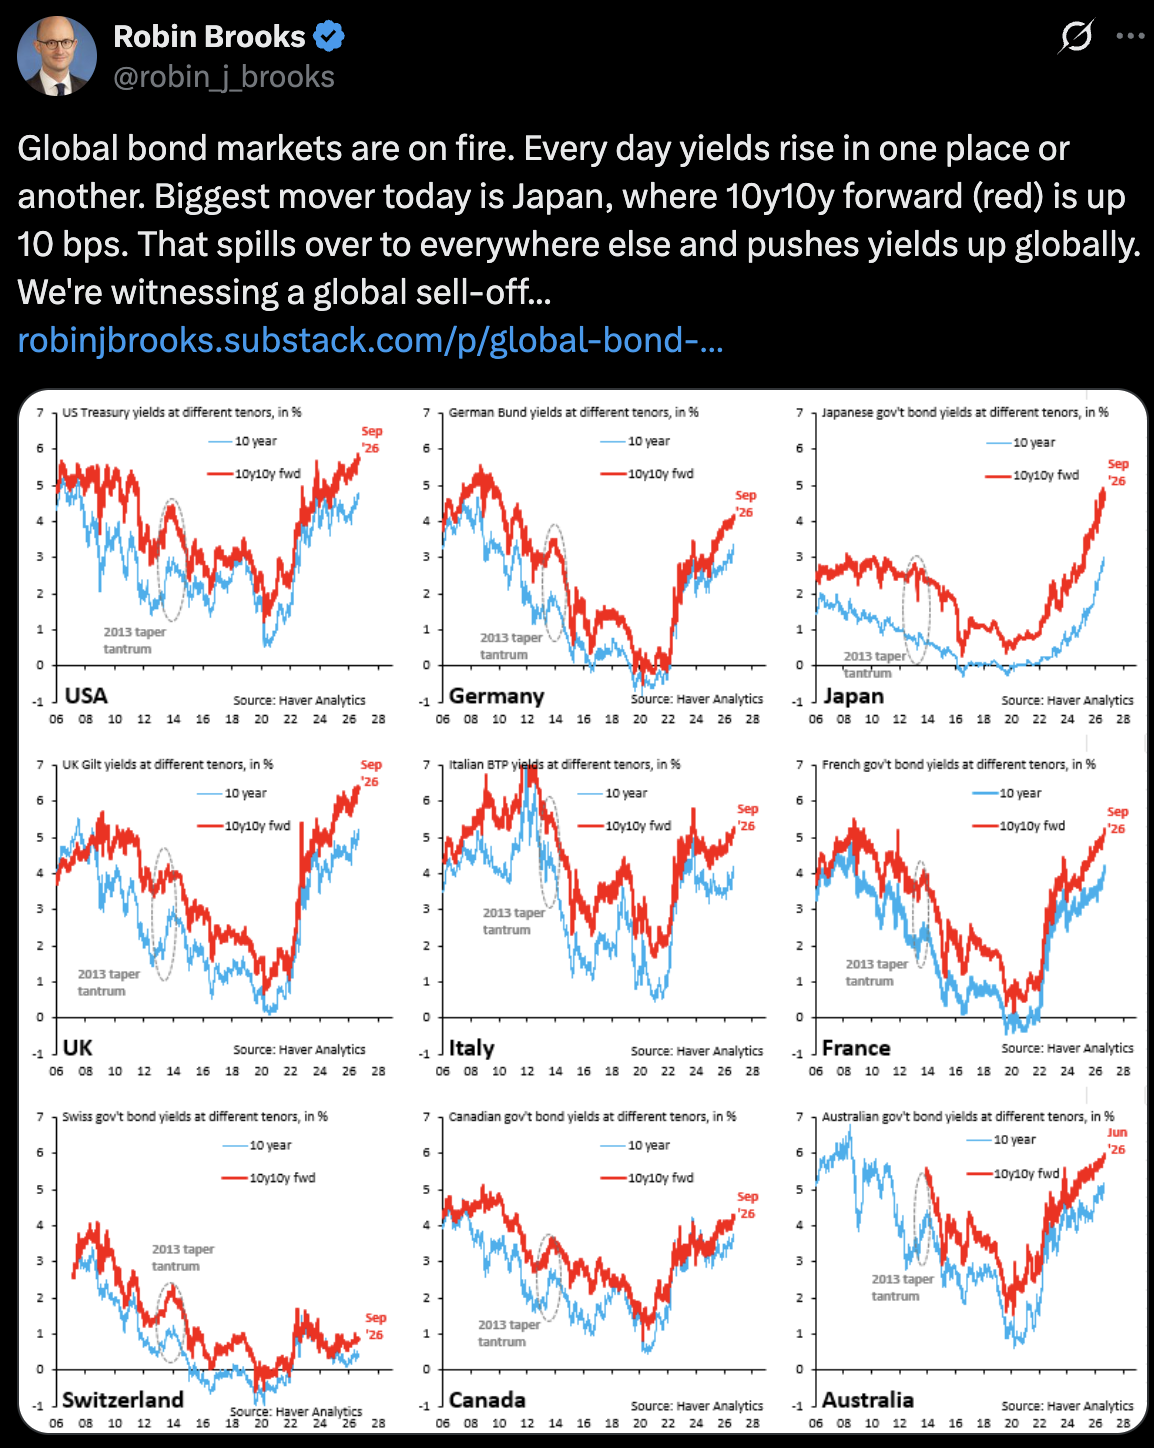
Grab your coffee, find your favorite chair — today's post is a quick one. You'll find two of my favorite valuation charts, and I'll walk you through how to read them in plain English. Bond yields are also climbing across the globe, worth watching as we head into September and October, historically the market's two toughest months. Buckle up.
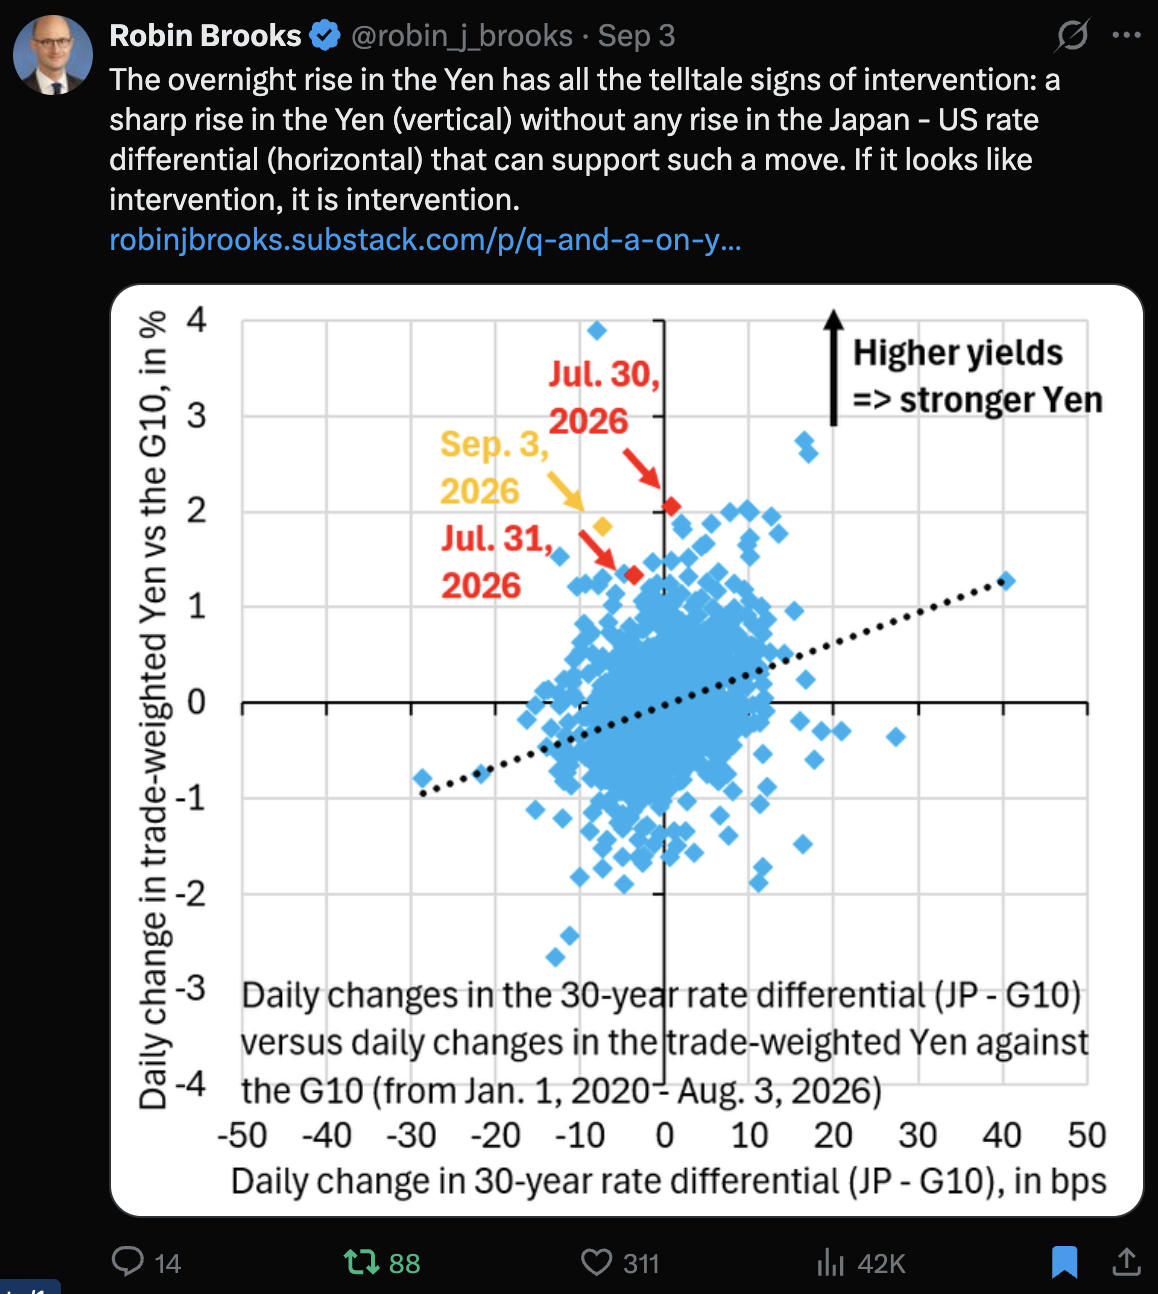
There was also an apparent massive intervention this week to push the yen higher. More on that below, and what it could mean for the yen carry trade.
On My Radar: Mr. Rogers’ 10-Seconds
Valuations and Forward Returns
Several Interesting Charts
The Great Powers Index - Ray Dalio
Trade Signals: September 3, 2026
Personal Note: Mr. Rogers’ 10-Seconds
OMR is for informational and educational purposes only. No consideration is given to your specific investment needs, objectives, or tolerances.
Please see the Important Disclosures at the bottom of this page. Reminder: This is not a recommendation to buy or sell any security. My views may change at any time. The information is for discussion and educational purposes only.
If you like what you are reading, you can subscribe for free.

Valuations and Forward Returns
We’ll take a broader look at current valuations and what that may mean for future returns after quarter-end. Today, let’s look at two.
S&P 500 Index Trend Channel Chart
First, some general understanding: History doesn’t repeat exactly, but markets often follow similar patterns. Looking at those past patterns can help us understand where we may be in a long-term market cycle.
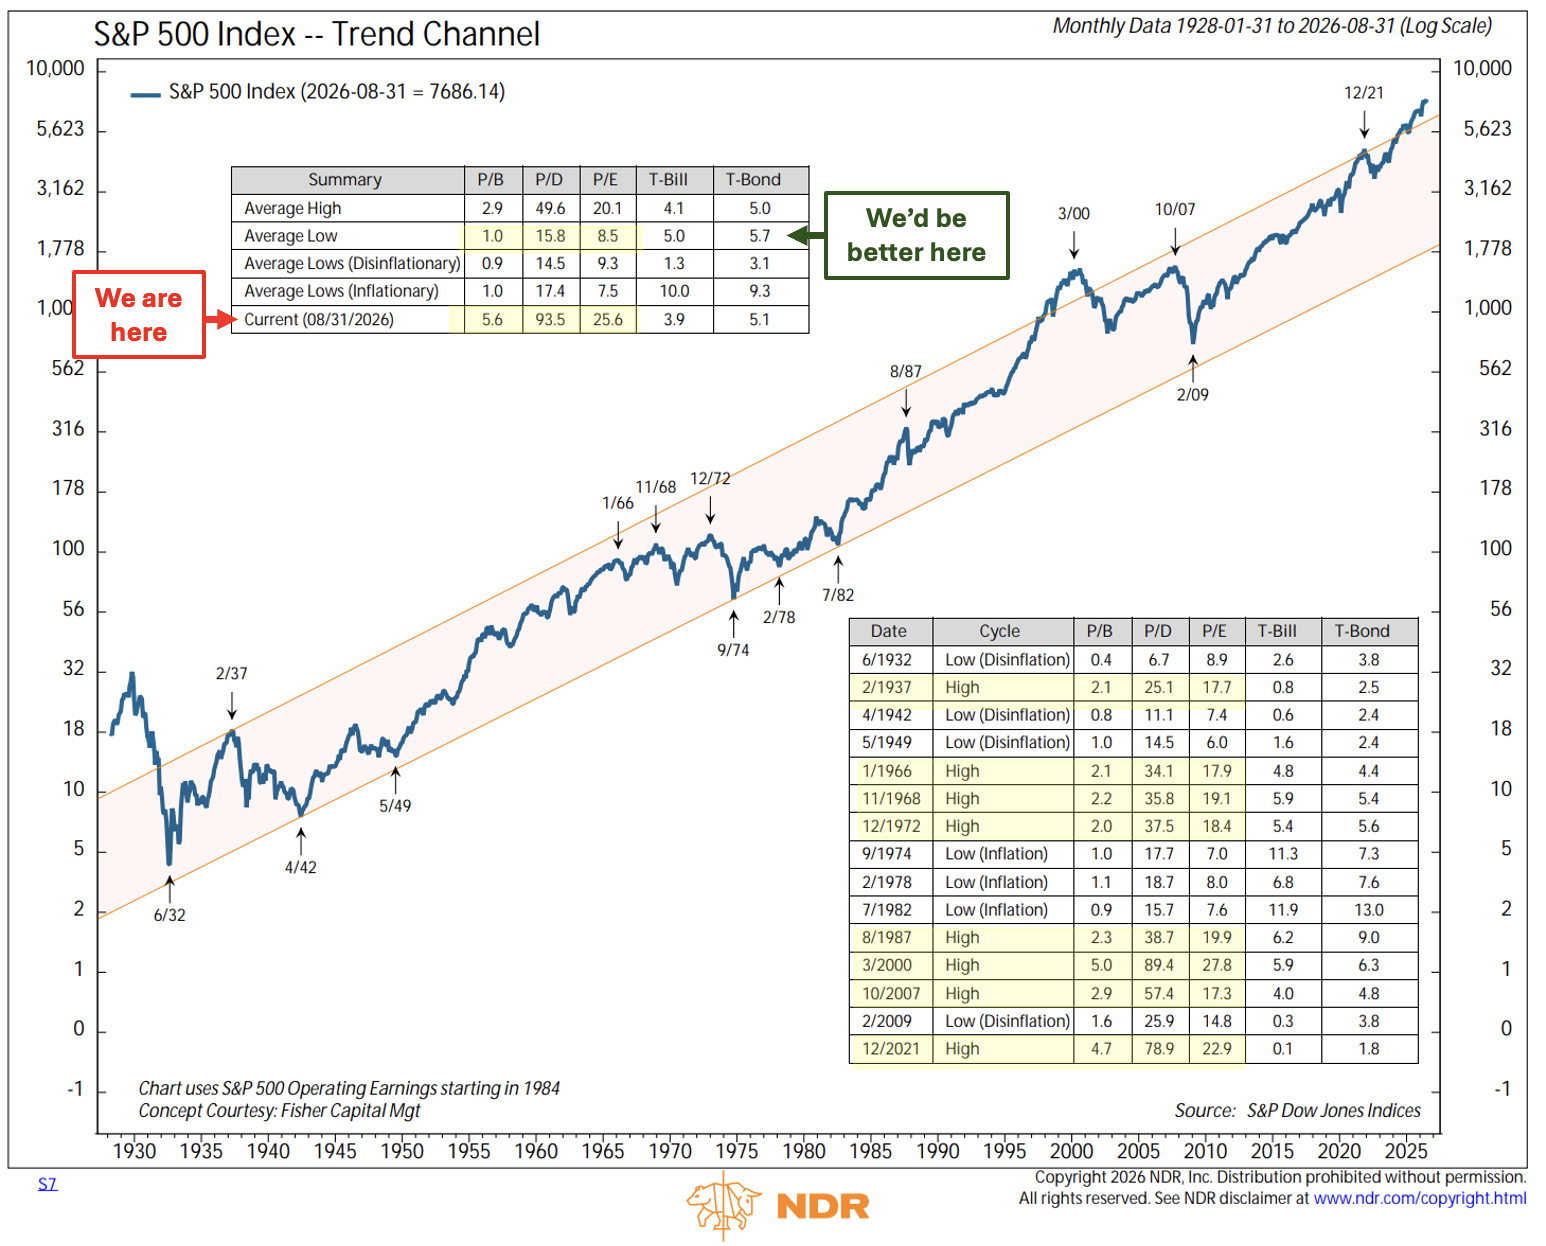
The first chart (S7) shows the S&P 500 going all the way back to early 1928. The two long-term trend lines create a broad “channel” that has historically marked the market's upper and lower boundaries.
Think of the channel as guardrails. When the S&P 500 approaches the upper boundary, the market has historically been expensive and potentially overextended. When it falls toward or below the lower boundary, stocks have generally been inexpensive and potentially oversold. As the letters on the chart show, some of the market’s biggest valuation extremes occurred near these boundaries.
The takeaway is simple: where the market sits within its long-term historical range can provide useful perspective on whether stocks may be unusually expensive, unusually cheap, or somewhere in between.
Here’s how to view the chart:
This analysis looks at three popular valuation metrics: Price to Book (P/B), Price to Dividend (P/D), and Price to Earnings (P/E)
The middle section (peach color) plots the long-term trend channel and arrows to prior cyclical trend high points and low points.
The bottom-right plot shows the various valuation levels at the high and low dates. Note that there have been eight “high” points dating back to 1928.
Next, compare the current state (see the red "We are here" box) to the prior high points plotted bottom right.
P/B - Record high: No other prior period was higher. The closest was a 5.0 price-to-book in March 2000.
P/D - Record high: No other prior period was higher. The closest was an 89.4x price-to-dividend in March 2000.
P/E - The current reading is 25.6. It was 27.8 in March 2000.
One thing worth sitting with: P/B and P/D are at record highs, but P/E, at 25.6, isn't quite there yet (27.8 in March 2000). That gap matters. It's largely a function of record-high profit margins inflating the "E" in the ratio, which makes the market look less stretched on that one metric than it actually is on the others. Don't let it lull you — margins mean-revert too.
Source: NDR, CMG annotations
Stock Market Cap to Gross Domestic Income
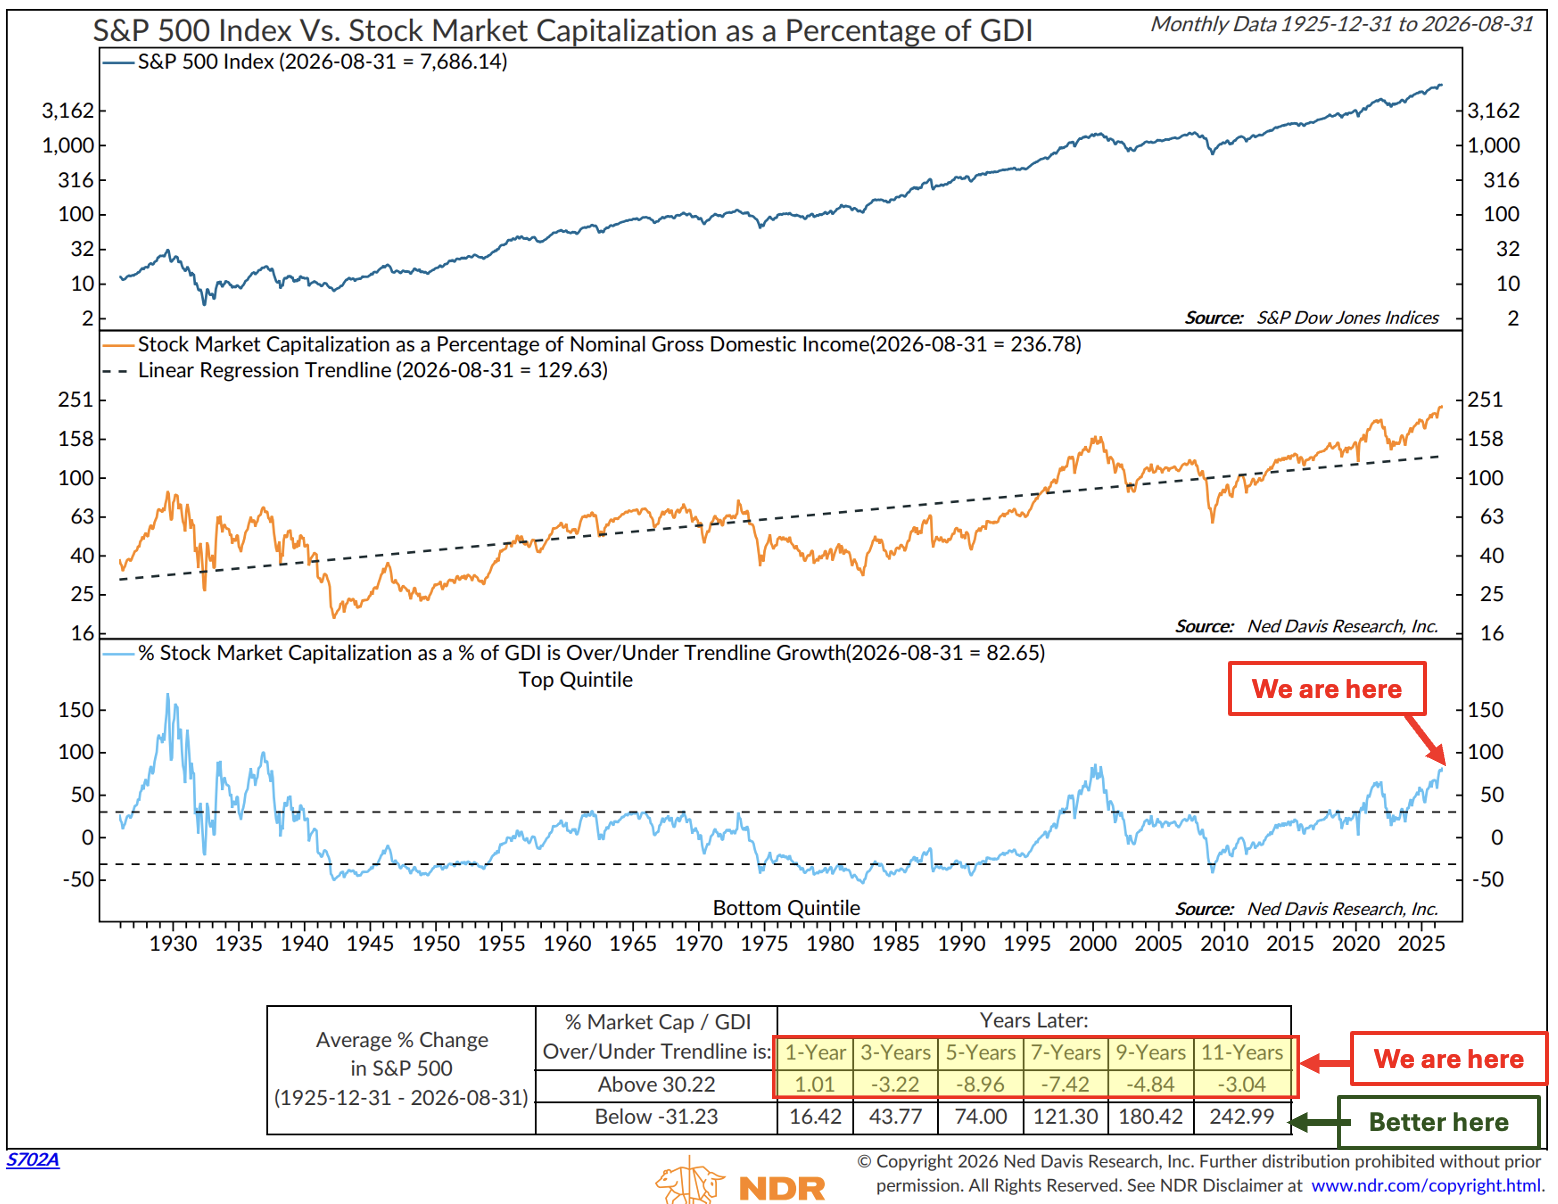
This next chart compares the total value of the U.S. stock market with the size of the U.S. economy, as measured by Gross Domestic Income (GDI). Simply put, it asks: Are stock prices expensive or cheap relative to the income generated by the economy?
The dashed lines identify historically overvalued and undervalued zones. The table at the bottom shows how stocks have performed in the years following similar valuation levels.
Historically, major market peaks have tended to occur when valuations were in the overvalued zone, while major market bottoms have tended to occur when valuations were in the undervalued zone.
No valuation measure is perfect. The economy and stock market have changed over time, including the mix of public and private companies and the growing importance of overseas revenues. Still, comparing the value of the entire stock market with the income generated by the economy provides a useful big-picture measure that is less dependent on accounting methods or changes in the makeup of individual stock indexes.
I view this chart as a valuable long-term guide to market valuation, prospective returns, and risk.
Here is how to read the chart:
The lower data box plots the S&P 500 Index returns 1-, 3-, 5-, 7-, 9-, and 11-years later.
The yellow box with the “We are here” arrow shows our current state. The green arrow shows we’d be “Better here.”
The takeaway: you want your entry point somewhere between the two extremes, and we're not there yet.
Source: NDR, CMG annotations
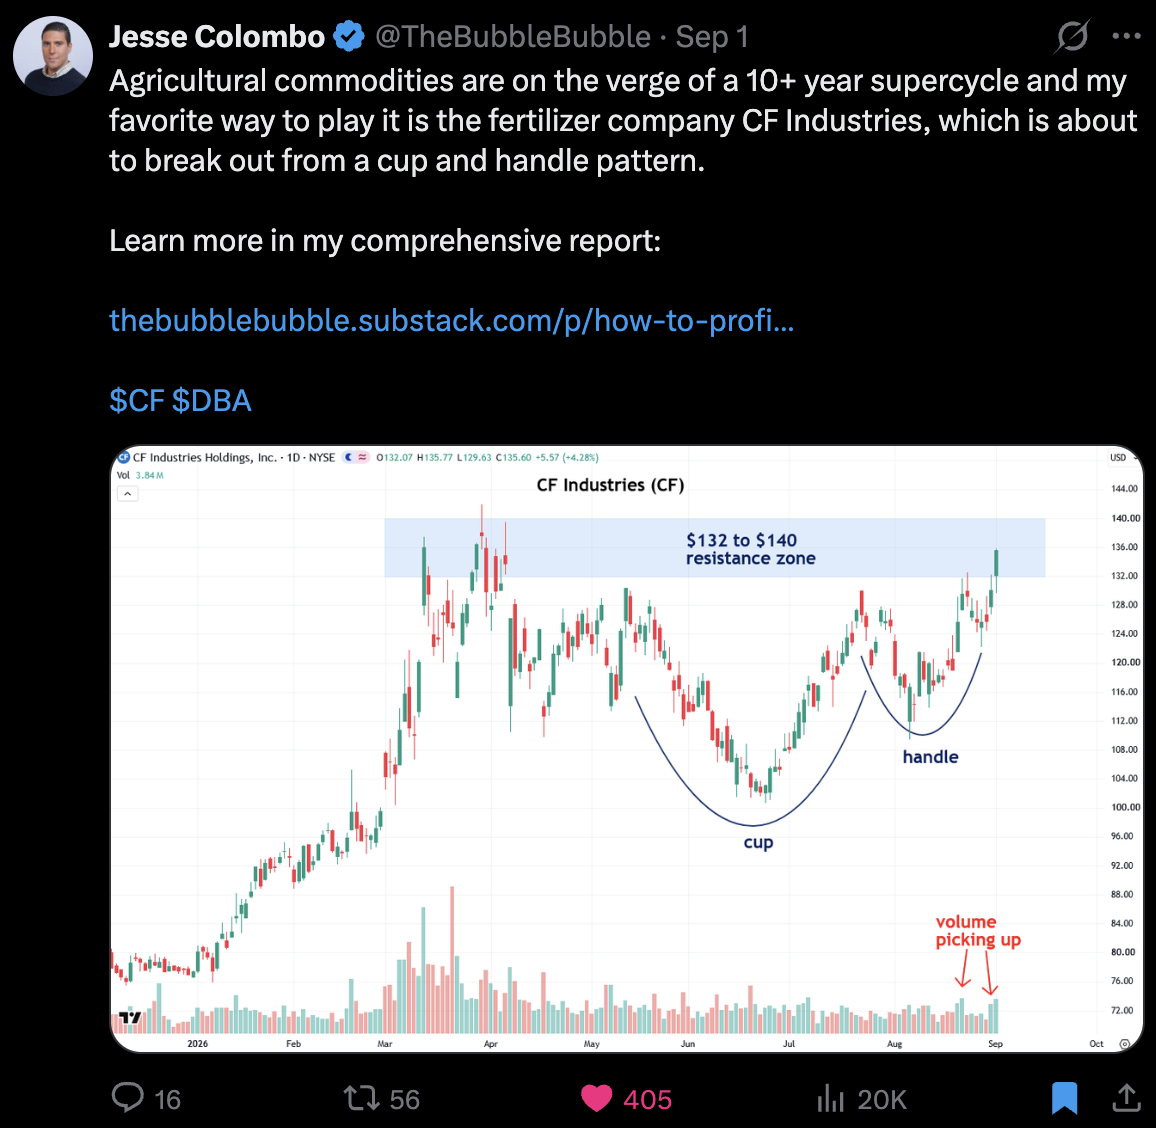
My take: There are real opportunities. I like energy, US infrastructure, high- and growing-dividend-paying stocks (companies with high free cash flow and low outstanding corporate debt), robotics, quantum computing, metals and miners, agriculture, and AI (to name a few categories). Add to positions in periods of market dislocation (forced leverage-unwinding environments).
I disfavor cap-weighted indices, as indicated by the charts above, and long-duration fixed-income bond investments. I see major cracks in the foundation, all tied to the late stage of the debt super cycle, with particular focus on the risk in the yen carry trade and rising interest rates across developed-world debt markets.
Opinions are subject to change. Not a recommendation to buy or sell any security. Provided for discussion and educational purposes only.
Several Interesting Charts
Source: X, Robin Brooks
Source: X, Robin Brooks
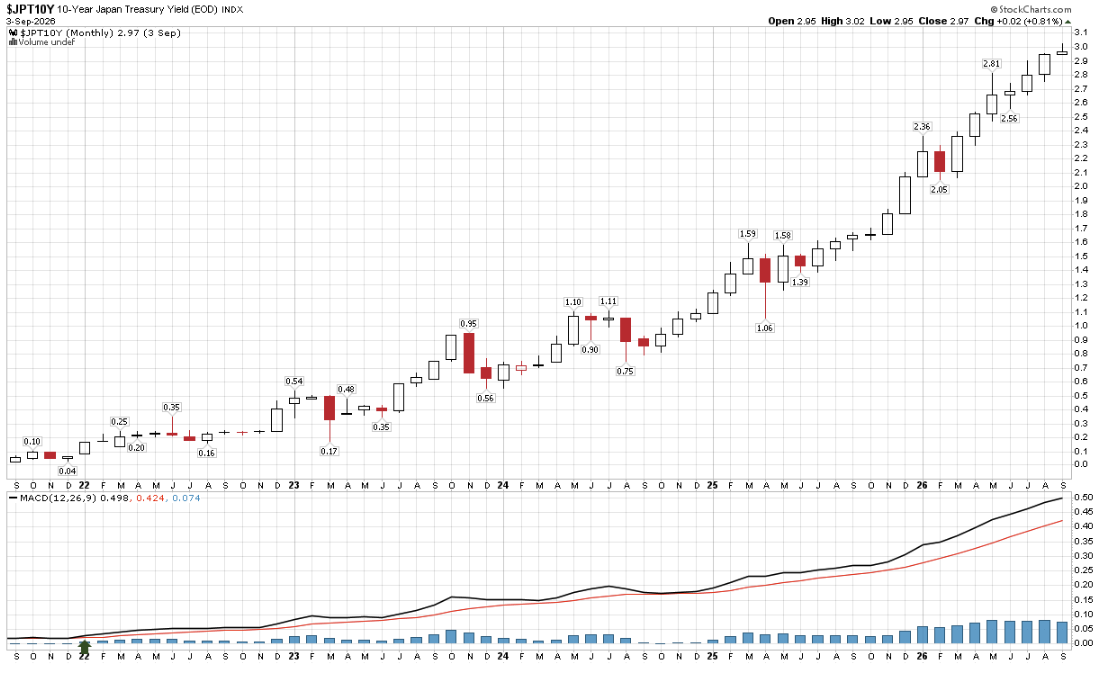
Next is a look at the 10-year Japanese Treasury Yield at the 3% level.
Remember when an investor could borrow at less than 1% and use the proceeds to buy other, higher-yielding investments. That’s the yen-carry trade, and the risk of it unwinding increases as the cost of borrowing goes up.
Source: StockCharts.com
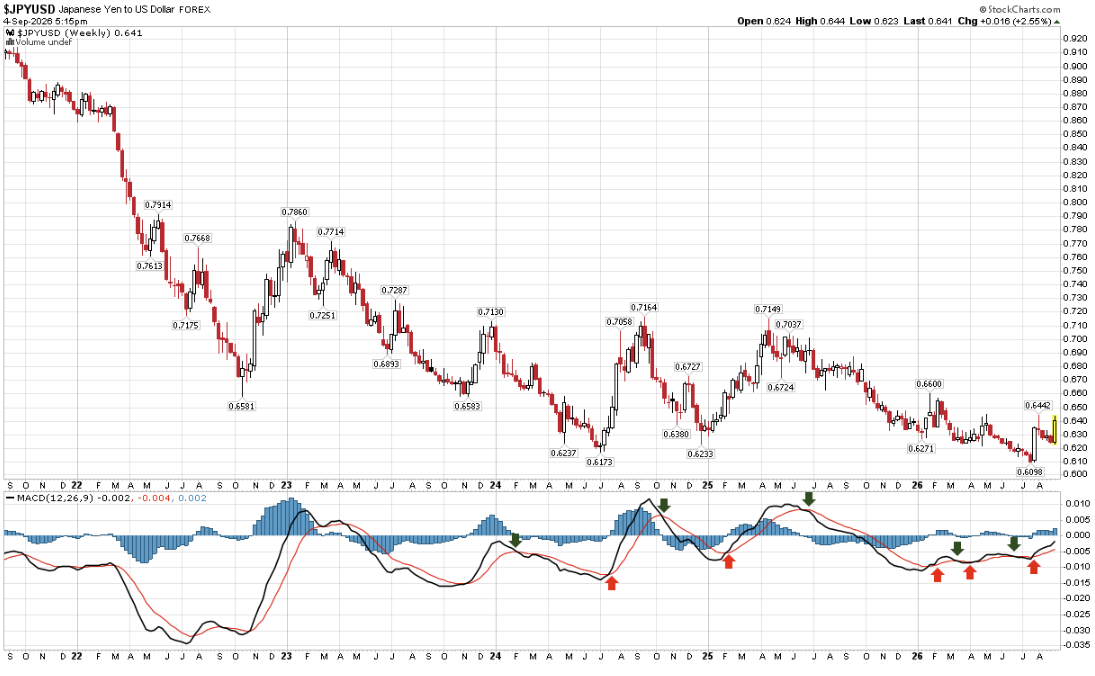
Next is a quick look at this week's apparent intervention aimed at pushing the yen higher.
Note the two price spikes higher in the last six weeks.
The yellow-highlighted bar is this week’s price action.
Here's why this matters beyond the chart: a narrowing rate gap is what funds the carry trade in the first place, and intervention like this is one way that gap closes. When the carry trade unwinds, it doesn't stay contained to Japan — August 2024 was a preview of how quickly that stress can spread to global risk assets. Worth watching closely as we move through a seasonally rough stretch for markets.
Source: StockCharts.com
Source: X, @Thebubblebubble
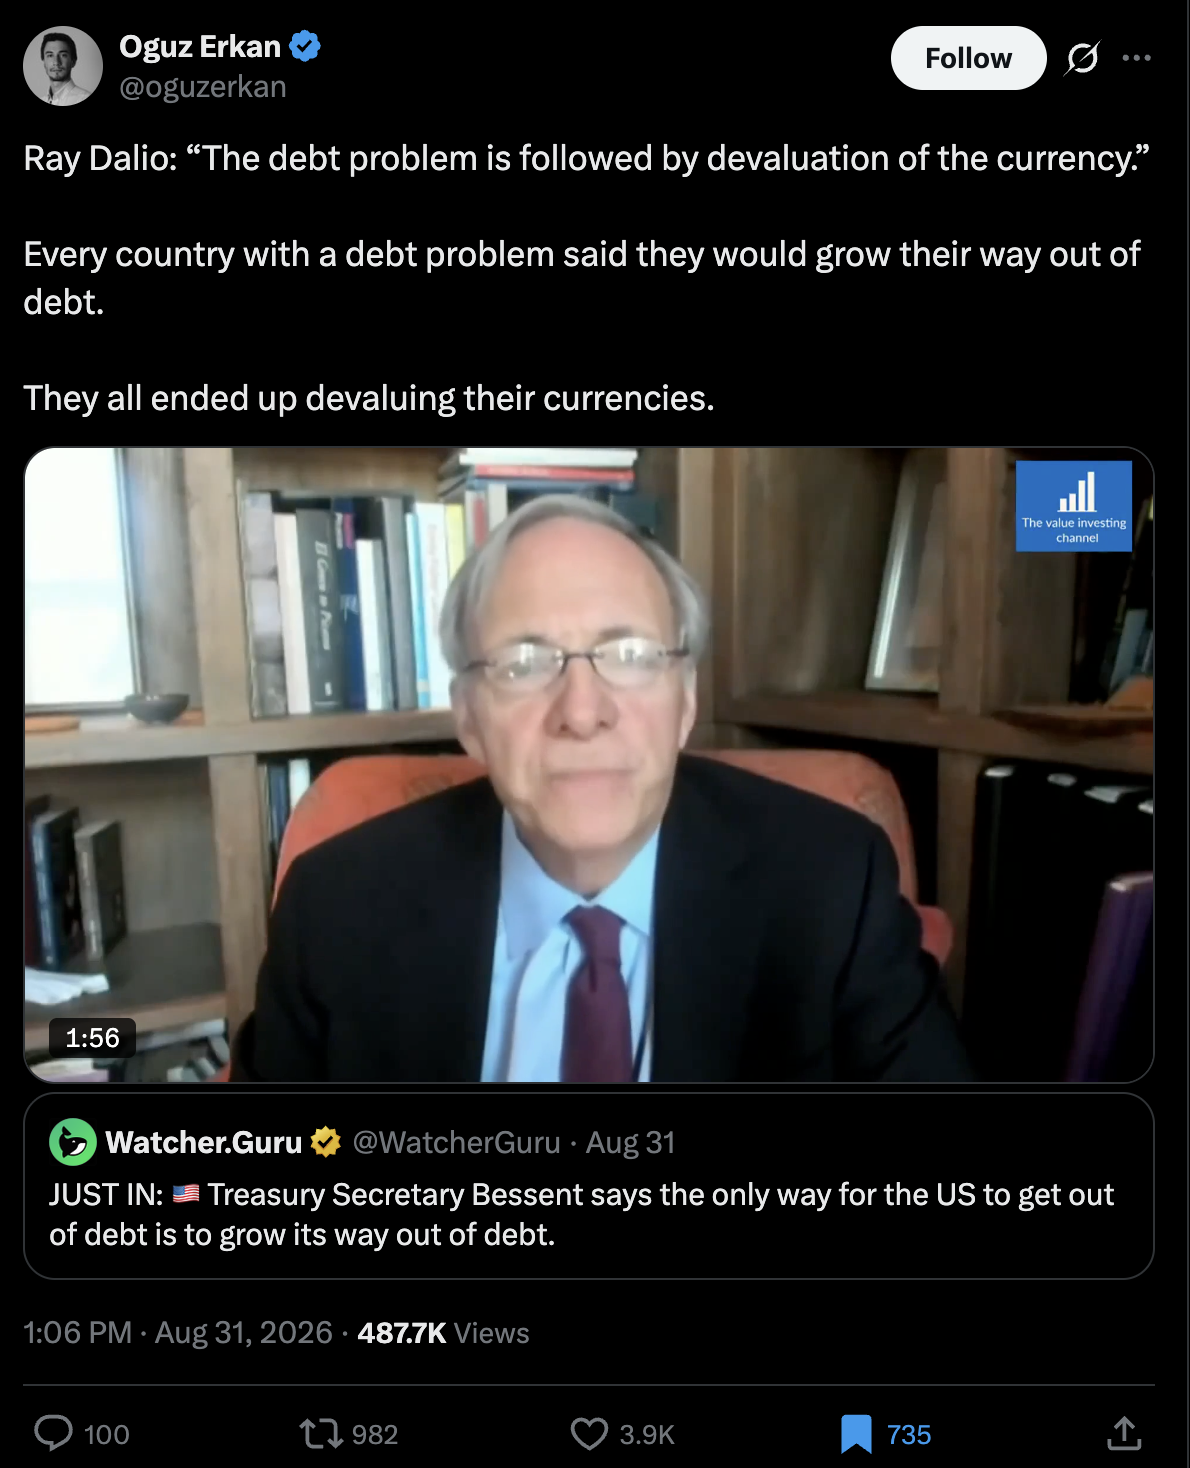
Dalio: What Ray is pointing out is what is happening in real time. And the heat in the kitchen is rising, as shown in the yield charts above.
The coming “reset” is about the restructuring of the dollar. You want to own assets that may benefit (hard assets, select equities, gold, commodities, and likely crypto, to name a few) and avoid those that may devalue (fixed-rate bonds and anything that may not keep pace with inflation). Not a recommendation for you to do anything. Please speak with your advisor.
Source: X, @silvertrade
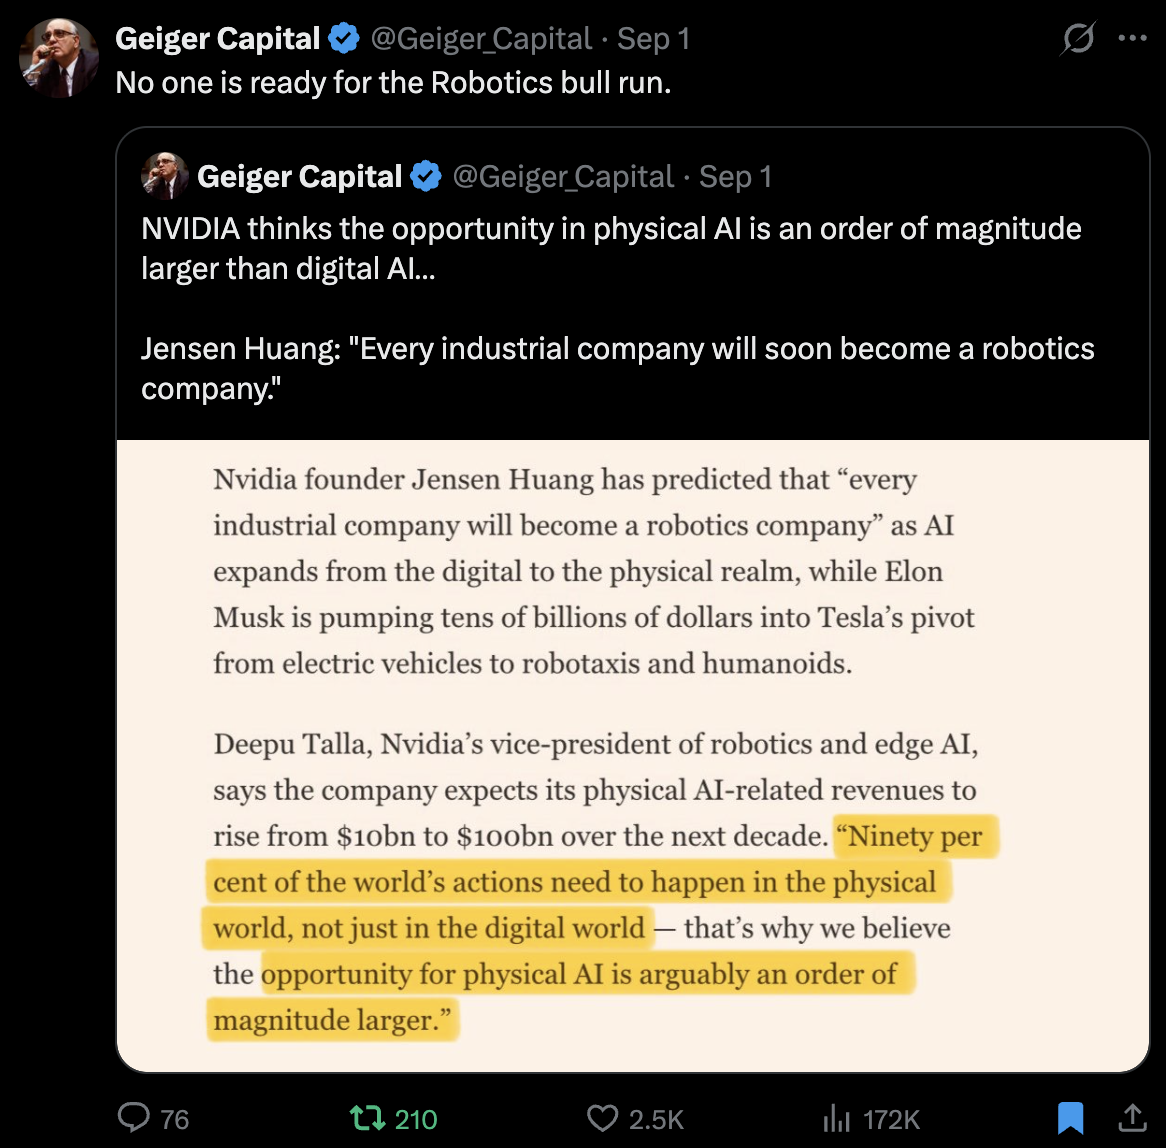
Source: X, Geiger Capital
Opinions are subject to change. Not a recommendation to buy or sell any security. Provided for discussion and educational purposes only.
The Great Powers Index - Ray Dalio
Ray's latest is worth reading in full, but the short version: he sees the U.S. facing a genuine test of its power on the world stage, comparable to Britain's Suez moment, this time over the Strait of Hormuz and Iran.
From Ray: “To me, it seems obvious that we are now seeing a classic big test of the world’s leading great power (the U.S.) that is analogous to the test the British Empire faced (and failed) when the Egyptians seized the Suez Canal from them. With the U.S. publicly threatening all the world’s nations with sanctions if they don’t go along with the U.S. plan to starve Iran into allowing free passage through the Strait of Hormuz, countries will now have to decide either a) to go along with the U.S. plan, which would be a great and obvious success for the U.S. if most countries go along and it works, or b) to defy the U.S. threats and plan and allow the Strait of Hormuz to remain under Iranian control, which would be a great and obvious failure for the U.S. While we can each have our own views of the odds of either outcome coming about, we can simply wait and find out which one happens. It will also be informative to see which countries join the U.S. plan, which ones don’t, and what the U.S. does about those that don’t.
Thus far, China and Pakistan have made clear that they won’t go along with the U.S., so it will be interesting to see if the U.S. follows through with its threats or will be caught bluffing. The U.A.E. has made it clear that it will go along with the U.S. Other countries have thus far remained silent or have been ambiguous. They can do so for a few days but will soon have to make their decisions clear.
Also notable, CIA Director John Ratcliffe made an unannounced visit to Moscow on August 25 and met with his Russian intelligence counterpart while other important negotiations are simultaneously and quietly going on. Supposedly, the most important purposes of the visit were 1) to deliver a warning to Putin not to act against NATO allies in Europe or against U.S. interests in dealing with Iran or not to significantly escalate the Ukraine war and 2) to explore whether Russia is receptive to doing a deal that would encompass both Ukraine and Iran, while China is quietly influencing from behind the scenes.
While these are the immediate particular issues now at hand that are transpiring for these particular countries, it seems to me that the arc of what is happening is a very classic great-powers conflict that is being driven by very classic Big Cycle changes in relative monetary, domestic political, international geopolitical, and technological powers of the big players in this drama—and, of course, the intellectual powers of the players to play the hands that they have been dealt wisely. Because the strengths of all these powers and how their relative strengths are changing can be measured, they can be followed, which is helpful in figuring out what is happening and what is likely to happen. For a complete review with measurements of past cases over the last 500 years, I refer you to my book Principles for Dealing with the Changing World Order, and, for updates on my most important power indicators, I refer you to my online Great Powers Index.
As always, I welcome exchanges of thoughts about what is happening and what to do about it.” Source: Ray Dalio, Substack
SB here: Each week I update a dashboard of my favorite indicators in Trade Signals. It helps me stay in tune with the current market fundamentals and technicals. Ray has created a sort of geopolitical dashboard called the Great Powers Index. If you have a minute, I recommend you click on the Great Powers Index
I’ll be tracking it more regularly in my own work.
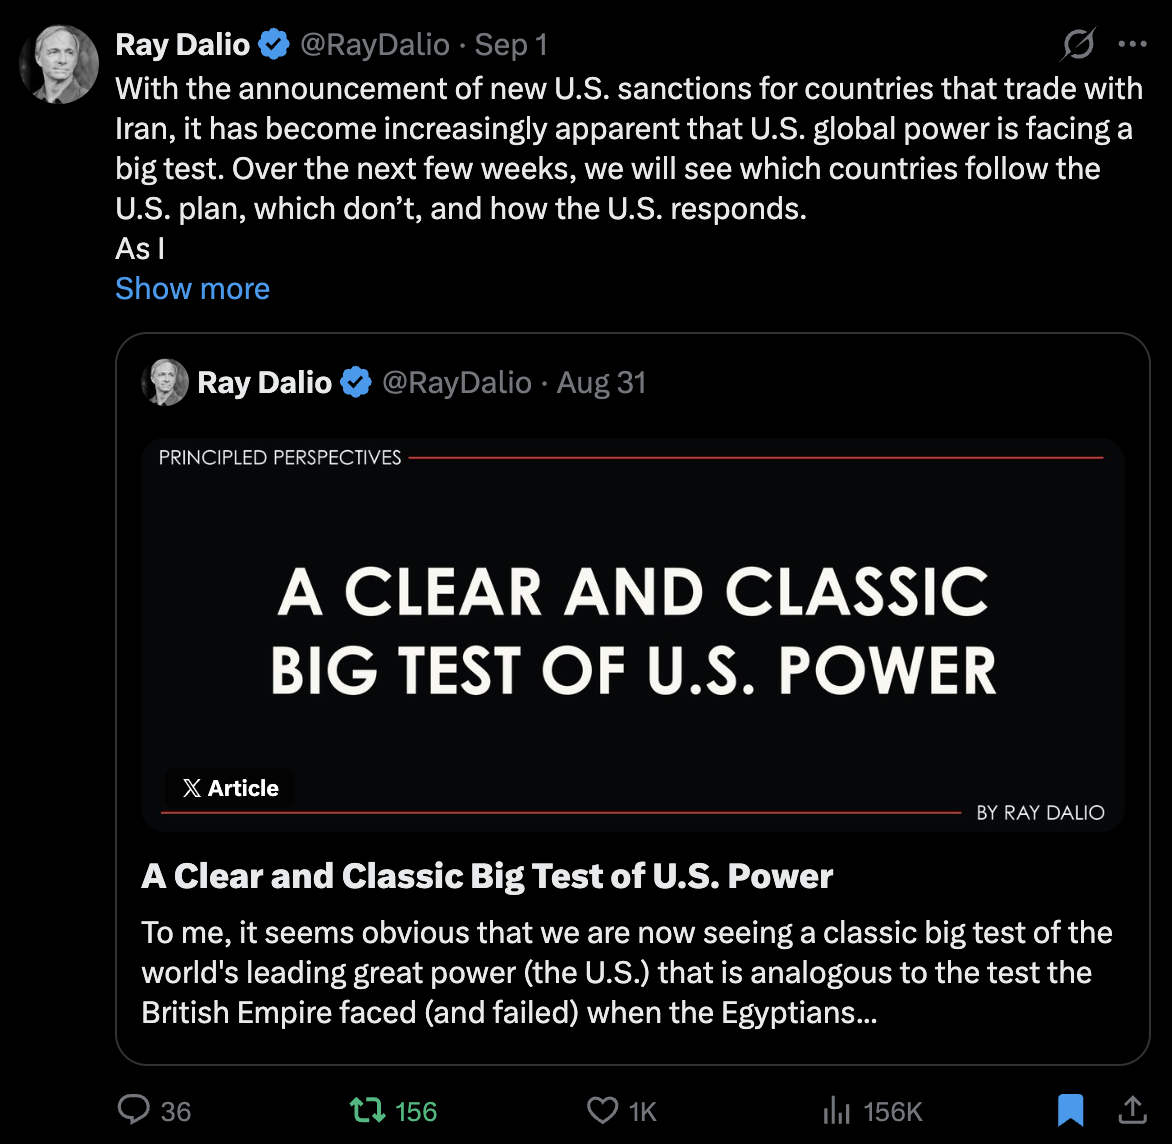
Source: X, Ray Dalio
Opinions are subject to change. Not a recommendation to buy or sell any security. Provided for discussion and educational purposes only.
If you like what you are reading, click on the link and share it with a friend (it’s free).
CLICK HERE TO SUBSCRIBE TO ON MY RADAR
Trade Signals: September 3, 2026 Update
Trade Signals
The Indicators Dashboard - Stocks, Investor Sentiment, Bonds, Commodities, Currencies, and Gold
Valuations and Subsequent 10-year Returns
Supporting Charts with Explanations

TRADE SIGNALS SUBSCRIPTION ACKNOWLEDGEMENT / IMPORTANT DISCLOSURES
About Trade Signals - Trade Signals is a paid subscription service that posts daily, weekly, and monthly market trends (and more). Free for CMG clients. Not a recommendation to buy or sell any security. For discussion purposes only.
The views expressed herein are solely those of Steve Blumenthal as of the date of this report and are subject to change without notice. Please note that the information provided is not recommended for buying or selling any security and is provided for discussion purposes only.
Personal Note: Mr. Rogers’ 10-Seconds
“In 1997, Fred Rogers walked onstage at Radio City Music Hall to accept a Lifetime Achievement Award at the Daytime Emmys. Tim Robbins introduced him as "the best neighbor any of us has ever had." Rogers didn't take a victory lap, though.
He asked the room for ten seconds of silence, to think of "the people who have helped you become who you are, those who have cared about you and wanted what was best for you in life." Then he said, "I'll watch the time," lifted his wrist, and watched it. Ten seconds, live, in front of an audience of actors, producers, and soap opera stars, an audience not known for sitting still. By the time he looked up, people were crying.”
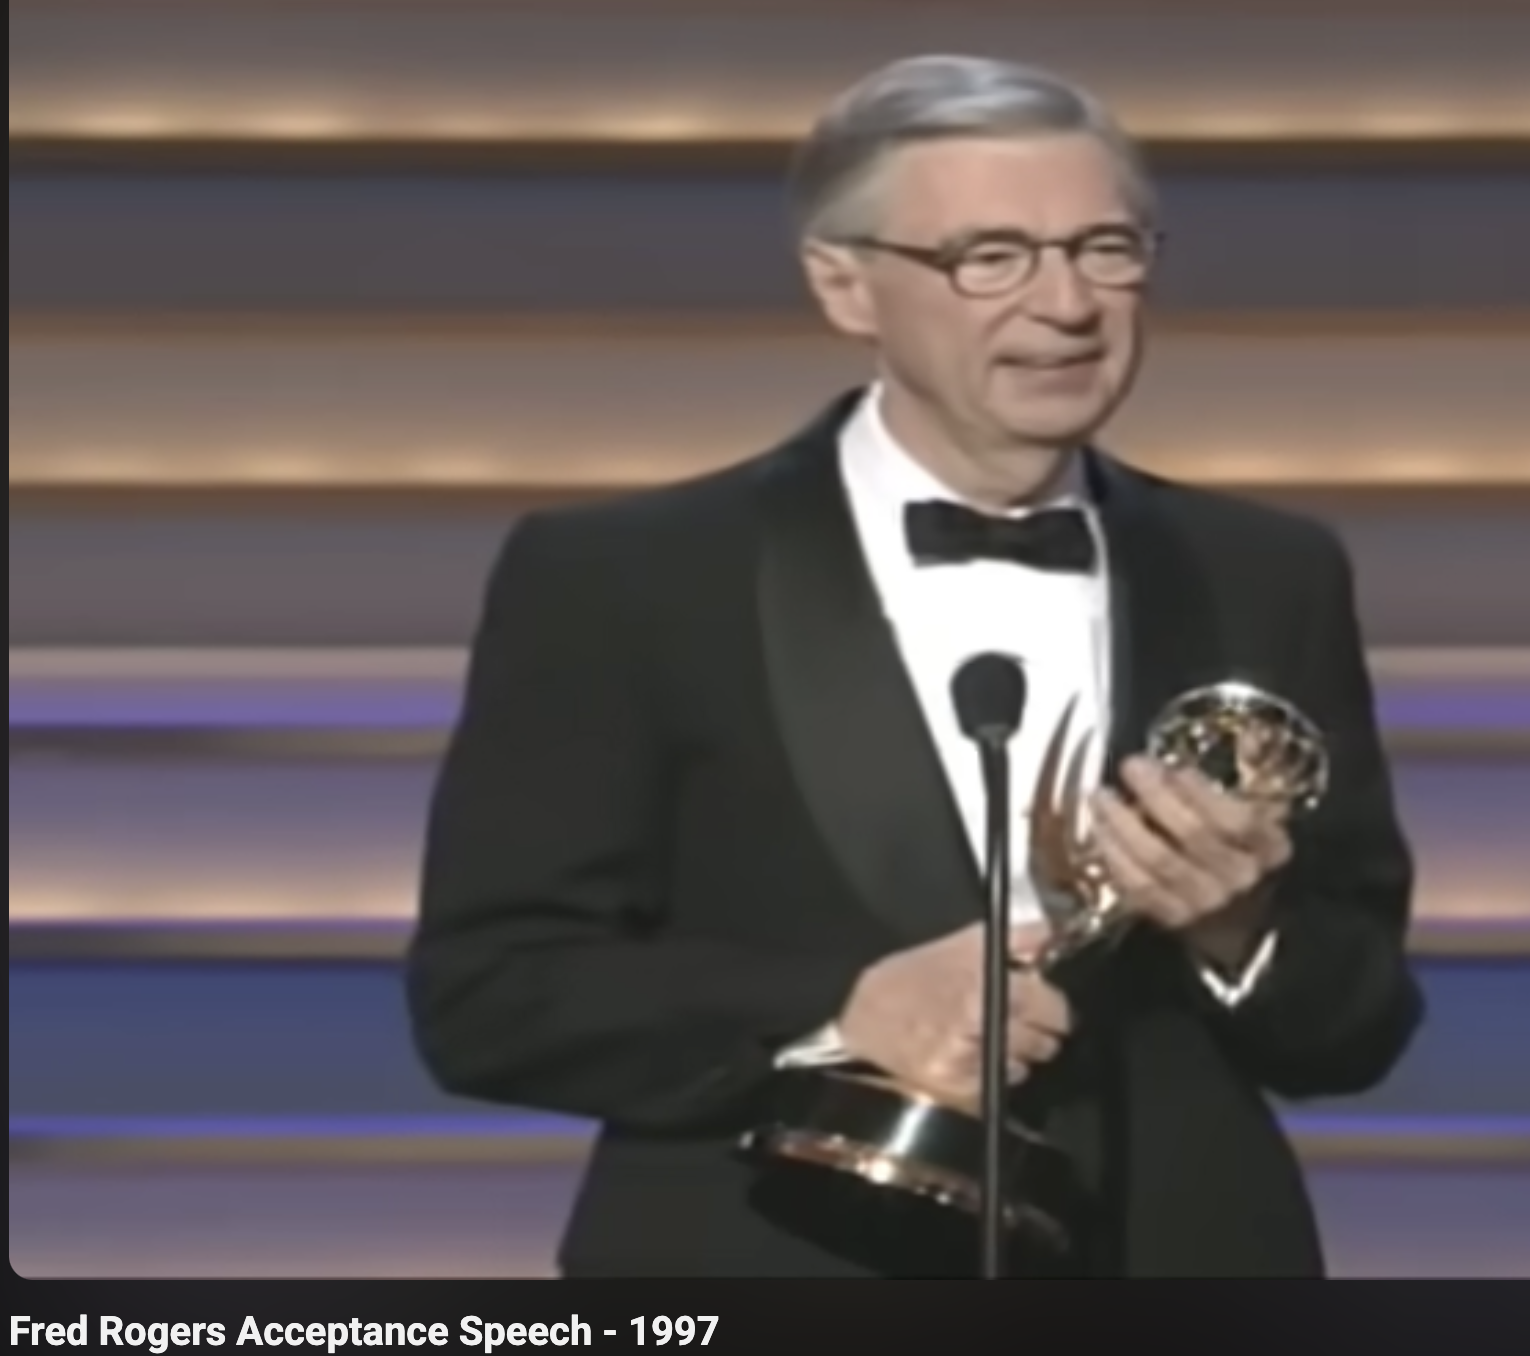
Source: YouTube, CLICK ON THE VIDEO TO WATCH
“In a place full of people conditioned to fill silence with applause, jokes, or the next cue, it was a pretty novel act. Rogers held the moment, at the cost of his own airtime, and let the silence, the reflection, do the work he couldn't do with words alone.
As leaders, we might sometimes spend people's attention without a second thought: a quick update, a distracted one-on-one, or a meeting that runs long because nobody wanted to be the one to stop it. Every one of those moments is borrowed from someone's finite ten seconds. Rogers knew that how you spend someone's time is itself a message about how much you value them, regardless of what you say while you're doing it.
Let’s ask ourselves:
When was the last time you gave someone your undivided attention for a full, uninterrupted moment, no phone, no next-meeting math running in your head?
Which routine moments on your calendar- a check-in, a recognition, a hard conversation- are you currently rushing past?
If your team described how you spend attention in a room, would "present" be the word they'd use?
The lesson we can learn from Mr. Rogers’ 10-second pause is all about how wisdom is knowing which moments deserve the full ten seconds, and giving it to them rather than rushing through on the way to the next thing on the agenda.”
The above is from The Daily Coach. I don’t read every email they send, but this one caught my eye. Subscribe for free here and get daily emails like the above directly in your inbox.
A quick soccer update:
Last night, Coach Sue's Malvern Prep Friars won their season opener, 2-0. A new season, and a fun one to watch — a few new faces on the team gave us more than a few pleasant surprises. (For new readers, Coach Sue is my wife, Susan.)
Afterward, Susan and I stopped at The Pour House for shrimp tacos and an Other Half IPA — a Brooklyn brewery, highly recommend. A cold beer always tastes better after a win. We ended up sitting there longer than we needed to, just talking through the game, no phones on the table. I didn't think anything of it at the time. It wasn't until I sat down to write this note to you that I recognized what it actually was: a small version of Rogers' ten seconds. Nothing was pulling at either of us. We just let it be about the game.
I'd like more of those. With the boys on Sue's team. With my team at CMG. With Susan and our children. Mr. Rogers’ lesson isn't complicated; it's just sometimes easy to forget. I can be better.
Wishing you a wonderful long holiday weekend, some great food, a cold IPA (or your favorite beverage), and a Mr. Rogers’ moment with those you hold closest to your heart.
With kind regards,
Steve
CLICK HERE TO SUBSCRIBE TO ON MY RADAR - IT’S FREE
You can share this letter on X by clicking here.
You can share this letter on LinkedIn by clicking here.
Subscribe to OMR for free by clicking the photo.
Stephen B. Blumenthal
Executive Chairman & CIO
CMG Capital Management Group, Inc.
75 Valley Stream Parkway, Suite 201,
Malvern, PA 19355
CMG Customer Relationship Summary (Form CRS)
Metric-Financial, LLC Customer Relationship Summary (Form CRS)

Stephen Blumenthal founded CMG Capital Management Group in 1992 and serves today as its Executive Chairman and CIO. Steve authors a free weekly e-letter entitled, “On My Radar.” Steve shares his views on macroeconomic research, valuations, portfolio construction, asset allocation and risk management. Author of Forbes Book: On My Radar, Navigating Stock Market Cycles.
Follow Steve on X @SBlumenthalCMG and LinkedIn.
IMPORTANT DISCLOSURE INFORMATION
This document is prepared by CMG Capital Management Group, Inc. (“CMG”) and is circulated for informational and educational purposes only. There is no consideration given to the specific investment needs, objectives, or tolerances of any of the recipients. Additionally, CMG’s actual investment positions may, and often will, vary from its conclusions discussed herein based on any number of factors, such as client investment restrictions, portfolio rebalancing, and transaction costs, among others. Recipients should consult their own advisors, including tax advisors, before making any investment decision. This material is for informational and educational purposes only and is not an offer to sell or the solicitation of an offer to buy the securities or other instruments mentioned. This material does not constitute a personal recommendation or take into account the particular investment objectives, financial situations, or needs of individual investors which are necessary considerations before making any investment decision. Investors should consider whether any advice or recommendation in this research is suitable for their particular circumstances and, where appropriate, seek professional advice, including legal, tax, accounting, investment, or other advice. The views expressed herein are solely those of Steve Blumenthal as of the date of this report and are subject to change without notice.
Investing involves risk.
This letter may contain forward-looking statements relating to the objectives, opportunities, and future performance of the various investment markets, indices, and investments. Forward-looking statements may be identified by the use of such words as; “believe,” anticipate,” “planned,” “potential,” and other similar terms. Examples of forward-looking statements include, but are not limited to, estimates with respect to financial condition, results of operations, and success or lack of success of any particular market, index, investment, or investment strategy. All are subject to various factors, including, but not limited to, general and local economic conditions, changing levels of competition within certain industries and markets, changes in legislation or regulation, Federal Reserve policy, and other economic, competitive, governmental, regulatory, and technological factors affecting markets, indices, investments, investment strategy and portfolio positioning that could cause actual results to differ materially from projected results. Such statements are forward-looking in nature and involve a number of known and unknown risks, uncertainties, and other factors, and accordingly, actual results may differ materially from those reflected or contemplated in such forward-looking statements. Investors are cautioned not to place undue reliance on any forward-looking statements or examples. All statements made herein speak only as of the date that they were made. Investing is inherently risky and all investing involves the potential risk of loss.
Past performance does not guarantee or indicate future results. Different types of investments involve varying degrees of risk, and there can be no assurance that the future performance of any specific investment, investment strategy, or product (including the investments and/or investment strategies recommended or undertaken by CMG), or any non-investment related content, made reference to directly or indirectly in this commentary will be profitable, equal any corresponding indicated historical performance level(s), be suitable for your portfolio or individual situation or prove successful. Due to various factors, including changing market conditions and/or applicable laws, the content may no longer be reflective of current opinions or positions. Moreover, you should not assume that any discussion or information contained in this commentary serves as the receipt of, or as a substitute for, personalized investment advice from CMG. Please remember to contact CMG, in writing, if there are any changes in your personal/financial situation or investment objectives for the purpose of reviewing/evaluating/revising our previous recommendations and/or services, or if you would like to impose, add, or to modify any reasonable restrictions to our investment advisory services. Unless, and until, you notify us, in writing, to the contrary, we shall continue to provide services as we do currently. CMG is neither a law firm, nor a certified public accounting firm, and no portion of the commentary content should be construed as legal or accounting advice.
No portion of the content should be construed as an offer or solicitation for the purchase or sale of any security. References to specific securities, investment programs or funds are for illustrative purposes only and are not intended to be, and should not be interpreted as recommendations to purchase or sell such securities.
This presentation does not discuss, directly or indirectly, the amount of the profits or losses realized or unrealized, by any CMG client from any specific funds or securities. Please note: In the event that CMG references performance results for an actual CMG portfolio, the results are reported net of advisory fees and inclusive of dividends. The performance referenced is that as determined and/or provided directly by the referenced funds and/or publishers, has not been independently verified, and does not reflect the performance of any specific CMG client. CMG clients may have experienced materially different performance based upon various factors during the corresponding time periods. See in links provided citing limitations of hypothetical back-tested information. Past performance cannot predict or guarantee future performance. Not a recommendation to buy or sell. Please talk to your advisor.
Information herein has been obtained from sources believed to be reliable, but we do not warrant its accuracy. This document is general communication and is provided for informational and/or educational purposes only. None of the content should be viewed as a suggestion that you take or refrain from taking any action nor as a recommendation for any specific investment product, strategy, or other such purposes.
In a rising interest rate environment, the value of fixed-income securities generally declines, and conversely, in a falling interest rate environment, the value of fixed-income securities generally increases. High-yield securities may be subject to heightened market, interest rate, or credit risk and should not be purchased solely because of the stated yield. Ratings are measured on a scale that ranges from AAA or Aaa (highest) to D or C (lowest). Investment-grade investments are those rated from highest down to BBB- or Baa3.
NOT FDIC INSURED. MAY LOSE VALUE. NO BANK GUARANTEE.
Certain information contained herein has been obtained from third-party sources believed to be reliable, but we cannot guarantee its accuracy or completeness.
In the event that there has been a change in an individual’s investment objective or financial situation, he/she is encouraged to consult with his/her investment professional.
Written Disclosure Statement. CMG is an SEC-registered investment adviser located in Malvern, Pennsylvania. Stephen B. Blumenthal is CMG’s founder and CEO. Please note: The above views are those of CMG and its CEO, Stephen Blumenthal, and do not reflect those of any sub-advisor that CMG may engage to manage any CMG strategy, or exclusively determines any internal strategy employed by CMG. A copy of CMG’s current written disclosure statement discussing advisory services and fees is available upon request or via CMG’s internet web site at www.cmgwealth.com/disclosures. CMG is committed to protecting your personal information. Click here to review CMG’s privacy policies.
See CMG Disclosures at the bottom of this page.
For more information about NDR, please visit at www.ndr.com.
NDR, Inc. (NDR), d.b.a. Ned Davis Research Group (NDRG), any NDRG affiliates or employees, or any third-party data provider, shall not have any liability for any loss sustained by anyone who has relied on the information contained in any NDRG publication. The data and analysis contained herein are provided "as is." NDRG disclaims any and all express or implied warranties, including, but not limited to, any warranties of merchantability, suitability or fitness for a particular purpose or use. NDRG's past recommendations and model results are not a guarantee of future results. This communication reflects our analysts' opinions as of the date of this communication and will not necessarily be updated as views or information change. All opinions expressed herein are subject to change without notice. NDRG or its affiliated companies or their respective shareholders, directors, officers and/or employees, may have long or short positions in the securities discussed herein and may purchase or sell such securities without notice. For NDRG's important additional disclaimers, refer to www.ndr.com/invest/public/copyright.html. Further distribution prohibited without prior permission. Copyright 2025 © NDR, Inc. All rights reserved.