On My Radar - The Over-Concentration Unwind

March 21, 2025
By Steve Blumenthal
“We didn't start the fire… It was always burning, since the world's been turning… We didn't start the fire… No, we didn't light it, but we tried to fight it!”
— Billy Joel, We Didn’t Start the Fire (1989)
In today’s global economy, tariffs have become a prime instrument of disruption—not merely a tax on goods, but a deliberate tool to interrupt the status quo and force renegotiation. Whether aimed at allies or adversaries, tariffs are being wielded as leverage to extract more favorable trade terms. Judging by recent market behavior, there’s little indication that the Trump administration is bluffing.
Merriam-Webster defines disruption as “the act or process of disrupting something—a break or interruption in the normal course or continuation of some activity, process, etc.”
Make no mistake. We are here because of 75 years of debt accumulation. It’s a mess. We didn’t start the fire, but the fire is ours.
None of this is normal. The stakes are high. Probable outcomes? You tell me. History points to inflation, but time will tell.
Grab your coffee and settle into your favorite chair. Long-time readers know I’m a big valuation guy. Valuations are high, and probable future returns are low. You’ll find some helpful data below.
Think of it as an investment roadmap of sorts. If valuations were lower and return potential higher, the disruption impact would likely be far less. That’s not our current state.
We’ll also look at the massive overconcentration into just 10 stocks. You know the names. And keep in mind that it is not just U.S. investors who own them; it’s investors from all around the globe. Tieing this disruptive theme together, I’ve included a link to an All In podcast interview with Treasury Secretary Scott Bessent. It’s excellent. What to own? We’ll take a look at that next week.
On My Radar:
The S&P 500 Over-Concentration Unwind
Treasury Secretary Scott Bessent on the All In Podcast
The 10-year Treasury Yield Target and Longer-term Trend
Trade Signals: Update - March 20, 2025
Personal Note: The Best “To Do” List Ever
See Important Disclosures at the bottom of this page. Reminder: This is not a recommendation to buy or sell any security. My views may change at any time. The information is for discussion purposes only.
If you like what you are reading, you can subscribe for free.

The S&P 500 Over-Concentration Unwind
It was an interesting week for me this week. We are moving our offices a quarter mile up the road. Yesterday was not fun, but I put my earbuds in and listened to Felix Zulauf’s quarterly research update webinar replay.
I woke at 4:30 am this morning and sat down to watch the replay again, viewing the charts. His research is proprietary to clients, and frankly, it is something we consider internally at CMG from a ‘game theory’ like perspective as we internally debate investment positioning in today’s investment world.
One of the topics Felix touched on was the potential unwinding of the most over-concentrated position of the S&P 500 index into 10 stocks. We’ve discussed this before… But I want to emphasize that this is historic. You’ll see it in the following chart courtesy of Ned Davis Research.
Here’s how to view the chart:
Focus on the orange section.
I’ve highlighted 1973 (the “Nifty Fifty” stock over-concentration peak), the 2000 Tech Bubble, and the current 2025 bubble.
Note how the current peak is higher than the prior two major overconcentration peaks.

Source: NDR
Next is a look at the PE 10 or Shiller PE:
Bottom line: The current level is 35.38. The historical mean is 17.22. The blue line plots the PE back to approximately 1870. Note the current level vs 2020, 2000 (Tech bubble top), and the 1966 (Nifty Fifty) peaks.

Source: Shiller PE
This means risk is high and potential coming 10-year returns are low. Next is a chart that looks at actual subsequent 10-year returns based on the level of PE (in this case, PE10, which is the equivalent of Shiller PE above).
We currently sit in the top 10% of overpriced PE readings, where the “average beginning P/E” was 26.6 and the total “return decile average” was 1.5%. Call it not so good.
To get some perspective on this, our current PE is 35.38. That’s well above the “average begin P/E.” While I have no idea what the return will be 10 years from today’s date, looking at history, it will likely range from -1.8% to +3.7%.
Bottom line: Don’t expect 10% per year. Expect $100,000 to be worth about $100,000 in ten years, which is not a good result, especially after inflation is factored in. No guarantees, of course. This is a probability game.

Source: Crestmont Research
There was another essential point Felix Zulauf made during his outlook update: He said it is not just U.S. investors who are overweight the Mag-7 and top ten stocks. Global investors also own the same popular stocks.
Understanding the Flaws in the Popular Cap-Weight Structure
Investors, in general, are allocated to S&P 500 index funds. One of the flaws in the cap-weight methodology is that, by rule, the index applies a significant percentage weighting to the largest companies. In layman's terms: this means that when everyone chases into the most popular stocks, they drive prices higher, making the value of their company (number of shares outstanding time its price) larger. Each month when you put more money into your 401k that buys you into the S&P 500 index, that money owns a larger and larger percentage of the popular 10 stocks. When the S&P 500 does its quarterly rebalancing, the companies with the highest market cap get pushed even higher.
As highlighted above, $35,000 of your $100,000 investment into the S&P 500 index is in ten stocks. $65,000 is in the other 490 stocks. On the way up, the index is buying more and more of the big names. The problem occurs on the way down. Especially when panic ensues. When many sell simultaneously, the indices are forced to sell, and the largest weightings are hurt the most.
Picture the orange in the chart above: if the weighting drops from 35% to 25%, the potential to recover from the loss is disadvantaged by the weighting rule as it sells you out. Within the S&P 500 index fund, you now have a smaller weighting to the top 10, impacting your ability to recover when the new bull market begins.
There are ways to solve this problem through better S&P 500 weighting methodologies. A topic for another day. My main point today is that few understand this flaw in cap-weighted structures.
For now, a bull in the china shop is looking to shake things up. I don’t believe the government “put” is in place to support the market unless there is a significant crash. For Scott Bessent’s comments on needing a detox, see last week’s OMR: Detox and Rehab.
If I had to put a target on where this correction may take us, I’d point to 4,031.20, which is the most recent “Median PE” level in the last 61 years (yellow highlight in chart).
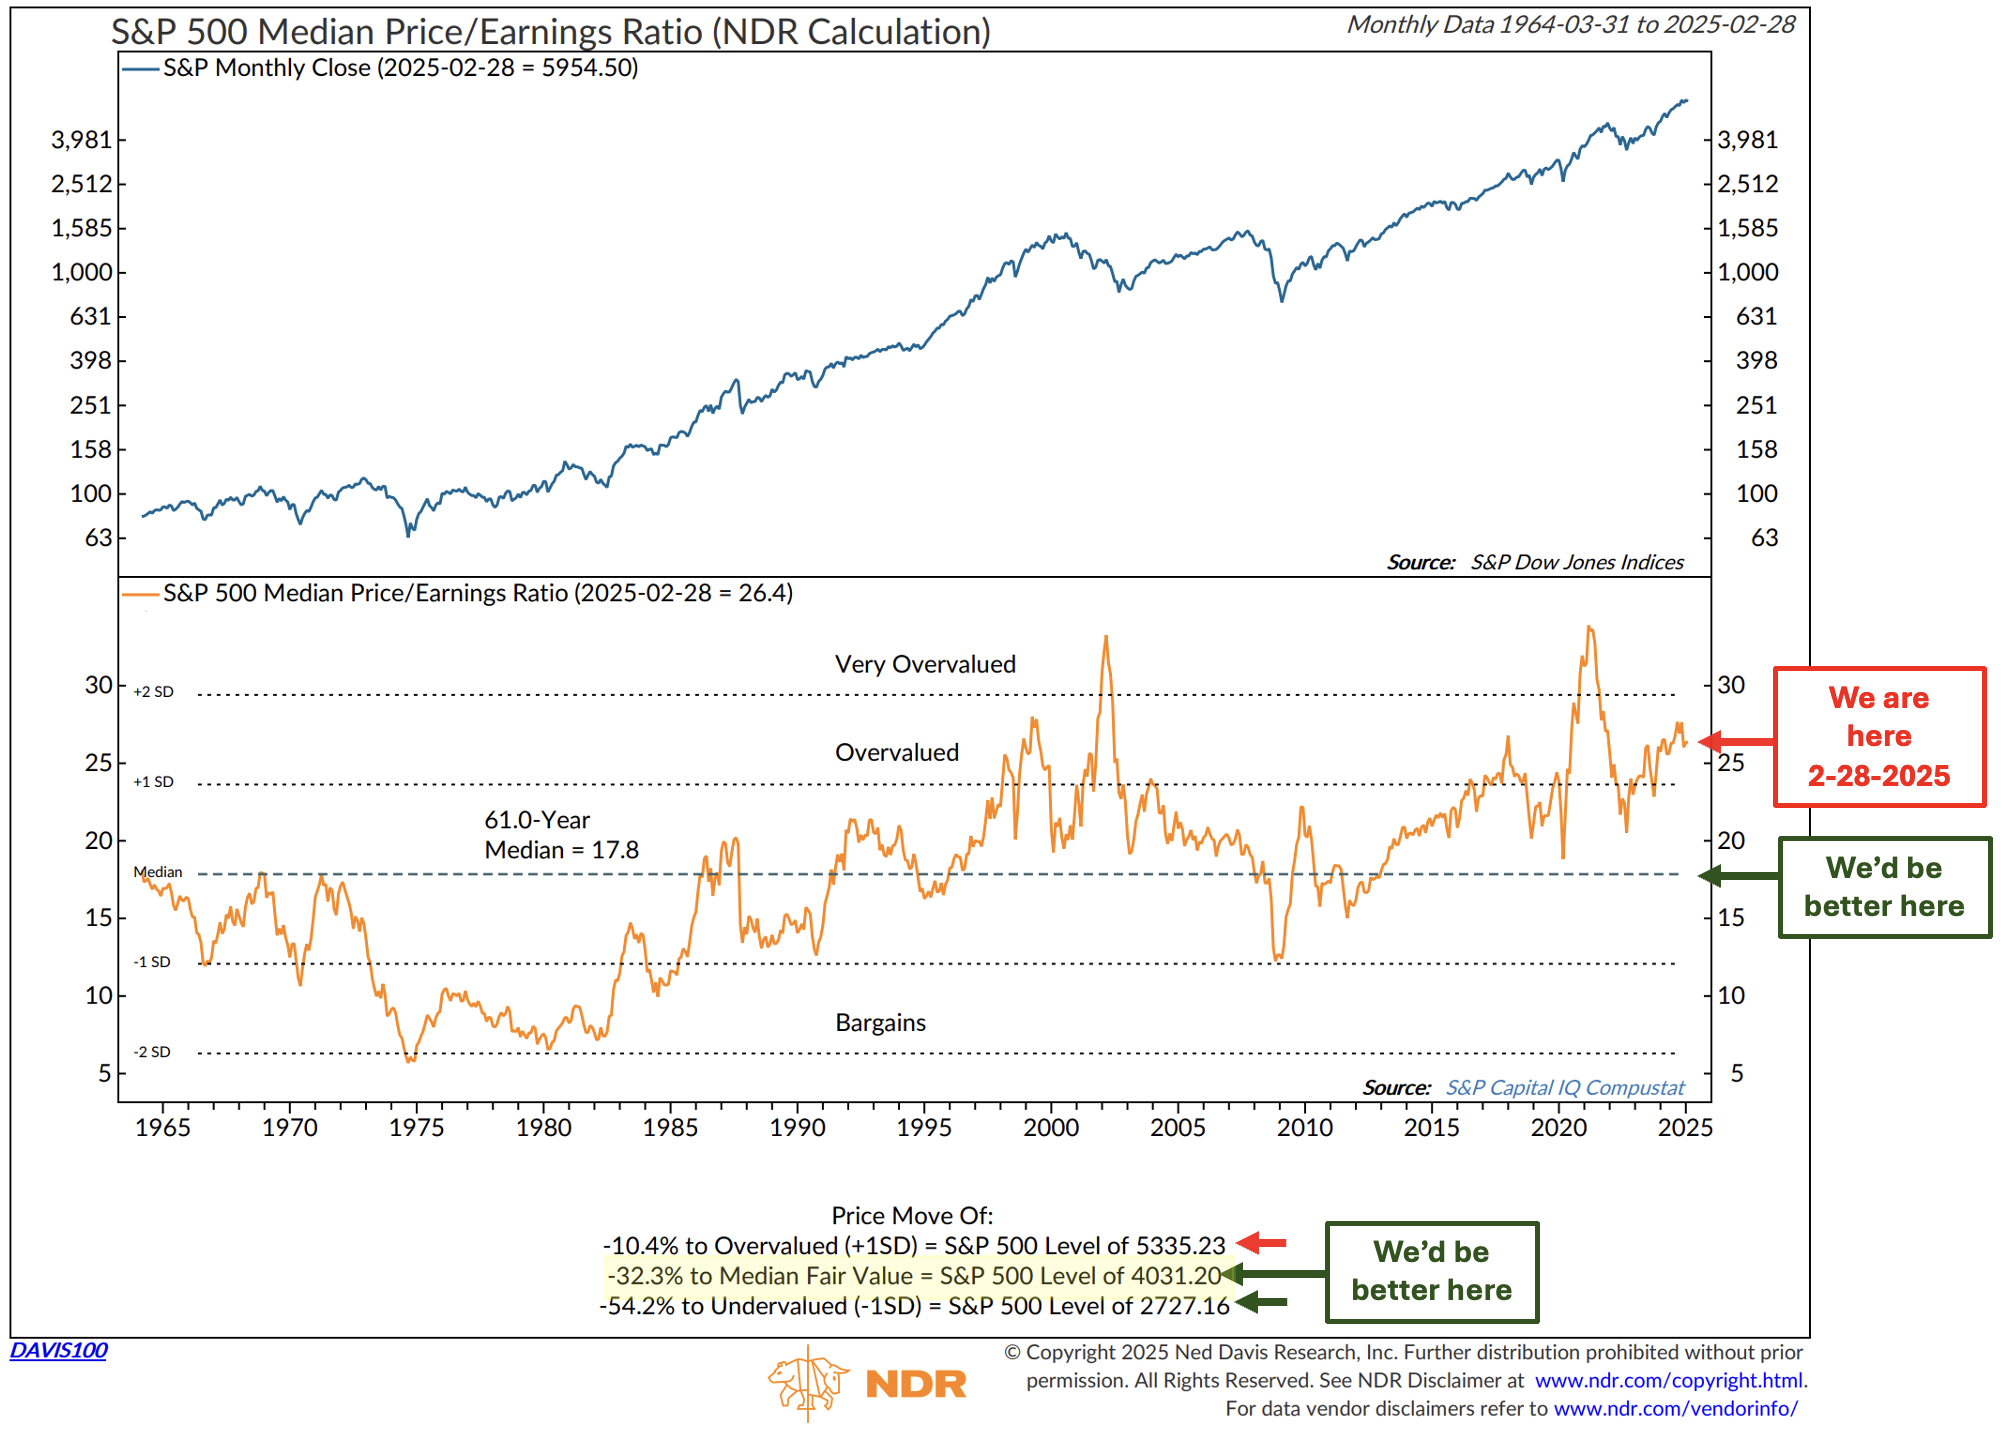
Source: NDR w CMG Research color comments and arrows
Finally, I’ll add that Felix is targeting a correction to 5,000. He may be right. Getting us to my Meidan Fair Value target of 4,032 will take a meaningful event. Also, you can see in the above chart that it can take years for PE to drop to the orange “We’d be better here” line—patience grasshopper.
Please note that the information provided is not recommended for buying or selling any security and is provided for discussion purposes only.
Treasury Secretary Scott Bessent on the All In Podcast
Plug in and head out for your 10,000 steps. When you are sitting at the poker table learning to read the room, this is an impact player worth listening to:

Source: Spotify, All In Podcast
Please note that the information provided is not recommended for buying or selling any security and is provided for discussion purposes only.
The 10-year Treasury Yield Target and Longer-term Trend
Keep a close eye on the 10-year Treasury Yield. The Weekly MACD is signaling yields are moving down. The second chart shows the Monthly MACD. Consider it the more dominant intermediate-term trend. It, too, is signaling yields are heading lower.

Stockcharts.com

Stockcharts.com
Both charts point to a slowing economy and rising recession risk. My broader view is that recession takes us to the 3.25% to 3.5% range. Then, I suspect we will get easing from the government and the Fed.
If I’m correct in my view (no guarantees and subject to change), we’ll have a nice trading opportunity for bond investors and a chance to refinance higher-cost mortgage debt.
The longer-term secular trend is one of rising yields. I believe the great bond bull market ended in 2020.
Please note that the information provided is not recommended for buying or selling any security and is provided for discussion purposes only.
Trade Signals: Update – March 20, 2025
March 12, 2025 -- S&P 500 Index 5,599
“Stay on top of the current market trends with Trade Signals.”
“Extreme patience combined with extreme decisiveness. You may call that our investment process. Yes, it’s that simple.”
– Charlie Munger
Trade Signals is Organized in the Following Sections:
Market Commentary
Trade Signals - Dashboard of Indicators
Market Valuations and Subsequent 10-year Returns
Supporting Charts with Explanations
Market Commentary
The trend charts are updated. No significant changes this week. Following is a brief commentary.
The S&P 500 appears to be finding support at the July 2024 high of 5,669. The Weekly MACD remains in a bear trend signal. The next level of support sits at around 5,200.

Source: Stockcharts.com
We are finally seeing a separation in the Mag-7 performance. Tweet earlier this week from @bespokeinvest.
International and developed market equities are holding up well. The daily and weekly macd’s are in bull up-trends for both markets.
Gold remains in a bull uptrend, as you’ll see in the dashboard of indicators summary and the gold trend charts below. I enjoyed this tweet from @dlacalle_IA. Look at the move higher in global money supply (Chart from Bloomberg).
Bottom line: The trend remains bearish for U.S. equities. Value-oriented stocks are holding up well. After so much liquidity from the Fed and Government, we may enter a phase where stock selection vs. cap-weighted index buy-and-hold becomes relevant again.
Expect inflationary pressures from tariffs, an economic slowdown, and weaker corporate earnings. The risk of recession remains high.

TRADE SIGNALS SUBSCRIPTION ACKNOWLEDGEMENT / IMPORTANT DISCLOSURES
The views expressed herein are solely those of Steve Blumenthal as of the date of this report and are subject to change without notice. Not a recommendation to buy or sell any security.
Please note that the information provided is not recommended for buying or selling any security and is provided for discussion purposes only. Current viewpoints are subject to change. Please note that the information provided is not recommended for buying or selling any security and is provided for discussion purposes only.
Personal Note: The Best “To Do” List Ever
Every now and then, life hands you a little reminder of what really matters—and sometimes, it comes in the form of a neon sticky note left on your desk.
My daughter Brianna and I share something special. There’s an understanding between us, a kind of spiritual connection that we enjoy discussing on walks and over wine. She has a way of distilling truth into simple moments and did just that for me this week.
She left me a note that reads like a personal compass:

Lost in the muck of the office move, the note stopped me.
That sticky note is permanently placed where I’ll see it each morning. It’s a checklist of sorts—but not the kind tied to deadlines or obligations. It’s a map back to my better self.
Think good thoughts. What you put into your mind shapes your day, mood, and energy. Brianna’s gentle reminder that we get to choose the lens we look through. That positivity isn’t just powder fluff—it’s fuel.
Smile. Simple. Powerful.
I’ll be in Utah next week with my adult kids and a few friends. That number two item on the “Universe To Do” side of the list reads, “floaty pow pow.” We are mentally programming for a few deep skiing powder days.
That’s our language. That’s us. It’s playful, hopeful, and taps into something far more powerful than ourselves. Of course, the world needs a lot of love right now. I will say my prayers, put that one on the Universe To Do list, and do my best to be nice to people I touch. That I can do.
Sticky notes don’t usually last forever. This one will.
Smile!
Thanks for reading…
Wishing you the very best,
Steve
You can share this letter on X by clicking here.
You can share this letter on LinkedIn by clicking here.
Subscribe to OMR for free by clicking the photo.
Stephen B. Blumenthal
Executive Chairman & CIO
CMG Capital Management Group, Inc.
10 Valley Stream Parkway, Suite 202 Malvern, PA 19355
Private Wealth Client Website
CMG Customer Relationship Summary (Form CRS)
Metric-Financial, LLC Customer Relationship Summary (Form CRS)

Stephen Blumenthal founded CMG Capital Management Group in 1992 and serves today as its Executive Chairman and CIO. Steve authors a free weekly e-letter entitled, “On My Radar.” Steve shares his views on macroeconomic research, valuations, portfolio construction, asset allocation and risk management. Author of Forbes Book: On My Radar, Navigating Stock Market Cycles.
Follow Steve on X @SBlumenthalCMG and LinkedIn.
IMPORTANT DISCLOSURE INFORMATION
This document is prepared by CMG Capital Management Group, Inc. (“CMG”) and is circulated for informational and educational purposes only. There is no consideration given to the specific investment needs, objectives, or tolerances of any of the recipients. Additionally, CMG’s actual investment positions may, and often will, vary from its conclusions discussed herein based on any number of factors, such as client investment restrictions, portfolio rebalancing, and transaction costs, among others. Recipients should consult their own advisors, including tax advisors, before making any investment decision. This material is for informational and educational purposes only and is not an offer to sell or the solicitation of an offer to buy the securities or other instruments mentioned. This material does not constitute a personal recommendation or take into account the particular investment objectives, financial situations, or needs of individual investors which are necessary considerations before making any investment decision. Investors should consider whether any advice or recommendation in this research is suitable for their particular circumstances and, where appropriate, seek professional advice, including legal, tax, accounting, investment, or other advice. The views expressed herein are solely those of Steve Blumenthal as of the date of this report and are subject to change without notice.
Investing involves risk.
This letter may contain forward-looking statements relating to the objectives, opportunities, and future performance of the various investment markets, indices, and investments. Forward-looking statements may be identified by the use of such words as; “believe,” anticipate,” “planned,” “potential,” and other similar terms. Examples of forward-looking statements include, but are not limited to, estimates with respect to financial condition, results of operations, and success or lack of success of any particular market, index, investment, or investment strategy. All are subject to various factors, including, but not limited to, general and local economic conditions, changing levels of competition within certain industries and markets, changes in legislation or regulation, Federal Reserve policy, and other economic, competitive, governmental, regulatory, and technological factors affecting markets, indices, investments, investment strategy and portfolio positioning that could cause actual results to differ materially from projected results. Such statements are forward-looking in nature and involve a number of known and unknown risks, uncertainties, and other factors, and accordingly, actual results may differ materially from those reflected or contemplated in such forward-looking statements. Investors are cautioned not to place undue reliance on any forward-looking statements or examples. All statements made herein speak only as of the date that they were made. Investing is inherently risky and all investing involves the potential risk of loss.
Past performance does not guarantee or indicate future results. Different types of investments involve varying degrees of risk, and there can be no assurance that the future performance of any specific investment, investment strategy, or product (including the investments and/or investment strategies recommended or undertaken by CMG), or any non-investment related content, made reference to directly or indirectly in this commentary will be profitable, equal any corresponding indicated historical performance level(s), be suitable for your portfolio or individual situation or prove successful. Due to various factors, including changing market conditions and/or applicable laws, the content may no longer be reflective of current opinions or positions. Moreover, you should not assume that any discussion or information contained in this commentary serves as the receipt of, or as a substitute for, personalized investment advice from CMG. Please remember to contact CMG, in writing, if there are any changes in your personal/financial situation or investment objectives for the purpose of reviewing/evaluating/revising our previous recommendations and/or services, or if you would like to impose, add, or to modify any reasonable restrictions to our investment advisory services. Unless, and until, you notify us, in writing, to the contrary, we shall continue to provide services as we do currently. CMG is neither a law firm, nor a certified public accounting firm, and no portion of the commentary content should be construed as legal or accounting advice.
No portion of the content should be construed as an offer or solicitation for the purchase or sale of any security. References to specific securities, investment programs or funds are for illustrative purposes only and are not intended to be, and should not be interpreted as recommendations to purchase or sell such securities.
This presentation does not discuss, directly or indirectly, the amount of the profits or losses realized or unrealized, by any CMG client from any specific funds or securities. Please note: In the event that CMG references performance results for an actual CMG portfolio, the results are reported net of advisory fees and inclusive of dividends. The performance referenced is that as determined and/or provided directly by the referenced funds and/or publishers, has not been independently verified, and does not reflect the performance of any specific CMG client. CMG clients may have experienced materially different performance based upon various factors during the corresponding time periods. See in links provided citing limitations of hypothetical back-tested information. Past performance cannot predict or guarantee future performance. Not a recommendation to buy or sell. Please talk to your advisor.
Information herein has been obtained from sources believed to be reliable, but we do not warrant its accuracy. This document is general communication and is provided for informational and/or educational purposes only. None of the content should be viewed as a suggestion that you take or refrain from taking any action nor as a recommendation for any specific investment product, strategy, or other such purposes.
In a rising interest rate environment, the value of fixed-income securities generally declines, and conversely, in a falling interest rate environment, the value of fixed-income securities generally increases. High-yield securities may be subject to heightened market, interest rate, or credit risk and should not be purchased solely because of the stated yield. Ratings are measured on a scale that ranges from AAA or Aaa (highest) to D or C (lowest). Investment-grade investments are those rated from highest down to BBB- or Baa3.
NOT FDIC INSURED. MAY LOSE VALUE. NO BANK GUARANTEE.
Certain information contained herein has been obtained from third-party sources believed to be reliable, but we cannot guarantee its accuracy or completeness.
In the event that there has been a change in an individual’s investment objective or financial situation, he/she is encouraged to consult with his/her investment professional.
Written Disclosure Statement. CMG is an SEC-registered investment adviser located in Malvern, Pennsylvania. Stephen B. Blumenthal is CMG’s founder and CEO. Please note: The above views are those of CMG and its CEO, Stephen Blumenthal, and do not reflect those of any sub-advisor that CMG may engage to manage any CMG strategy, or exclusively determines any internal strategy employed by CMG. A copy of CMG’s current written disclosure statement discussing advisory services and fees is available upon request or via CMG’s internet web site at www.cmgwealth.com/disclosures. CMG is committed to protecting your personal information. Click here to review CMG’s privacy policies.