On My Radar - This Is Where We Are

April 11, 2025
By Steve Blumenthal
“My advice to every country right now is: Do not retaliate. Sit back, take it in, let’s see how it goes. Because if you retaliate, there will be escalation. If you don’t retaliate, this is the high-water mark.”
— Treasury Secretary, Scott Bessent via Fox News
Advice not taken! The U.S. suspended tariffs for 90 days, holding the baseline 10%, except for China.
China struck back, raising its import tariff from 84% to 125%.
Shots fired, the tariff war is on.
The baseline 10% and existing tariffs equate to higher inflation, slower demand, and declining corporate profits.
I frequently argue that valuations matter. The market has been overvalued for a long, long time.
Today, we’ll review our current starting conditions, looking at popular valuation measurements and a few that you’ll find unique. And we’ll consider some logical entry points. The story remains the same: We are not there yet.
Based on 61 years of corporate earnings history, the latest Median Fair Value reading puts the S&P 500 Index at 3,917 (see chart and data source below). Equities have more downside risk than upside opportunity. Recession and its impact on earnings likely take us lower. Among bear markets since 1946, the average decline with a downturn was 35.8% versus 27.9% on average without a recession. Several have declined more than 50%. Source
Grab your coffee and find your favorite chair. There are lots of charts today (but the post reads quickly). It’s been an insane week. Remember, the core issue is the level of debt in the U.S. and most developed countries. The category four market hurricane we are experiencing is one of several storms we will likely deal with until some form of grand restructuring occurs. I argue valuations matter, and a better entry point is ahead. Let’s look at some targets.
I was fortunate to spend Tuesday watching The Master’s practice round at Augusta National. In the personal section, I close this week’s OMR with a warm story.
On My Radar:
Valuations - This is Where We Are
What is Going on With Bond Yields?
Trade Signals: Druckenmiller On CNBC
Personal Note: The Masters
See Important Disclosures at the bottom of this page. Reminder: This is not a recommendation to buy or sell any security. My views may change at any time. The information is for discussion purposes only.
If you like what you are reading, you can subscribe for free.

Valuations - This is Where We Are
Median Price/Earnings Ratio (an oldie but a goodie)
Over the last 61.1 years, the Median PE is 17.9
As of 3-31-25, the Median PE is 25.6
Timing is always imperfect, but the idea is to understand when investors get a good return on their money. Pundits tell you that you will get 10% per year over a long period of investing in equities.
Think of “median fair value” (yellow highlight below) as the starting point at which 10% of annual returns are more likely to be received.

Price to Book (P/B), Price to Discount (P/D), Price to Earnings (P/E) Here’s how to read the following chart:
I know this chart looks complex. Let me simplify.
Both red “We are here” arrows show our current starting conditions.
Now, take a look at the long-term dotted trend line. Over time, stocks go up. But I want you to focus on the circles at the top and the circles at the bottom of the trend line.
Look at L, M, and O. The three circles are in the upper right.
Let’s use M as an example: Look at the data box in the lower right. Then look at M. It shows you what the P/B, P/D, P/E, and yields were (a high valuation starting condition).
Compare those numbers to where we are today, “CURRENT.” Price to Book is 4.4 now and 2.9 then. P/D is 74.3 now vs. 57.4 then. P/E is 23.6 now vs. 27.8 then. TBills are lower today vs then, and the 30-year is slightly lower today.
You can compare other periods. Better yet, the data box in the upper left shows the Average for each at Secular highs and the Average for each at Secular lows.
The bottom line is that we don’t need to time Secular Lows to achieve good returns. We need to get to fair value, and my best back-of-the-napkin guess is that the number is below 4,000 in the S&P 500 Index.

Source: NDR
Let’s look at a few more:
The Buffett Indicator
Bottom line: Not 2021 crazy overvalued but well above the 2000 high.

Source: AdvisorPerspectives.com
Price to Gross Domestic Income
Bottom line: Look to the yellow highlight “We are here” to see subsequent returns. “We’d be better here.”

Source: NDR
Hussman’s Favorite
From John Hussman, “Presently, our primary gauge of market internals might best describe market behavior as ragged and unraveling. Valuations remain beyond the 1929 and 2000 extremes, implying 10-12 year S&P 500 total returns on the order of -5% annually by our estimates, while being permissive of a full-cycle loss on the order of 73% in the S&P 500 simply to restore valuation norms historically associated with run-of-the-mill expected returns of 10% annually.
The chart below shows our most reliable valuation measure, based on its correlation with actual subsequent S&P 500 total returns in market cycles across history, in data since 1928. The blue line shows the market capitalization of U.S. nonfinancial equities as a ratio to their gross value-added, including our estimate of foreign revenues. MarketCap/GVA presently remains beyond both the 1929 and 2000 extremes.”
Bottom line: Note the 04/03/25 arrow at the bottom right. He is projecting ~ -5% nominal annual total return for the S&P 500 Index. Source: Hussman Funds

Source: Hussman Funds
Shiller PE
Improving, but still in top 10% of all readings dating back to 1850.

Source: Shiller
Subsequent Returns By Decile
I love the data in the following chart. It shows the total annualized returns over 10 years, looking at all 10-year periods from 1909 through 2024, ranked from the highest 10% of all readings to the lowest 10%.
The current Shiller PE puts us in DECILE 1. “We are here.”
We’d be better off when the Shiller PE approaches 18. DECILE 6 or lower.
Note the Average Beginning P/E, Average Ending P/E, and the range of returns, which shows the worst 10-year return, the best 10-year return, and the Average Return by Decile. Cool data from our friend Ed Easterling at Crestmont Research.

Source: CrestmontResearch.com
One last comment in terms of the pressure the dollar is under. I believe it is due to foreign investors selling U.S. equities and taking their money home. Why in the world do we want to piss off our good friends?
The dollar's stress is undoubtedly related to the tariff war. Imagine the selling pressure that may be coming from international owners of U.S. equities selling and repatriating their money. Sell Apple in dollars and convert dollars to Euros, Yen, or whatever. The Mag-7 are down more than other stocks (value stocks, for example).
Nearly 40% of the S&P 500 Cap Weighted Index comprised just 10 stocks. Think of it this way: The total market capitalization of the U.S. equity market is approximately $52 trillion as of early April 2025. The S&P 500, which covers about 80% of this market, has a market cap of around $49.8 trillion as of March 31, 2025.
Currently, 35.48% make up only ten stocks. That’s ~ $17.5 trillion in ten stocks.
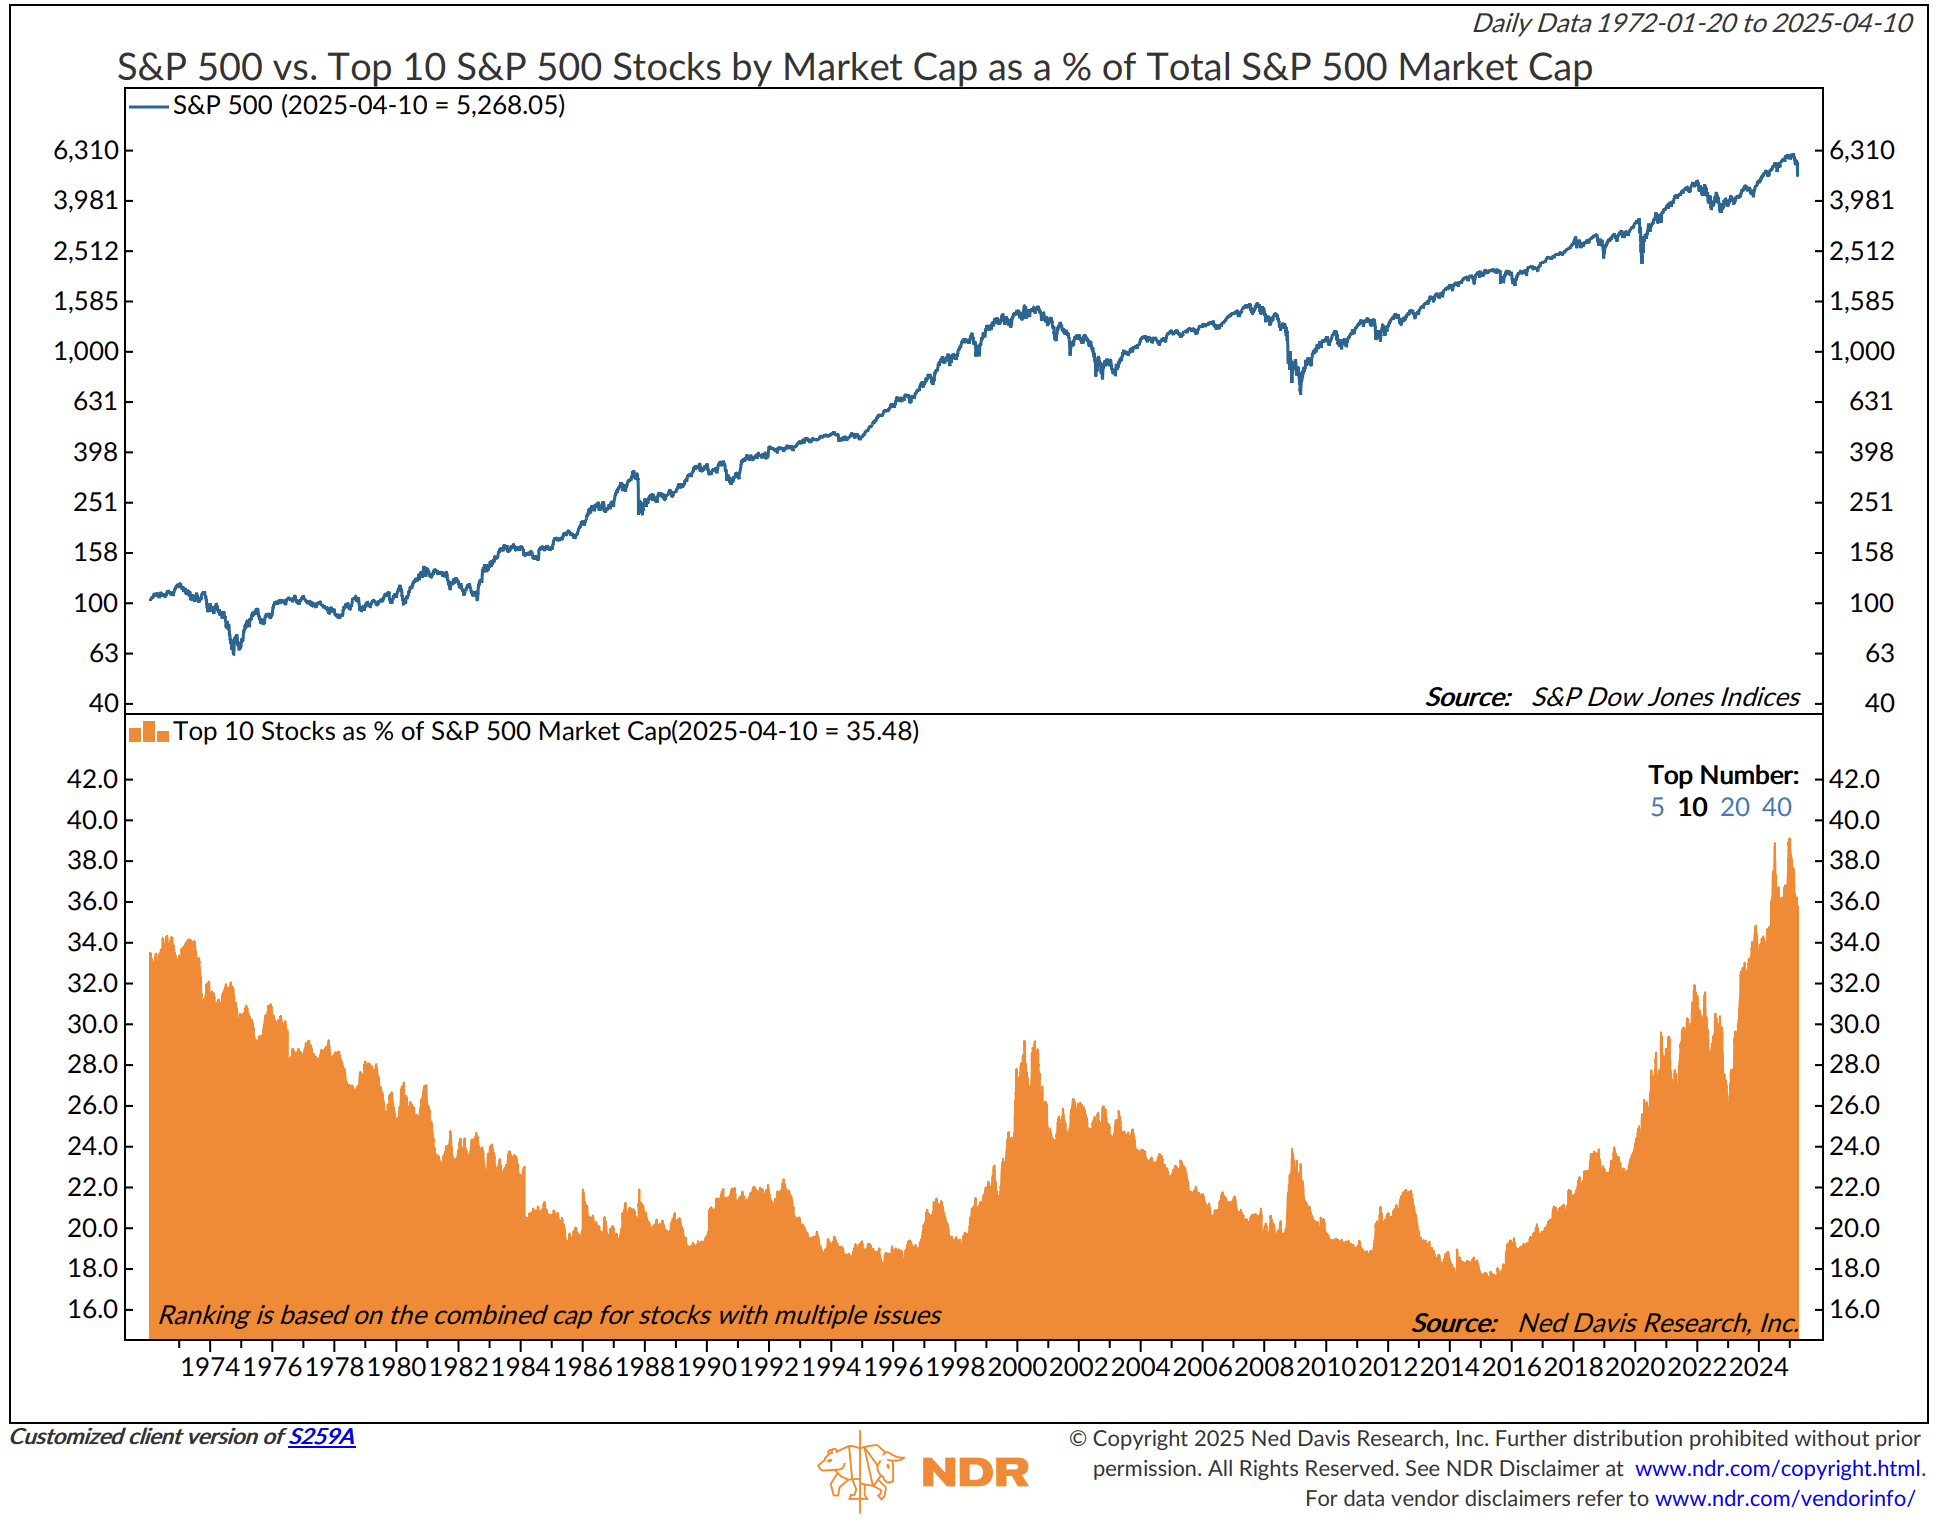
Source: NDR
Further below, foreign institutions own about 20% of the U.S. market. Source: Apollo.
I went to NDR to see what their data shows. The foreign ownership of U.S. Equities (bottom section) was 17.8% at the end of December 2024. Take a look at the growth in U.S. exposure over time. Those investors have helped support the U.S. capital markets and U.S. businesses.
Piss enough people off and the money starts to walk. Throw a monkey wrench in the global economic ecosystem, and the money starts to walk. We are seeing a sharp decline in the dollar over the last month.

Source: NDR
They are subject to change. No guarantees can be made. Risk exists in everything.
Please note that the information provided is not recommended for buying or selling any security and is provided for discussion purposes only. Current viewpoints are subject to change. The information provided is not recommended for buying or selling any security and is provided for discussion purposes only.
What is Going on With Bond Yields?
“The bottom line is that what stands out the most today is the continued weakness in the US dollar. The DXY is having its worst percentage day since November 2022 and is nearing 100. The last time it broke 100 was in July 2023. This is happening obviously with US stock and long-end bond weakness, and it just smells of foreign flight from US assets. I include again the chart from Torsten Slok below, measuring the foreign holdings of stocks and bonds, including corporates.
For every tick down in the US dollar, the more expensive these tariffs are going to be for us.”
SB here: I post the following chart each week in Trade Signals. Peter's point is that when the dollar is high in value relative to other currencies, U.S. consumers get more bang for the buck. If it goes down, you need more dollars to buy the same thing.

Source: StockCharts.com

Source: Apollo, via Peter Boockvar
In summary, this week's 10-year and 30-year auctions were good in terms of participation (the bid-to-cover ratio was slightly above its month average, according to Peter) and yield levels held through he auction.
Over the past few weeks, the yields on the 10-year and 30-year bonds have jumped higher. One rumor in the market is that the Chinese are selling off their Treasury bond holdings. I don’t believe that is what is happening.
My friend Barry Habib and his team at MBS Highway put that rumor to bed. I just love how Barry explains the complex in a way that most can better understand. Following are my short bullet point summary notes and a link to the short video courtesy of Barry. What’s going on in the Treasury market, it’s not the Chinese selling our bonds, it’s leverage unwinding in the basis point trade. Interesting stuff - worth the watch.
First, my Bullet Point Notes (April 10, 2025)
MBS Highway’s comprehensive update on market dynamics focused on tariffs, bond market volatility, and recent economic indicators.
Key Takeaways
US suspended additional tariffs for 90 days, maintaining 10% baseline tariff (except for China)
Bond market volatility explained by margin calls and the "basis trade" (1T$ market, 100x leverage common)
China is not dumping US Treasuries; its holdings decline due to natural maturity
CPI data shows tame inflation (2.8% YoY), with gasoline prices contributing to a favorable headline reading
Tariff Update
US suspended additional tariffs for 90 days, excluding China
10% baseline tariff remains in place for most countries
China added to its tariffs
Several countries reportedly offering concessions
Bond Market Volatility Explained
There has been an unusual simultaneous decline in both equities and bonds
Triggered by a sudden equity decline, causing margin calls, leading to treasury liquidations
The "Basis trade" significantly impacts the market (3% of the $29T liquid treasury market, ~$1T)
Traders buy treasuries and sell futures contracts to profit from inefficiencies.
Up to 100x leverage is common, amplifying gains but also risks
Recent market moves forced liquidations, exacerbating treasury yield increases
China's Treasury Holdings
China holds $760B in US Treasuries (3rd largest foreign holder after Japan and UK)
They are not selling treasuries; their holdings decline due to natural maturity.
China is not reinvesting when the bonds mature
Selling would result in massive losses for China (many of their Treasury holdings earn 1-3% coupons)
Chinese Yuan weakening vs USD, contradicts the idea that they are selling their treasury holdings
China is likely to purchase US equities and treasuries to manage its currency
Inflation Data (CPI)
Headline CPI: -0.1% MoM (vs +0.1% expected)
Core CPI (ex-food & energy): +0.3% MoM, 2.8% YoY (down from 3.1%)
Gasoline prices down 6% MoM, major contributor to favorable reading
Shelter costs increased 0.22%, tempered by -3.5% in lodging away from home
Motor vehicle insurance costs decreased 0.8% MoM
Real-time rental data suggests CPI would be 1.7% without shelter lag
Other Economic Indicators
Initial jobless claims rose slightly
Continuing claims up to 1.85 million
10-year Treasury auction graded "A", helping lower yields
PPI data expected Friday (April 11, 2025)
Video replay (Click on the image):

Source: MBS Highway
The views expressed are Peter’s and Barry’s. They are subject to change. No guarantees can be made. Risk exists in everything.
Please note that the information provided is not recommended for buying or selling any security and is provided for discussion purposes only. Current viewpoints are subject to change. The information provided is not recommended for buying or selling any security and is provided for discussion purposes only.
Trade Signals: Druckenmiller CNBC Clip
I'm sharing the following link as a reminder that the bigger issue is debt and entitlement promises—a lesser of two evils! Watch the short clip…

Source: @APompliano

TRADE SIGNALS SUBSCRIPTION ACKNOWLEDGEMENT / IMPORTANT DISCLOSURES
The views expressed herein are solely those of Steve Blumenthal as of the date of this report and are subject to change without notice. Not a recommendation to buy or sell any security.
Please note that the information provided is not recommended for buying or selling any security and is provided for discussion purposes only. Current viewpoints are subject to change. Please note that the information provided is not recommended for buying or selling any security and is provided for discussion purposes only.
Personal Note: The Masters
"The Masters is a tournament that has a special charm, a special aura, because it is played on the same course every year, and the players come to know it so well."
— Bobby Jones, Golfing Legend, Co-founder of the Masters and Augusta National
As a young sports fan, I remember the excitement of watching The Masters with my father. I’d prop up a pillow under the coffee table and watch on what looked like a gem of a black and white TV. No 75” flat screens back then. No color TV either.
Chris Schenkel was ABC’s lead voice for golf, including the Masters, and had a smooth style. He covered the sport in the 1960s and 1970s. I’m sure you remember the great Jim McKay and his remarkable ability to tell a story. Jack Whitaker and Pat Summerall. Summerall covered golf, including The Masters, before he became a legendary football broadcaster.
Dad was an avid golfer with a bit of a funky swing. He’d always call me on a Monday, reporting in that he just figured out what he’d been doing wrong. That repeated for many years. We imperfect beings seek that rare perfect swing, that rare spectacular round. Golf is such a challenging game. I have his Phillies hat in my office, and after dad passed, my sister found the following note stuck inside his baseball glove. I know he tucked it inside more than a few golf hats to pull out during a round as a reminder.

Source: Marv and Amy
I flew to Augusta, Ga., early Monday morning. We played eight holes of golf at Champion’s Retreat Golf Club before the rain halted our round. On Tuesday, I walked Augusta National, watching the practice round—all the big names. There is something magical about that place.
Magic turned more magical. As I approached the 10th tee box, I noticed the name Beck on the back of the caddie’s bib. “That’s Finn’s player, Evan Beck,” I said to my friends. I’ve heard about him for several years from my dear friend Mark Finn.
Short story: Beck came to Mark several years ago and told him his game was a mess and asked for help. Mark started coaching him and gave him an analyst job at his firm.
You’ve heard me talk about Mark before. Mark runs an investment consulting firm in Virginia Beach and, years ago, led the State of Virginia retirement system. He’s a mentor, teacher, and wonderful friend to me and many others.
Beck won the prestigious USGA Mid-Amateur event at Kinloch Golf Club in Virginia, which earned him exemptions into the 2025 U.S. Open and the 2025 Masters. He now lives in the DC area, and Mark coaches him on weekends.
As I watch Beck tee off on 10, I look to the right and see Mark. I quietly positioned myself, shoulder to shoulder, next to Mark, leaned in and whispered in his ear, “I hear this Beck kid is pretty good and has an outstanding golf coach… some guy named Mark Finn.”
Mark slowly turns his head, looks at me, smiles, and gives me a big hug. We walked 10 and 11 together. On the 10th green, Beck caught up with Jordan Spieth and joined him for the last eight holes. The Masters - imagine that feeling for Evan Beck and his great Coach Mark Finn!
I was fortunate to play Augusta National in 2019, and while there, I quietly placed some of my father’s ashes, which I had tucked in a small envelope inside my golf bag, behind the 12th tee. Amen Corner. After watching Beck get up and down to par 11, I left Mark for a flight home. But before I raced away, I stopped behind the 12th tee box, and said a prayer to my old man. Back-and-white TV no more; this was real life in high definition—another happy moment for me and Dad.
If you are watching, enjoy the tournament. I see Rory is on fire this Friday afternoon and near the top of the leaderboard.

Source: Masters.com
Lastly, here are a few pictures from Tuesday at the Masters (no cameras or cell phones allowed on the property).

Steve and Mike / Terry, Mike, Steve and Joe

Terry, Mike, Steve and Joe 2025 Masters Tuesday practice round
Thanks for indulging me.
Wishing you a wonderful week! Enjoy The Masters.
With kind regards,
Steve
You can share this letter on X by clicking here.
You can share this letter on LinkedIn by clicking here.
Subscribe to OMR for free by clicking the photo.
Stephen B. Blumenthal
Executive Chairman & CIO
CMG Capital Management Group, Inc.
75 Valley Stream Parkway, Suite 201, Malvern, PA 19355
Private Wealth Client Website
CMG Customer Relationship Summary (Form CRS)
Metric-Financial, LLC Customer Relationship Summary (Form CRS)

Stephen Blumenthal founded CMG Capital Management Group in 1992 and serves today as its Executive Chairman and CIO. Steve authors a free weekly e-letter entitled, “On My Radar.” Steve shares his views on macroeconomic research, valuations, portfolio construction, asset allocation and risk management. Author of Forbes Book: On My Radar, Navigating Stock Market Cycles.
Follow Steve on X @SBlumenthalCMG and LinkedIn.
IMPORTANT DISCLOSURE INFORMATION
This document is prepared by CMG Capital Management Group, Inc. (“CMG”) and is circulated for informational and educational purposes only. There is no consideration given to the specific investment needs, objectives, or tolerances of any of the recipients. Additionally, CMG’s actual investment positions may, and often will, vary from its conclusions discussed herein based on any number of factors, such as client investment restrictions, portfolio rebalancing, and transaction costs, among others. Recipients should consult their own advisors, including tax advisors, before making any investment decision. This material is for informational and educational purposes only and is not an offer to sell or the solicitation of an offer to buy the securities or other instruments mentioned. This material does not constitute a personal recommendation or take into account the particular investment objectives, financial situations, or needs of individual investors which are necessary considerations before making any investment decision. Investors should consider whether any advice or recommendation in this research is suitable for their particular circumstances and, where appropriate, seek professional advice, including legal, tax, accounting, investment, or other advice. The views expressed herein are solely those of Steve Blumenthal as of the date of this report and are subject to change without notice.
Investing involves risk.
This letter may contain forward-looking statements relating to the objectives, opportunities, and future performance of the various investment markets, indices, and investments. Forward-looking statements may be identified by the use of such words as; “believe,” anticipate,” “planned,” “potential,” and other similar terms. Examples of forward-looking statements include, but are not limited to, estimates with respect to financial condition, results of operations, and success or lack of success of any particular market, index, investment, or investment strategy. All are subject to various factors, including, but not limited to, general and local economic conditions, changing levels of competition within certain industries and markets, changes in legislation or regulation, Federal Reserve policy, and other economic, competitive, governmental, regulatory, and technological factors affecting markets, indices, investments, investment strategy and portfolio positioning that could cause actual results to differ materially from projected results. Such statements are forward-looking in nature and involve a number of known and unknown risks, uncertainties, and other factors, and accordingly, actual results may differ materially from those reflected or contemplated in such forward-looking statements. Investors are cautioned not to place undue reliance on any forward-looking statements or examples. All statements made herein speak only as of the date that they were made. Investing is inherently risky and all investing involves the potential risk of loss.
Past performance does not guarantee or indicate future results. Different types of investments involve varying degrees of risk, and there can be no assurance that the future performance of any specific investment, investment strategy, or product (including the investments and/or investment strategies recommended or undertaken by CMG), or any non-investment related content, made reference to directly or indirectly in this commentary will be profitable, equal any corresponding indicated historical performance level(s), be suitable for your portfolio or individual situation or prove successful. Due to various factors, including changing market conditions and/or applicable laws, the content may no longer be reflective of current opinions or positions. Moreover, you should not assume that any discussion or information contained in this commentary serves as the receipt of, or as a substitute for, personalized investment advice from CMG. Please remember to contact CMG, in writing, if there are any changes in your personal/financial situation or investment objectives for the purpose of reviewing/evaluating/revising our previous recommendations and/or services, or if you would like to impose, add, or to modify any reasonable restrictions to our investment advisory services. Unless, and until, you notify us, in writing, to the contrary, we shall continue to provide services as we do currently. CMG is neither a law firm, nor a certified public accounting firm, and no portion of the commentary content should be construed as legal or accounting advice.
No portion of the content should be construed as an offer or solicitation for the purchase or sale of any security. References to specific securities, investment programs or funds are for illustrative purposes only and are not intended to be, and should not be interpreted as recommendations to purchase or sell such securities.
This presentation does not discuss, directly or indirectly, the amount of the profits or losses realized or unrealized, by any CMG client from any specific funds or securities. Please note: In the event that CMG references performance results for an actual CMG portfolio, the results are reported net of advisory fees and inclusive of dividends. The performance referenced is that as determined and/or provided directly by the referenced funds and/or publishers, has not been independently verified, and does not reflect the performance of any specific CMG client. CMG clients may have experienced materially different performance based upon various factors during the corresponding time periods. See in links provided citing limitations of hypothetical back-tested information. Past performance cannot predict or guarantee future performance. Not a recommendation to buy or sell. Please talk to your advisor.
Information herein has been obtained from sources believed to be reliable, but we do not warrant its accuracy. This document is general communication and is provided for informational and/or educational purposes only. None of the content should be viewed as a suggestion that you take or refrain from taking any action nor as a recommendation for any specific investment product, strategy, or other such purposes.
In a rising interest rate environment, the value of fixed-income securities generally declines, and conversely, in a falling interest rate environment, the value of fixed-income securities generally increases. High-yield securities may be subject to heightened market, interest rate, or credit risk and should not be purchased solely because of the stated yield. Ratings are measured on a scale that ranges from AAA or Aaa (highest) to D or C (lowest). Investment-grade investments are those rated from highest down to BBB- or Baa3.
NOT FDIC INSURED. MAY LOSE VALUE. NO BANK GUARANTEE.
Certain information contained herein has been obtained from third-party sources believed to be reliable, but we cannot guarantee its accuracy or completeness.
In the event that there has been a change in an individual’s investment objective or financial situation, he/she is encouraged to consult with his/her investment professional.
Written Disclosure Statement. CMG is an SEC-registered investment adviser located in Malvern, Pennsylvania. Stephen B. Blumenthal is CMG’s founder and CEO. Please note: The above views are those of CMG and its CEO, Stephen Blumenthal, and do not reflect those of any sub-advisor that CMG may engage to manage any CMG strategy, or exclusively determines any internal strategy employed by CMG. A copy of CMG’s current written disclosure statement discussing advisory services and fees is available upon request or via CMG’s internet web site at www.cmgwealth.com/disclosures. CMG is committed to protecting your personal information. Click here to review CMG’s privacy policies.