On My Radar: Technical Market Tools

April 10, 2026
By Steve Blumenthal
“I always believe that prices move first and fundamentals come second.”
— Paul Tudor Jones, Source Bespoke
"The secret to investing is to figure out the value of something, and then pay a lot less."
– Joel Greenblatt, Source Bespoke
Consumer prices rose 0.9% month-over-month, in line with estimates, while inflation rose 3.3% year-over-year (vs. estimates of 3.4%), as reported by the US Bureau of Labor Statistics (BLS).
On the surface, nothing shocking.
But beneath the surface… the pressure is building.
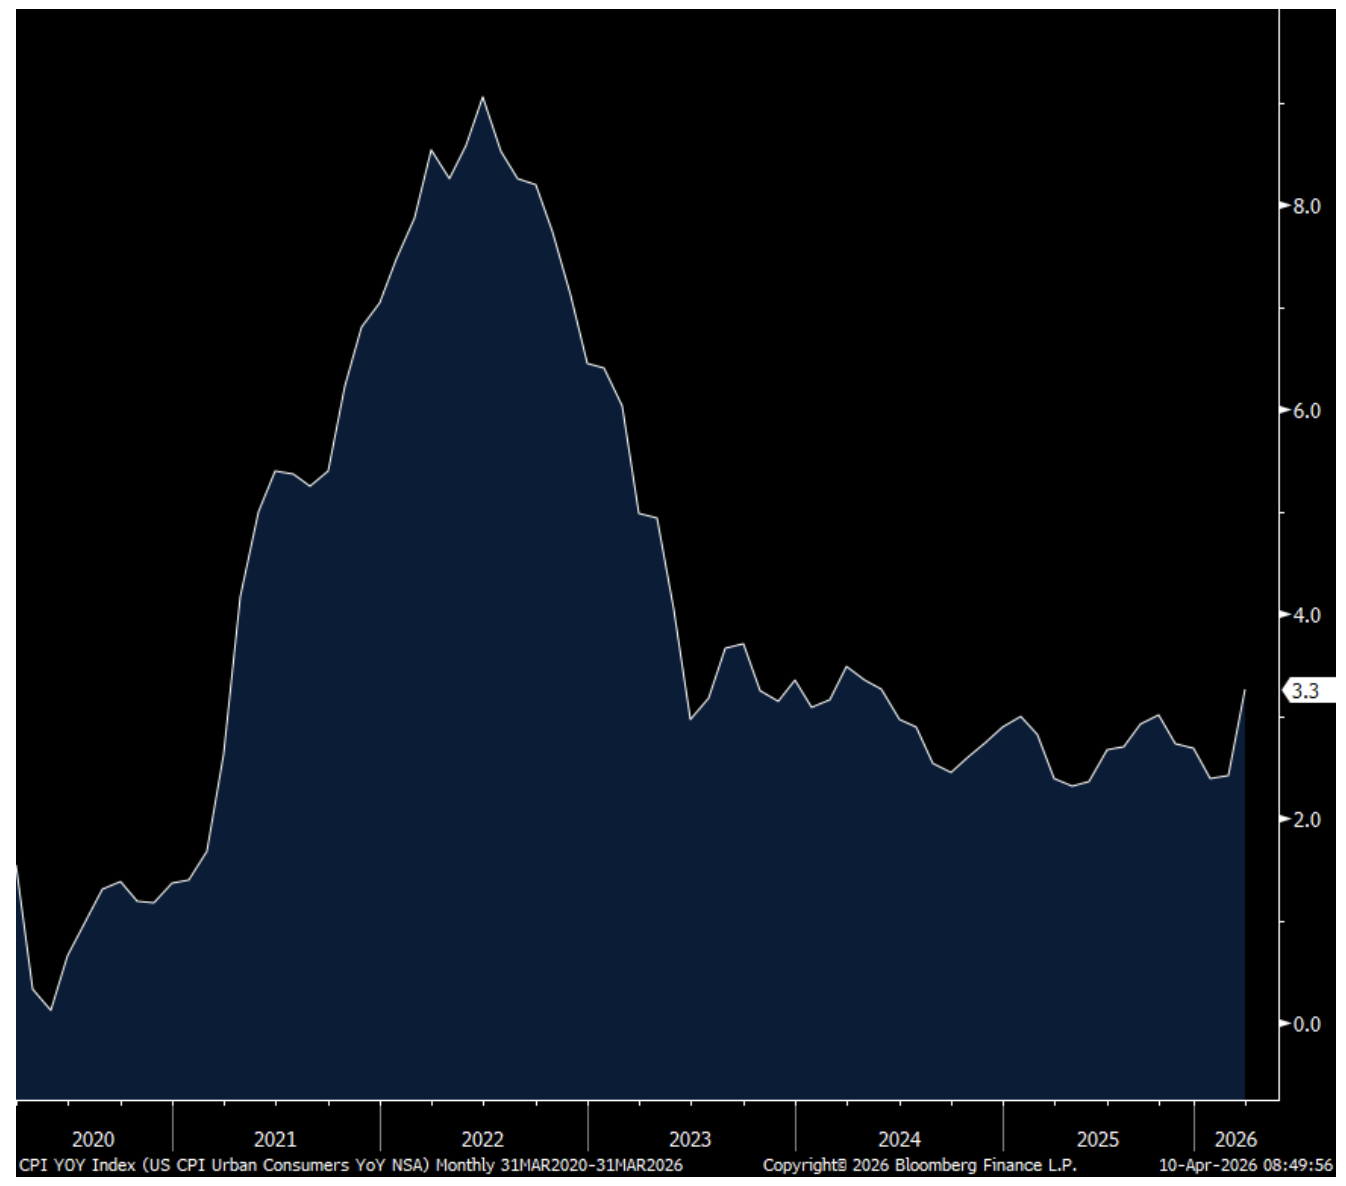
Source: Bloomberg
My friend Peter Boockvar summed it up well in his Boock Report note this morning,
“Bottom line, a not unexpectedly hot headline but more tame core. That said, we have to understand that it will take months for the higher energy prices, along with plastics, packaging, etc… to flow into the core rate.”
Peter highlighted what WD-40 said in their earnings call last night,
“Subsequent to our quarter end, recent geopolitical developments in the Middle East have contributed to the increased costs of certain petroleum based specialty chemicals and other input costs, which will impact our cost of products sold. There is typically a delay of between 90 and 120 days before changes in cost of raw materials impact our cost of products sold, due to production and inventory lifecycles.” Source: BoockReport
I’m sure you are up to speed on the latest developments in the war with Iran, so no additional comments this week. If you missed last week’s OMR titled “Mutually Assured Economic Destruction,” you can find it here.
Grab that coffee… and put on your geek glasses.
Below, I’ll walk you through what I’m seeing in price across markets — stocks, bonds, gold, commodities, and currencies. I’m also tracking Scott Bessent’s 3-3-3 plan and how it’s progressing.
Hint: Not well.
As you read, keep this from Warren Buffett top of mind:
“Cash combined with courage in a time of crisis is priceless.”
We’ll come back to what that “courage” level might look like.
Reminder: Not a recommendation for you to buy or sell anything.
On My Radar:
OMR is for informational and educational purposes only. No consideration is given to your specific investment needs, objectives, or tolerances.
Please see the Important Disclosures at the bottom of this page. Reminder: This is not a recommendation to buy or sell any security. My views may change at any time. The information is for discussion and educational purposes only.
If you like what you are reading, you can subscribe for free.

Technical Market Tools
Each week, for more years than I can remember, I look at what price is telling us about the dominant trends in the various markets. The objective is to avoid major market mistakes (risk management) and, in combination with valuation evidence, identify periods of significant opportunity.
The following is from the most recent Trade Signals post.
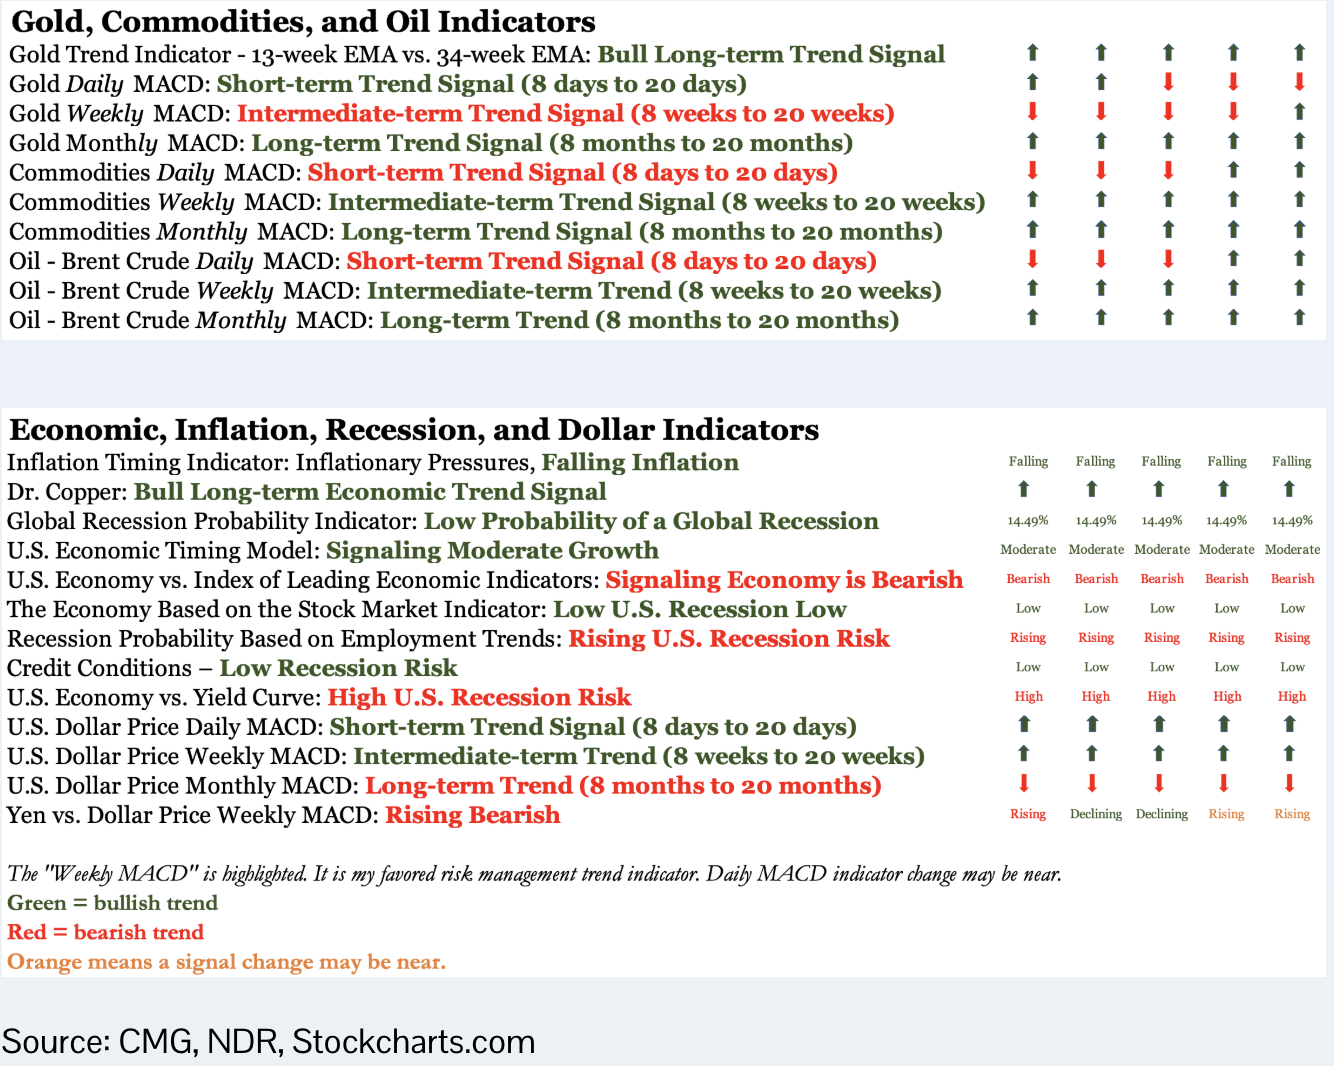
The Indicators Dashboard analyzes Daily, Weekly, and Monthly trends across major markets. The objective is to align market technicals with investment fundamentals.
Each week, I share price trend signals for the broad markets (U.S. stocks, treasury yields, international developed and emerging markets, commodities, the dollar, gold, oil, etc) broken down into three time frames:
The Daily MACD Trend is ~ 8 days to 20 days
The Weekly MACD Trend is ~ 8 weeks to 20 weeks
The Monthly MACD Trend is ~ 8 months to 20 months
I tend to favor monthly MACDs to identify the dominant investment trend and use weekly and daily MACDs for tactical trading.
The green text and arrows indicate a bullish trend, red indicates a bearish trend, and orange means a change in trend is near. The last four weeks are shown to give you a sense of trends and changes. The lower section looks at Economic, Inflation, Recession, and Currency indicators. Remember, this is a weekly dashboard to provide a broad perspective on what is happening. I plot the information each week to help me keep a finger on the pulse of the markets.
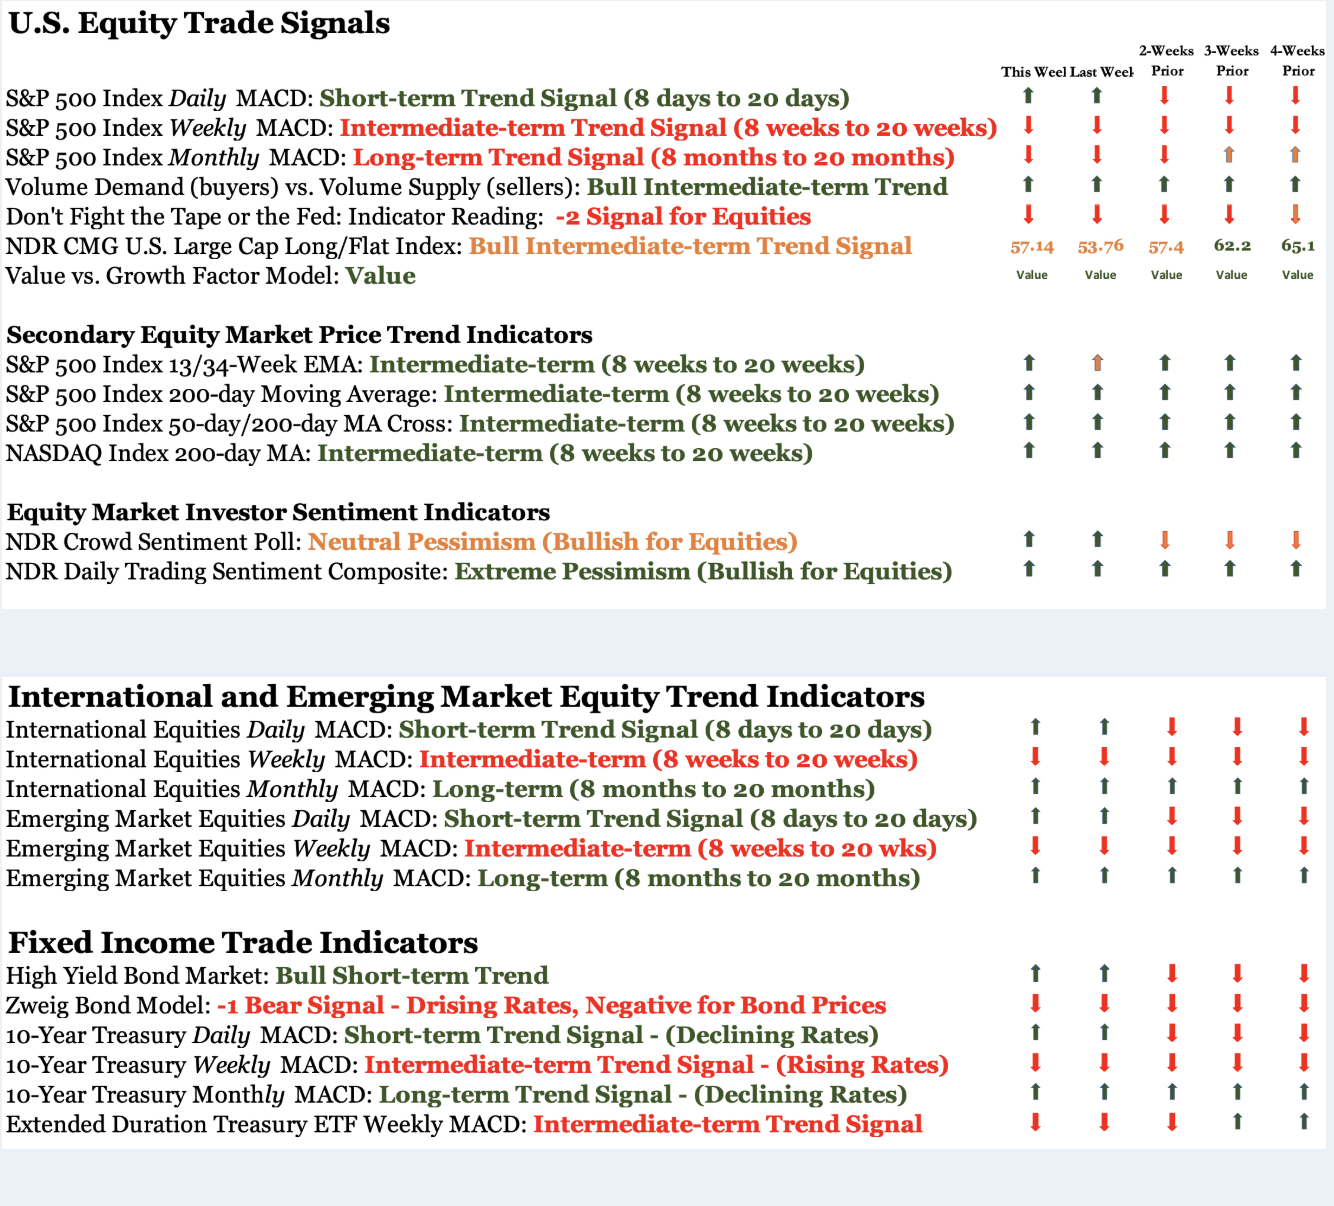
CMG Investment Research, Trade Signals
Let’s also take a look at an overall “Market Summary.” Think of it as a high-level overview of various markets, current fundamentals, and other macroeconomic indicators.
Note, you may have to expand your screen for easier viewing.
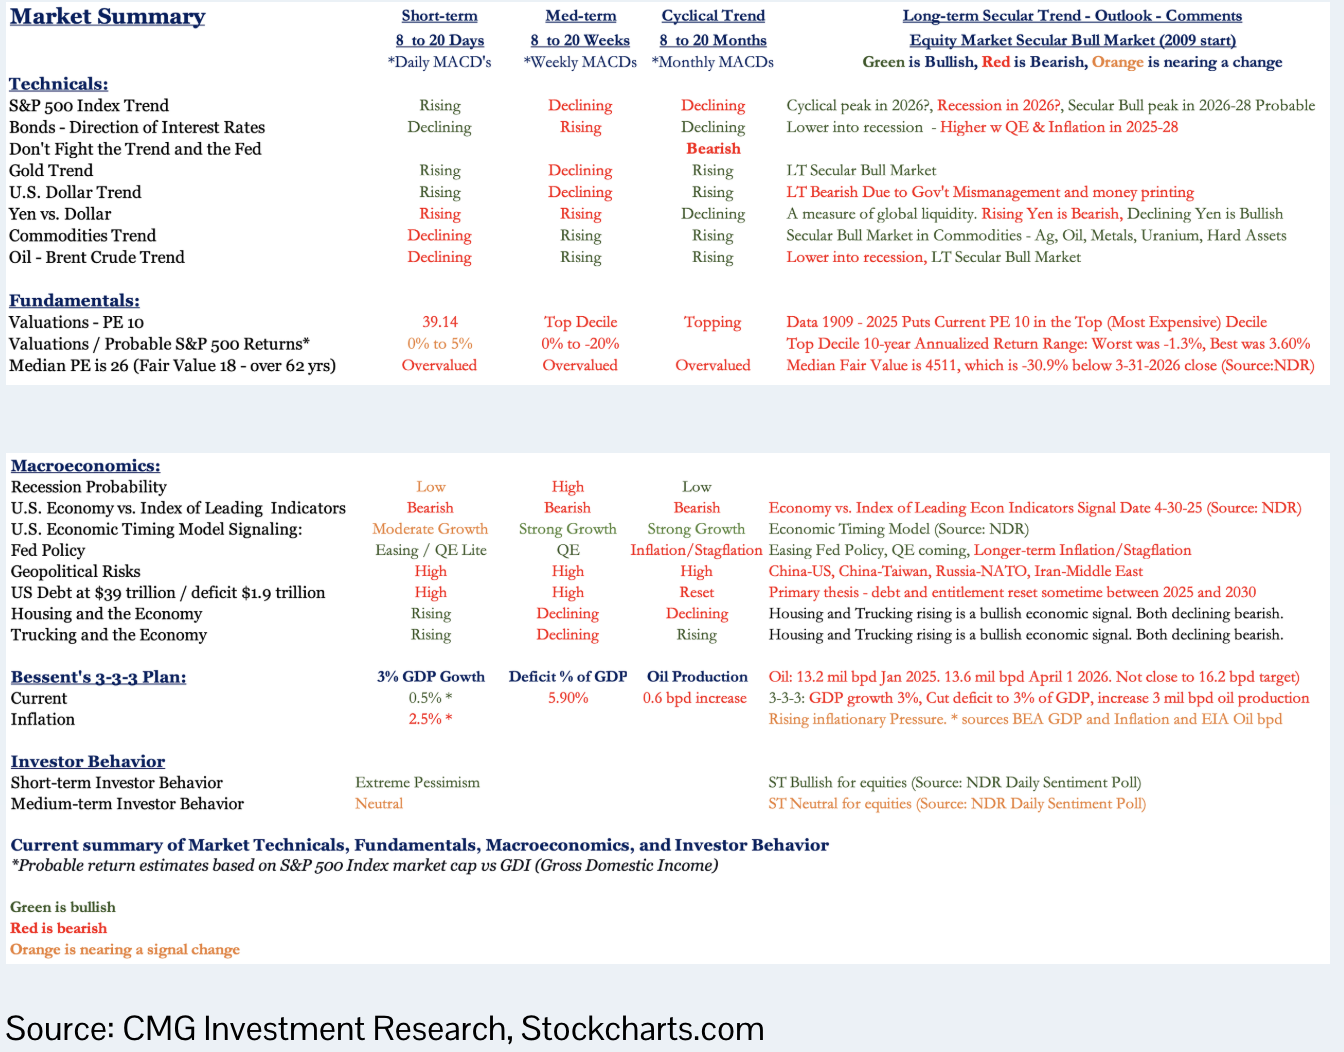
A quick note on recession: The majority of recession watch indicators show no sign of an immediate recession; thus, I rate the short-term risk as low. The orange color indicates a potential change in signal. There is still moderate growth in the U.S. economy. The Strait of Hormuz-Iran situation may prove to be a massive shock to the global economic system. We have to keep a close eye on this.
Lastly, I plot Treasury Secretary Scott Bessent’s 3-3-3 plan to see if he is hitting his mark.
Here is some color: Treasury Secretary Scott Bessent’s 3-3-3 game plan is a framework designed to improve the U.S. fiscal position (added to the Market Summary section above due to the goal's significance). Source: Advisorpedia.
If the title is highlighted red, it means he is not hitting his target. All three of the 3-3-3 are red.
3% GDP GrowthTarget— Most recent official GDP data
Q4 2025 (latest finalized): +0.5% annualized growth
This was revised down from earlier estimates (1.4% → 0.7% → 0.5%), showing a meaningful slowdown late last year
What that means
The economy decelerated sharply from +4.4% in Q3 2025 to just +0.5%
Drivers of the slowdown:
Weaker business investment
Softer consumer spending
Drag from government spending and exports
3% Budget Deficit-to-GDP Ratio — The current number is 6%. Well above Bessent’s target. With GDP at ~ $30 trillion, Bessent’s goal implies a deficit of no more than $900 billion. Today, the deficit exceeds $1.8 trillion. Put simply, the U.S. is spending around $7 trillion annually while bringing in just $5 trillion in tax revenue.
3 Million Barrel-per-Day Increase in U.S. Oil Production — The starting point was 13.2 million barrels per day (June 2025). The plan calls for boosting output by an additional 3 million barrels per day. About 13.8 million barrels per day were reported for the week ending January 2, 2026. Up .6 million bpd - well short of 3 million. We’re not there yet.
Additionally, I’ve added CPI “Inflation” to the dashboard. Red means it is currently above the Fed and Bessent’s 2% target. Not reflected in the dashboard is this morning’s 3.3% inflation print. I’ll get that updated next week.
The big picture: If Bessent’s 3-3-3 targets are met, it could mark a meaningful step toward stabilizing America’s growing debt burden. We’ll keep tracking the progress.
Bottom line: For traders, I see the current equity market environment as “sell the rallies” rather than “buy the dips.” While not perfect, the Weekly MACD does a good job at identifying the current trend. Fundamentally, I’ll be interested in the general equity market, with the S&P 500 “Median Fair Value” (based on Median PE) at ~4,500. Call that the “buy the big dip” entry target. That is about 30% below current levels. I share that chart again with you below.
It will feel like a crisis when we get there. When you are extremely scared, that will be a good buy signal.
"The secret to investing is to figure out the value of something, and then pay a lot less." Joel Greenblatt, Source Bespoke
With all that said, there are plenty of opportunities. I’m bullish on energy, metals, and commodities in general. And, if you own good, free-cash-flow companies that pay nice dividends and have low debt, keep your head down and stay the course. I’d trade fixed income vs. buy-and-hold bonds or seek bond-like alternatives. The big macro risk is rising inflation and interest rates (driven by government debt and money printing).
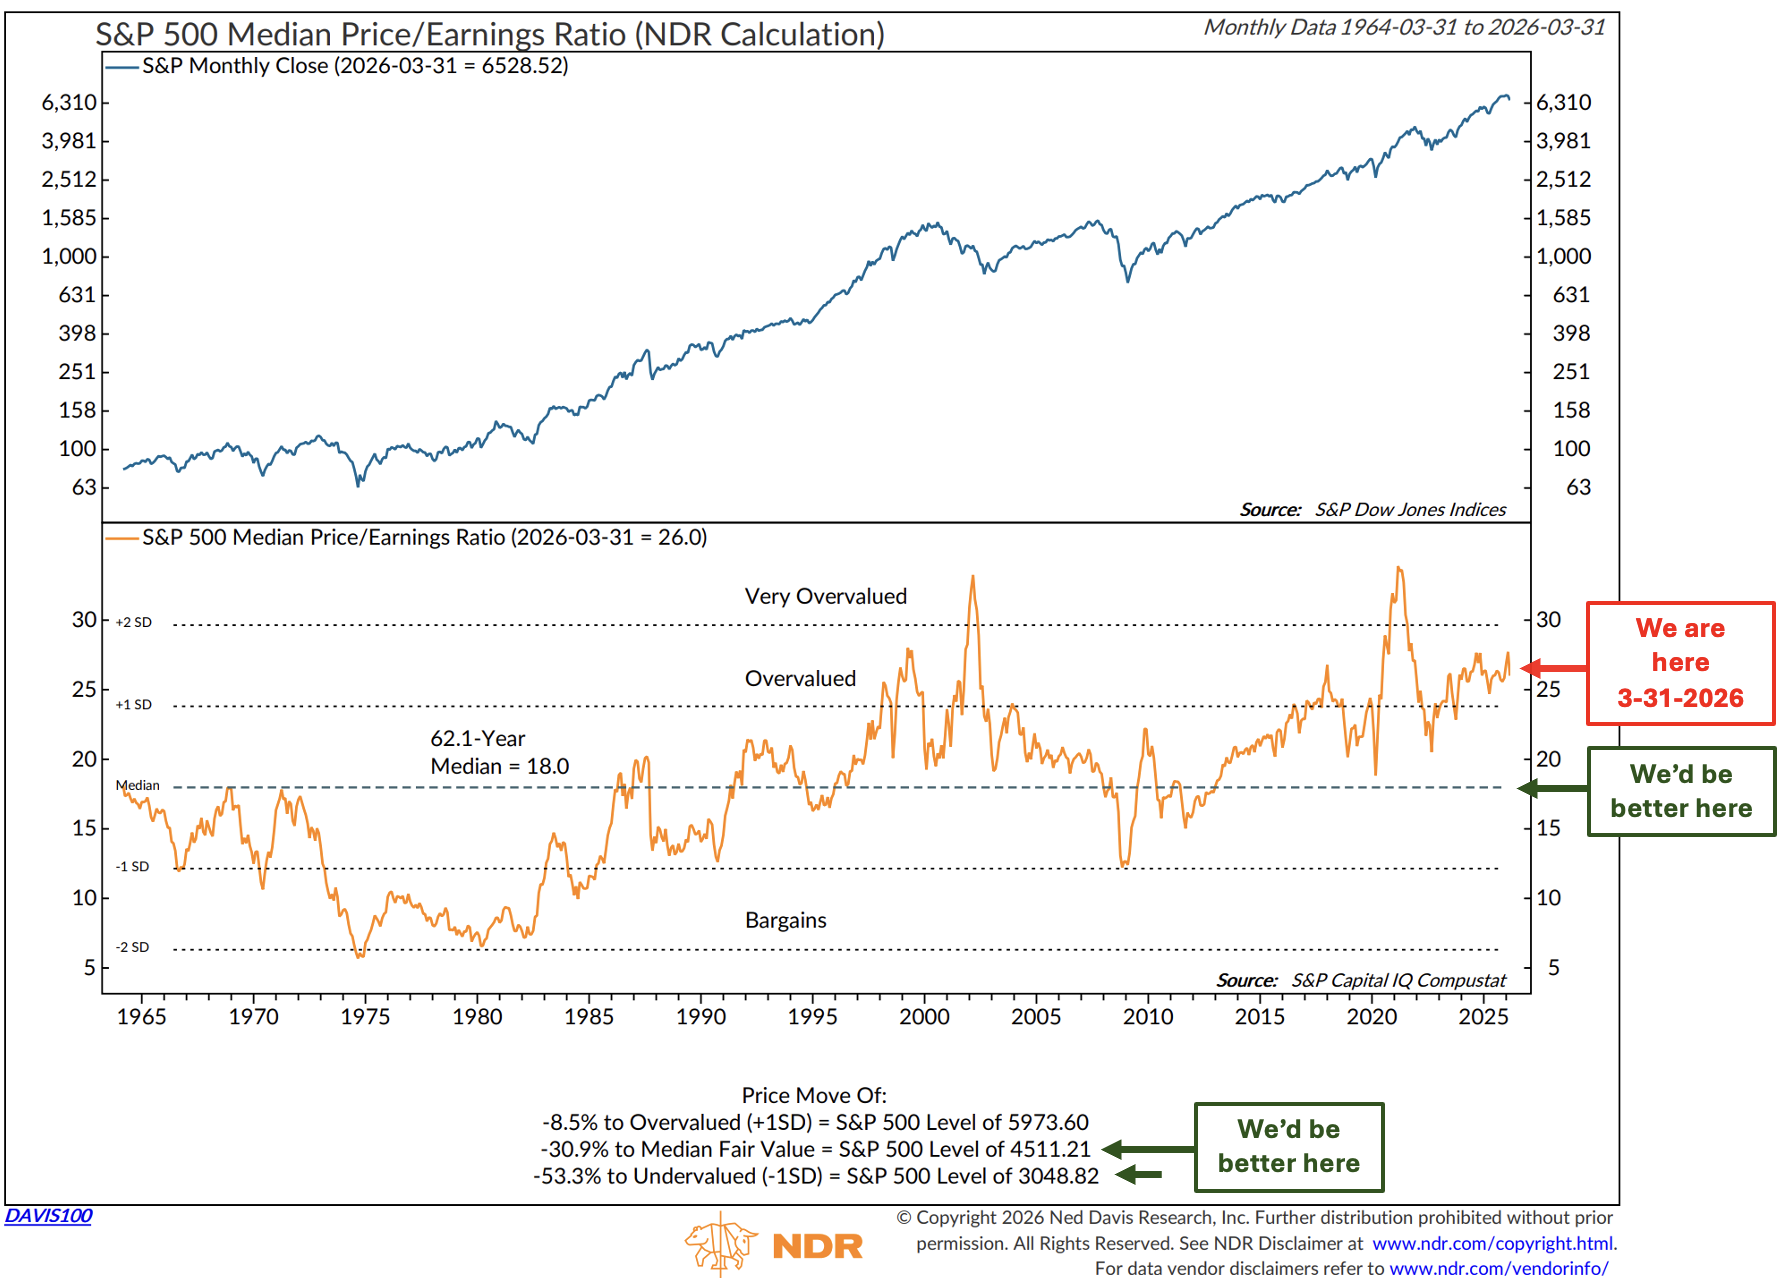
Source: NDR, CMG annontations
When a recession presents, and the market corrects, remember that investors are heavily allocated to the U.S. equities as they have ever been. I believe that most people panic as witnessed by the blue line. Sharing this next chart with you to nail home the point.
Average Equity Allocation Percentage vs Subsequent Rolling 10-Year Total Returns
The average investor equity allocation as of the latest data (12-31-25) is 55.1%. That is higher than any reading dating back to 1951.
The orange line plots the actual 10-Year rolling returns. You can see it stopped 10 years ago, since that is the last known data point.
The key point here is the high correlation between high equity allocation percentage to low subsequent 10-year returns and low equity allocation percentage to high subsequent 10-year returns.
Think about it this way. When investors are fully invested, they have less money available to buy stocks. At some point, bond yields may be high enough to pull money out of stocks and into bonds.
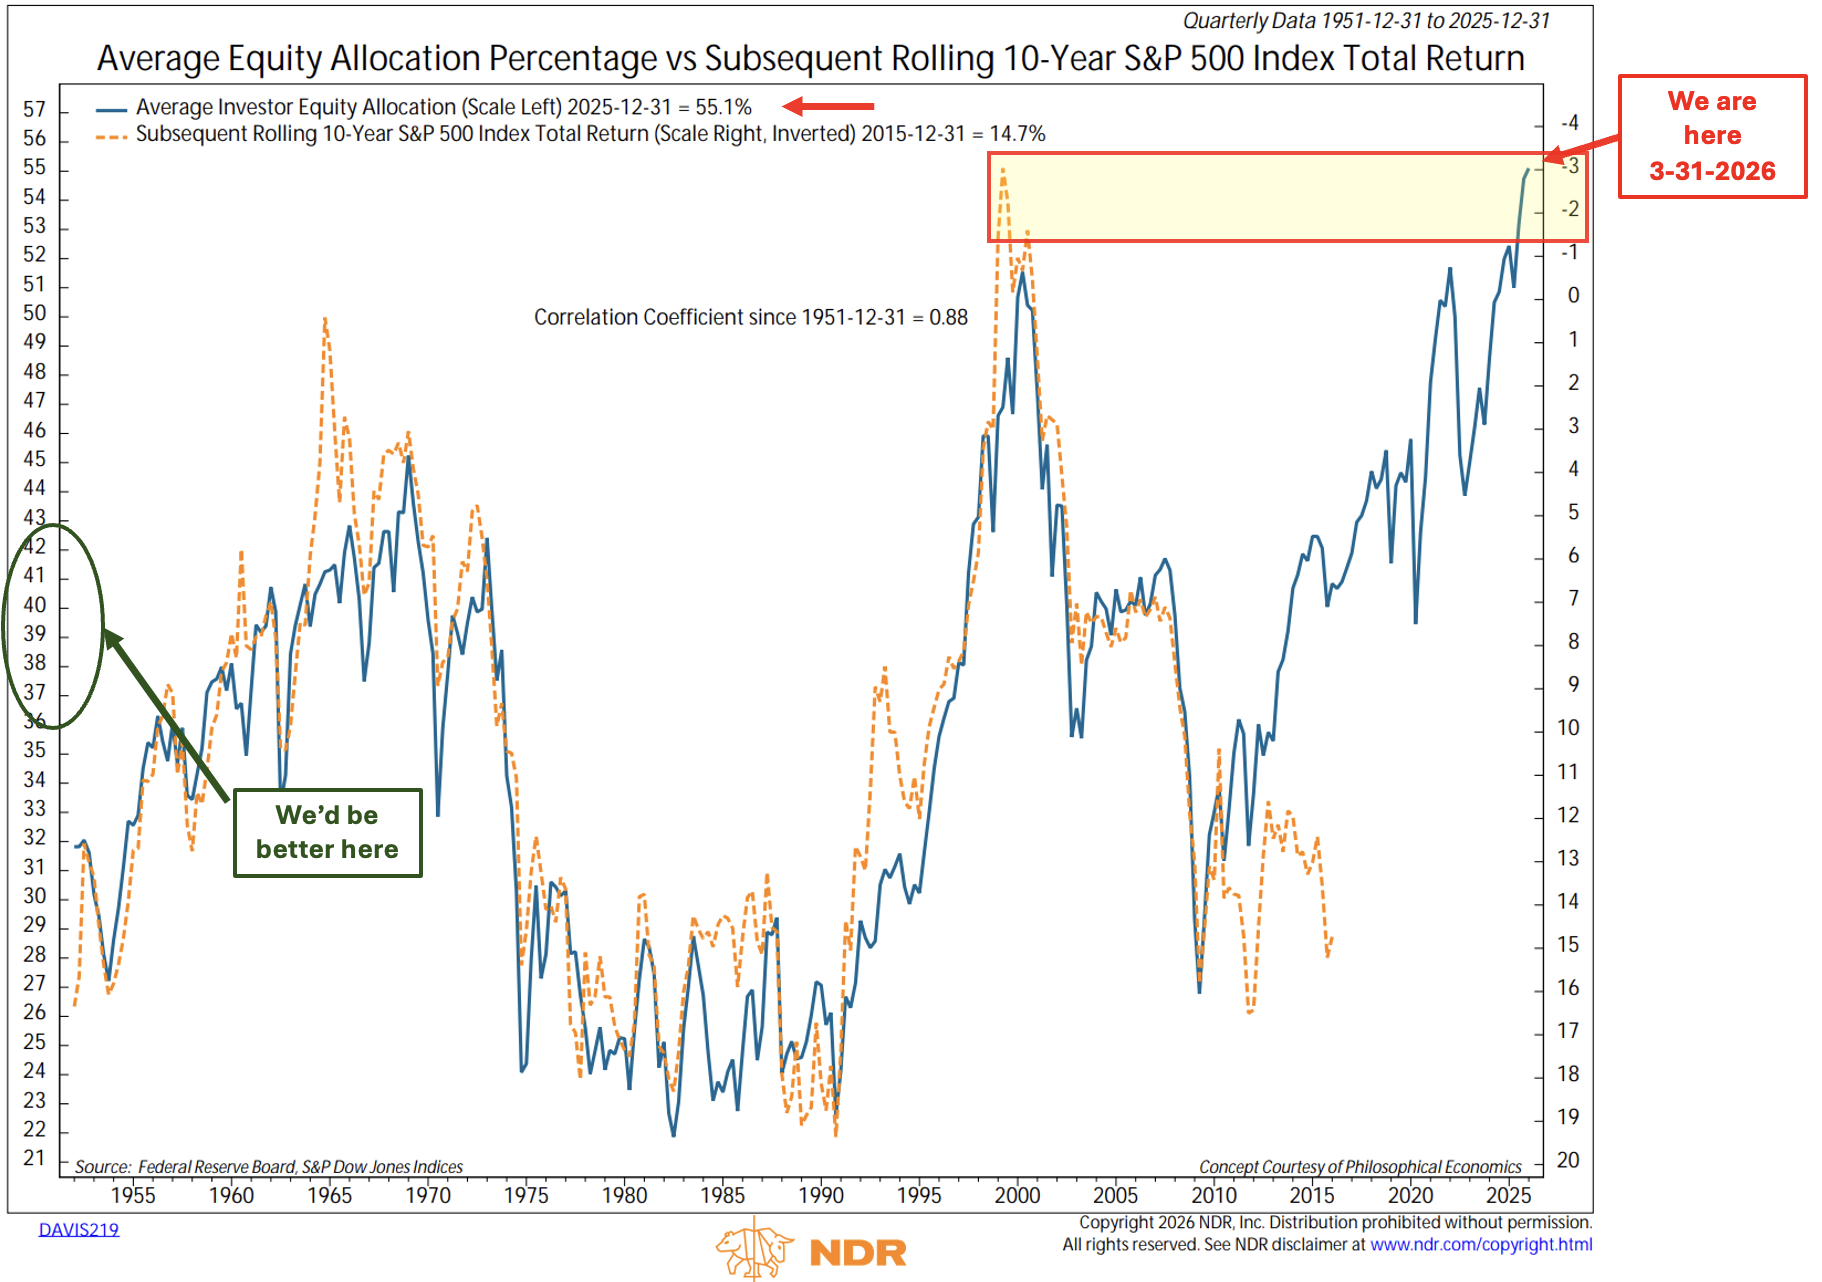
Source: NDR, CMG annontations
* No guarantees; all investing involves risk. Views are subject to change. TRADE SIGNALS SUBSCRIPTION ACKNOWLEDGEMENT / IMPORTANT DISCLOSURES
As always, this is not investment advice. For discussion purposes only. Reach out to us if you have any questions.
Views are subject to change. Not a recommendation to buy or sell any security. Please note that the information provided is not recommended for buying or selling any security and is provided for discussion purposes only. Current viewpoints are subject to change. Please note that the information provided is not recommended for buying or selling any security and is provided for discussion purposes only. See important CMG disclosures below.
If you like what you are reading, click on the following link.
CLICK HERE TO SUBSCRIBE TO ON MY RADAR - IT’S FREE
Not a recommendation to buy or sell any security. Please note that the information provided is not recommended for buying or selling any security and is provided for discussion purposes only. Current viewpoints are subject to change. Please note that the information provided is not recommended for buying or selling any security and is provided for discussion purposes only.
Trade Signals: April 9, 2026 Update
Trade Signals - subscribers only
The Indicators Dashboard - Stocks, Investor Sentiment, Bonds, Commodities, Currencies, and Gold
Valuations and Subsequent 10-year Returns
Supporting Charts with Explanations
About Trade Signals - Trade Signals is a paid subscription service that posts the daily, weekly, and monthly trends in the markets (and more). Free for CMG clients. Not a recommendation to buy or sell any security. For discussion purposes only.
“Extreme patience combined with extreme decisiveness. You may call that our investment process. Yes, it’s that simple.” – Charlie Munger

TRADE SIGNALS SUBSCRIPTION ACKNOWLEDGEMENT / IMPORTANT DISCLOSURES
The views expressed herein are solely those of Steve Blumenthal as of the date of this report and are subject to change without notice. Not a recommendation to buy or sell any security.
Please note that the information provided is not recommended for buying or selling any security and is provided for discussion purposes only. Current viewpoints are subject to change. Please note that the information provided is not recommended for buying or selling any security and is provided for discussion purposes only.
Personal Note: The Masters

The famous 12th hole at Augusta National
The Masters always feels like a time to pause and reflect.
I lost my father in 2011. He was an avid golfer and skier—the one who got me started in both at a young age. Those early days together shaped more than I probably understood at the time.
After he passed, I was fortunate to be invited to play Augusta National. That trip led to several meaningful moments… none more special than finding a way to honor him.
We were each given some of his ashes to place somewhere special. The winter before Augusta, I was with my kids at Snowbird. Standing at the top of the mountain, at around 11,000 feet, we said a prayer and released some of his ashes. Then we skied down his favorite run.
Later that year, when I told my sister Amy I’d be playing Augusta, she sent me the ashes she had been holding. “Can you place them somewhere on the course?” she asked.
“I know just the spot,” I told her.

Steve and Pop just behind the 12th Tee Box (they cover it on practice round days)
Growing up, we watched the Masters together every year—me and my siblings on the floor, propped up on pillows, Dad on the couch. It was our tradition. Maybe it is in your home, too.
Last Tuesday, I had the chance to walk a practice round. I made my way to the 12th tee, paused for a moment, and said a quiet thank you. I felt him there. That meant a lot.
I’m writing this from 30,000 feet on my way to Salt Lake City. A short drive and I’ll be in Snowbird. Three of my six kids are joining me. We’ll head back to that same spot, say a prayer, send him our love… and then ski down his favorite run.
The first run is always for Pop.
Here are a few more pictures…

Mike, Joe, Steve and Terry 10’th Hole Mike, Steve and Joe
A few days of skiing are ahead. Conditions are actually doable with some snow on Monday and Tuesday. Fingers crossed.
Family office meetings in Austin are scheduled for later this month.
Thanks for spending time with me each week. Best to you and yours!
Kind regards,
Steve
CLICK HERE TO SUBSCRIBE TO ON MY RADAR - IT’S FREE
You can share this letter on X by clicking here.
You can share this letter on LinkedIn by clicking here.
Subscribe to OMR for free by clicking the photo.
Stephen B. Blumenthal
Executive Chairman & CIO
CMG Capital Management Group, Inc.
75 Valley Stream Parkway, Suite 201,
Malvern, PA 19355
CMG Customer Relationship Summary (Form CRS)
Metric-Financial, LLC Customer Relationship Summary (Form CRS)

Stephen Blumenthal founded CMG Capital Management Group in 1992 and serves today as its Executive Chairman and CIO. Steve authors a free weekly e-letter entitled, “On My Radar.” Steve shares his views on macroeconomic research, valuations, portfolio construction, asset allocation and risk management. Author of Forbes Book: On My Radar, Navigating Stock Market Cycles.
Follow Steve on X @SBlumenthalCMG and LinkedIn.
IMPORTANT DISCLOSURE INFORMATION
This document is prepared by CMG Capital Management Group, Inc. (“CMG”) and is circulated for informational and educational purposes only. There is no consideration given to the specific investment needs, objectives, or tolerances of any of the recipients. Additionally, CMG’s actual investment positions may, and often will, vary from its conclusions discussed herein based on any number of factors, such as client investment restrictions, portfolio rebalancing, and transaction costs, among others. Recipients should consult their own advisors, including tax advisors, before making any investment decision. This material is for informational and educational purposes only and is not an offer to sell or the solicitation of an offer to buy the securities or other instruments mentioned. This material does not constitute a personal recommendation or take into account the particular investment objectives, financial situations, or needs of individual investors which are necessary considerations before making any investment decision. Investors should consider whether any advice or recommendation in this research is suitable for their particular circumstances and, where appropriate, seek professional advice, including legal, tax, accounting, investment, or other advice. The views expressed herein are solely those of Steve Blumenthal as of the date of this report and are subject to change without notice.
Investing involves risk.
This letter may contain forward-looking statements relating to the objectives, opportunities, and future performance of the various investment markets, indices, and investments. Forward-looking statements may be identified by the use of such words as; “believe,” anticipate,” “planned,” “potential,” and other similar terms. Examples of forward-looking statements include, but are not limited to, estimates with respect to financial condition, results of operations, and success or lack of success of any particular market, index, investment, or investment strategy. All are subject to various factors, including, but not limited to, general and local economic conditions, changing levels of competition within certain industries and markets, changes in legislation or regulation, Federal Reserve policy, and other economic, competitive, governmental, regulatory, and technological factors affecting markets, indices, investments, investment strategy and portfolio positioning that could cause actual results to differ materially from projected results. Such statements are forward-looking in nature and involve a number of known and unknown risks, uncertainties, and other factors, and accordingly, actual results may differ materially from those reflected or contemplated in such forward-looking statements. Investors are cautioned not to place undue reliance on any forward-looking statements or examples. All statements made herein speak only as of the date that they were made. Investing is inherently risky and all investing involves the potential risk of loss.
Past performance does not guarantee or indicate future results. Different types of investments involve varying degrees of risk, and there can be no assurance that the future performance of any specific investment, investment strategy, or product (including the investments and/or investment strategies recommended or undertaken by CMG), or any non-investment related content, made reference to directly or indirectly in this commentary will be profitable, equal any corresponding indicated historical performance level(s), be suitable for your portfolio or individual situation or prove successful. Due to various factors, including changing market conditions and/or applicable laws, the content may no longer be reflective of current opinions or positions. Moreover, you should not assume that any discussion or information contained in this commentary serves as the receipt of, or as a substitute for, personalized investment advice from CMG. Please remember to contact CMG, in writing, if there are any changes in your personal/financial situation or investment objectives for the purpose of reviewing/evaluating/revising our previous recommendations and/or services, or if you would like to impose, add, or to modify any reasonable restrictions to our investment advisory services. Unless, and until, you notify us, in writing, to the contrary, we shall continue to provide services as we do currently. CMG is neither a law firm, nor a certified public accounting firm, and no portion of the commentary content should be construed as legal or accounting advice.
No portion of the content should be construed as an offer or solicitation for the purchase or sale of any security. References to specific securities, investment programs or funds are for illustrative purposes only and are not intended to be, and should not be interpreted as recommendations to purchase or sell such securities.
This presentation does not discuss, directly or indirectly, the amount of the profits or losses realized or unrealized, by any CMG client from any specific funds or securities. Please note: In the event that CMG references performance results for an actual CMG portfolio, the results are reported net of advisory fees and inclusive of dividends. The performance referenced is that as determined and/or provided directly by the referenced funds and/or publishers, has not been independently verified, and does not reflect the performance of any specific CMG client. CMG clients may have experienced materially different performance based upon various factors during the corresponding time periods. See in links provided citing limitations of hypothetical back-tested information. Past performance cannot predict or guarantee future performance. Not a recommendation to buy or sell. Please talk to your advisor.
Information herein has been obtained from sources believed to be reliable, but we do not warrant its accuracy. This document is general communication and is provided for informational and/or educational purposes only. None of the content should be viewed as a suggestion that you take or refrain from taking any action nor as a recommendation for any specific investment product, strategy, or other such purposes.
In a rising interest rate environment, the value of fixed-income securities generally declines, and conversely, in a falling interest rate environment, the value of fixed-income securities generally increases. High-yield securities may be subject to heightened market, interest rate, or credit risk and should not be purchased solely because of the stated yield. Ratings are measured on a scale that ranges from AAA or Aaa (highest) to D or C (lowest). Investment-grade investments are those rated from highest down to BBB- or Baa3.
NOT FDIC INSURED. MAY LOSE VALUE. NO BANK GUARANTEE.
Certain information contained herein has been obtained from third-party sources believed to be reliable, but we cannot guarantee its accuracy or completeness.
In the event that there has been a change in an individual’s investment objective or financial situation, he/she is encouraged to consult with his/her investment professional.
Written Disclosure Statement. CMG is an SEC-registered investment adviser located in Malvern, Pennsylvania. Stephen B. Blumenthal is CMG’s founder and CEO. Please note: The above views are those of CMG and its CEO, Stephen Blumenthal, and do not reflect those of any sub-advisor that CMG may engage to manage any CMG strategy, or exclusively determines any internal strategy employed by CMG. A copy of CMG’s current written disclosure statement discussing advisory services and fees is available upon request or via CMG’s internet web site at www.cmgwealth.com/disclosures. CMG is committed to protecting your personal information. Click here to review CMG’s privacy policies.
See CMG Disclosures at the bottom of this page.
For more information about NDR, please visit at www.ndr.com.
NDR, Inc. (NDR), d.b.a. Ned Davis Research Group (NDRG), any NDRG affiliates or employees, or any third-party data provider, shall not have any liability for any loss sustained by anyone who has relied on the information contained in any NDRG publication. The data and analysis contained herein are provided "as is." NDRG disclaims any and all express or implied warranties, including, but not limited to, any warranties of merchantability, suitability or fitness for a particular purpose or use. NDRG's past recommendations and model results are not a guarantee of future results. This communication reflects our analysts' opinions as of the date of this communication and will not necessarily be updated as views or information change. All opinions expressed herein are subject to change without notice. NDRG or its affiliated companies or their respective shareholders, directors, officers and/or employees, may have long or short positions in the securities discussed herein and may purchase or sell such securities without notice. For NDRG's important additional disclaimers, refer to www.ndr.com/invest/public/copyright.html. Further distribution prohibited without prior permission. Copyright 2025 © NDR, Inc. All rights reserved.