On My Radar - 666 to 6,666

September 26, 2025
By Steve Blumenthal
“What an amazing, incredible, bizarre, long, strange trip it's been.”
— Peter Boockvar, The Boock Report
A short post this week with a series of charts/data you may find interesting. We examine the percentage of money allocated to U.S. equities relative to other bubble periods, assess the level of margin debt, and analyze the source of earnings for the S&P 500 Index (hint: Mag 7).
Grab your coffee, find your favorite chair. Let’s go!
On My Radar:
Charts/Data
China, Treasuries, and Gold
Plumbing Problems
Trade Signals: Euphoria
Personal Note: Tampa, Phoenix, and Team
OMR is for informational and educational purposes only. No consideration is given to your specific investment needs, objectives, or tolerances.
Please see the Important Disclosures at the bottom of this page. Reminder: This is not a recommendation to buy or sell any security. My views may change at any time. The information is for discussion and educational purposes only.
If you like what you are reading, you can subscribe for free.

Charts/Data
I vividly recall the S&P 500 Index hitting its bottom at 666 on March 6, 2009. I wrote an On My Radar note in December 2008 titled, It’s So Bad It’s Good. It turned out that Bad was not yet bad enough.
When 6,666 crossed my computer screen this week, I couldn’t help but reflect on the symmetry. The best quote that I came across this week came from my good friend, Peter Boockvar. Right on.
1) Stocks as a Percentage of Household Financial Assets
Courtesy of Ned Davis Research: Record-high allocation to stocks by households
All you really need to do is look at the chart. It shows that households, the largest holders of stocks, owned equities valued at $51.1 trillion at the end of the quarter or a record-high allocation of 50.5% of total household financial assets.
Individual investors are all-in on stocks. They have never been more bullish.
Source NDR (see important disclosures below)
A few key points:
Equities = $51.1 trillion
Total Financial Assets = $101.25 trillion
Notice the peaks and troughs over time. The late 1960s, early 1980s, 2000, 2007, 2021, and the present day.
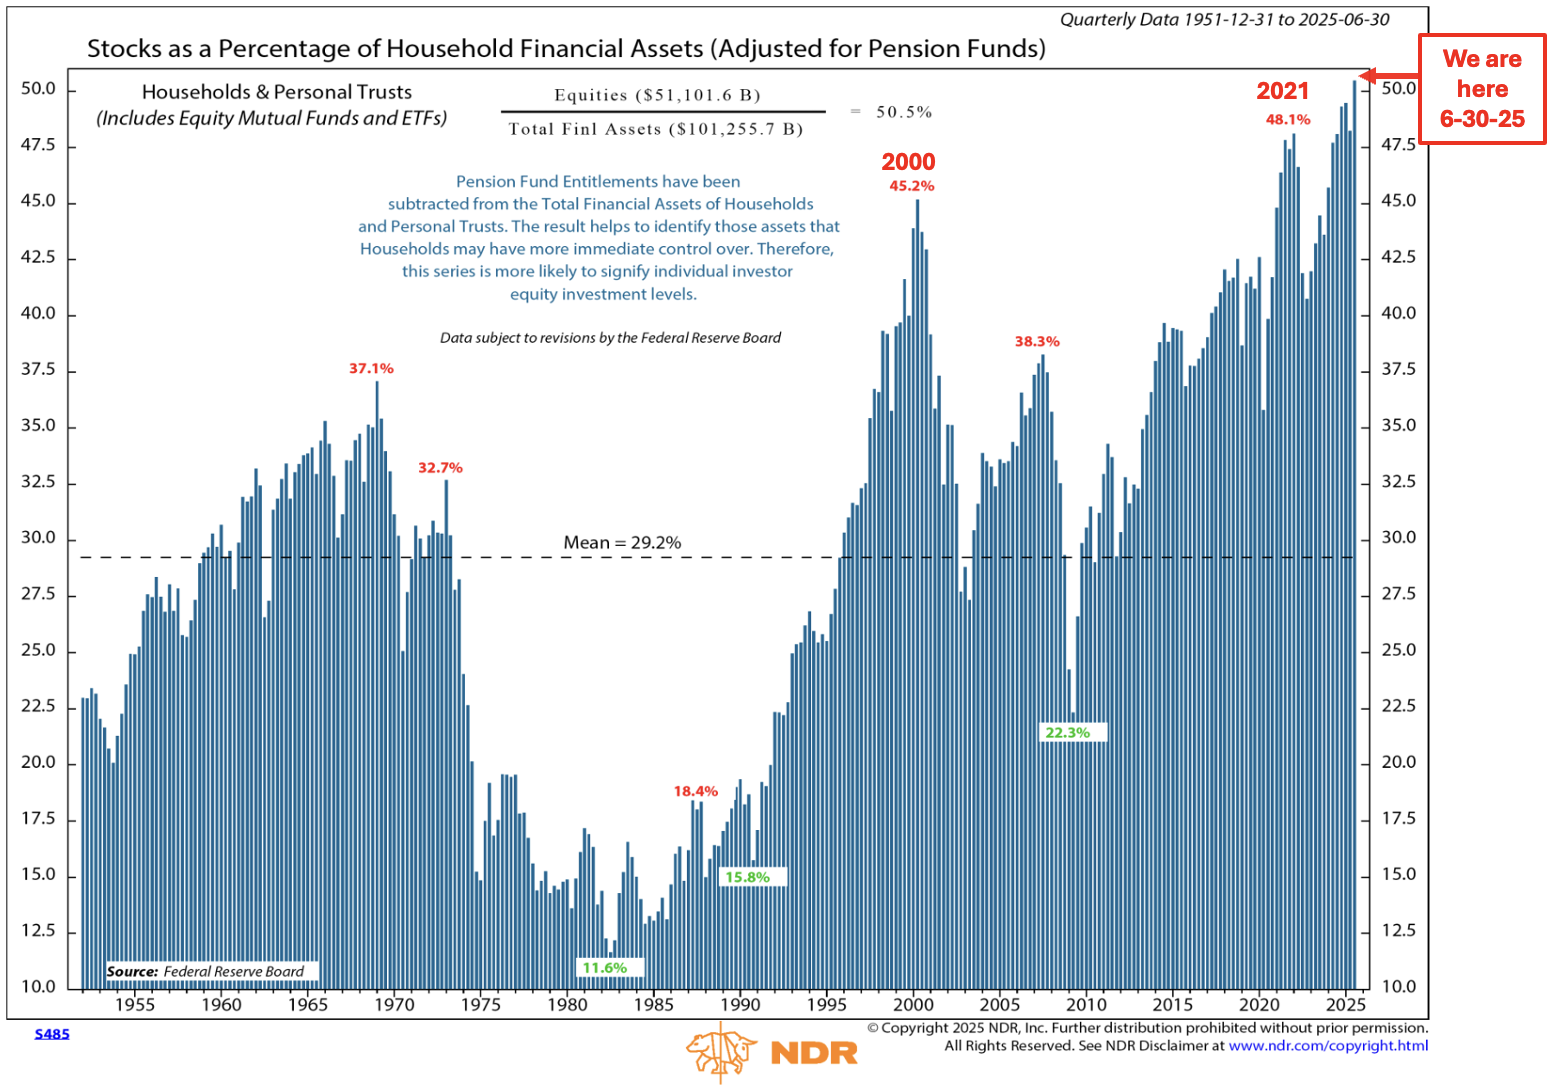
Source: NDR w CMG notations
2) Household Equity Ownership and Rolling 10-year Total Return
The following charts the actual 10-year total performance of the S&P 500. Take a look at the orange dotted line. It stops at the last known 10-year achieved return. Focus on the correlation between ownership and actual returns.
“We are here” in the chart shows that we are at the highest reading vs. data back to 1951. The left-hand side of the yellow zone is the 2000s (tech bubble peak).
The key read here is that when ownership is high (investors heavily invested in stocks), there is less capital available to bid prices higher.
The current reading forecasts a total return of -3%. In short, $100,000 declines to $97,000 ten years from now. Even worse, considering a 3% annual inflation rate.
One more point: note the gap between the blue line and the orange line since the start of QE. The gap may persist, but gravity, in my view, will ultimately prevail.
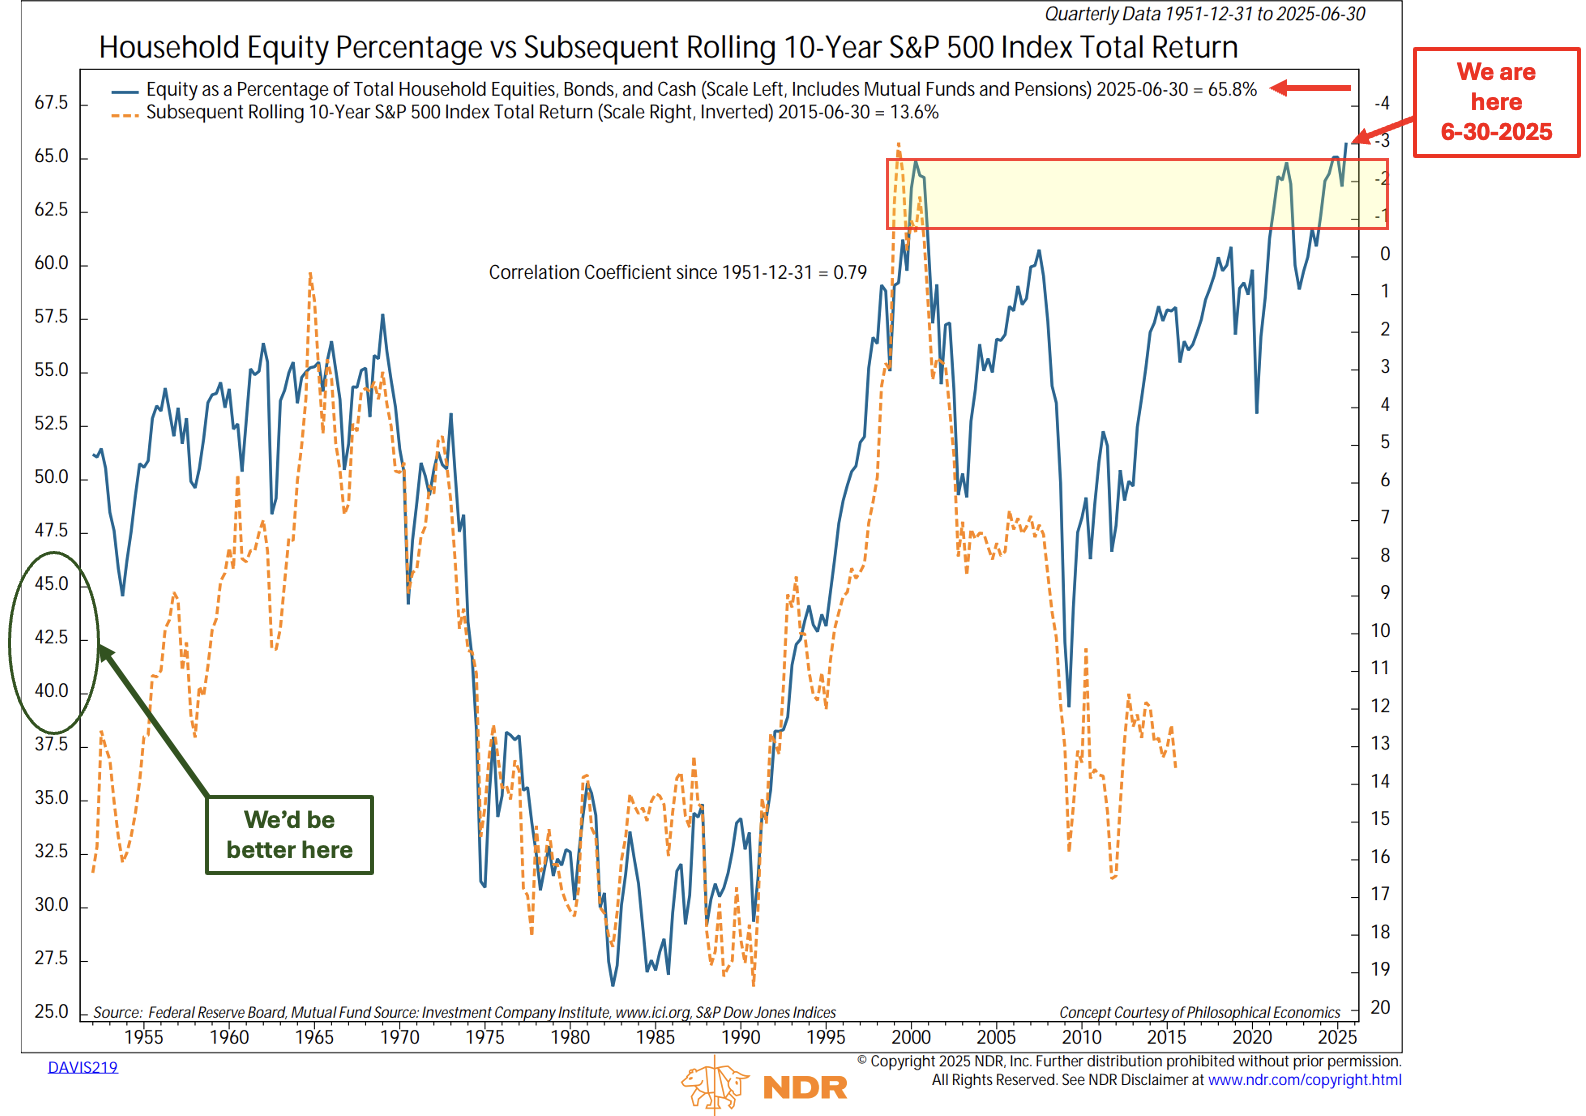
Source: NDR with CMG annotations
3) Leverage
Leverage always blows things up!
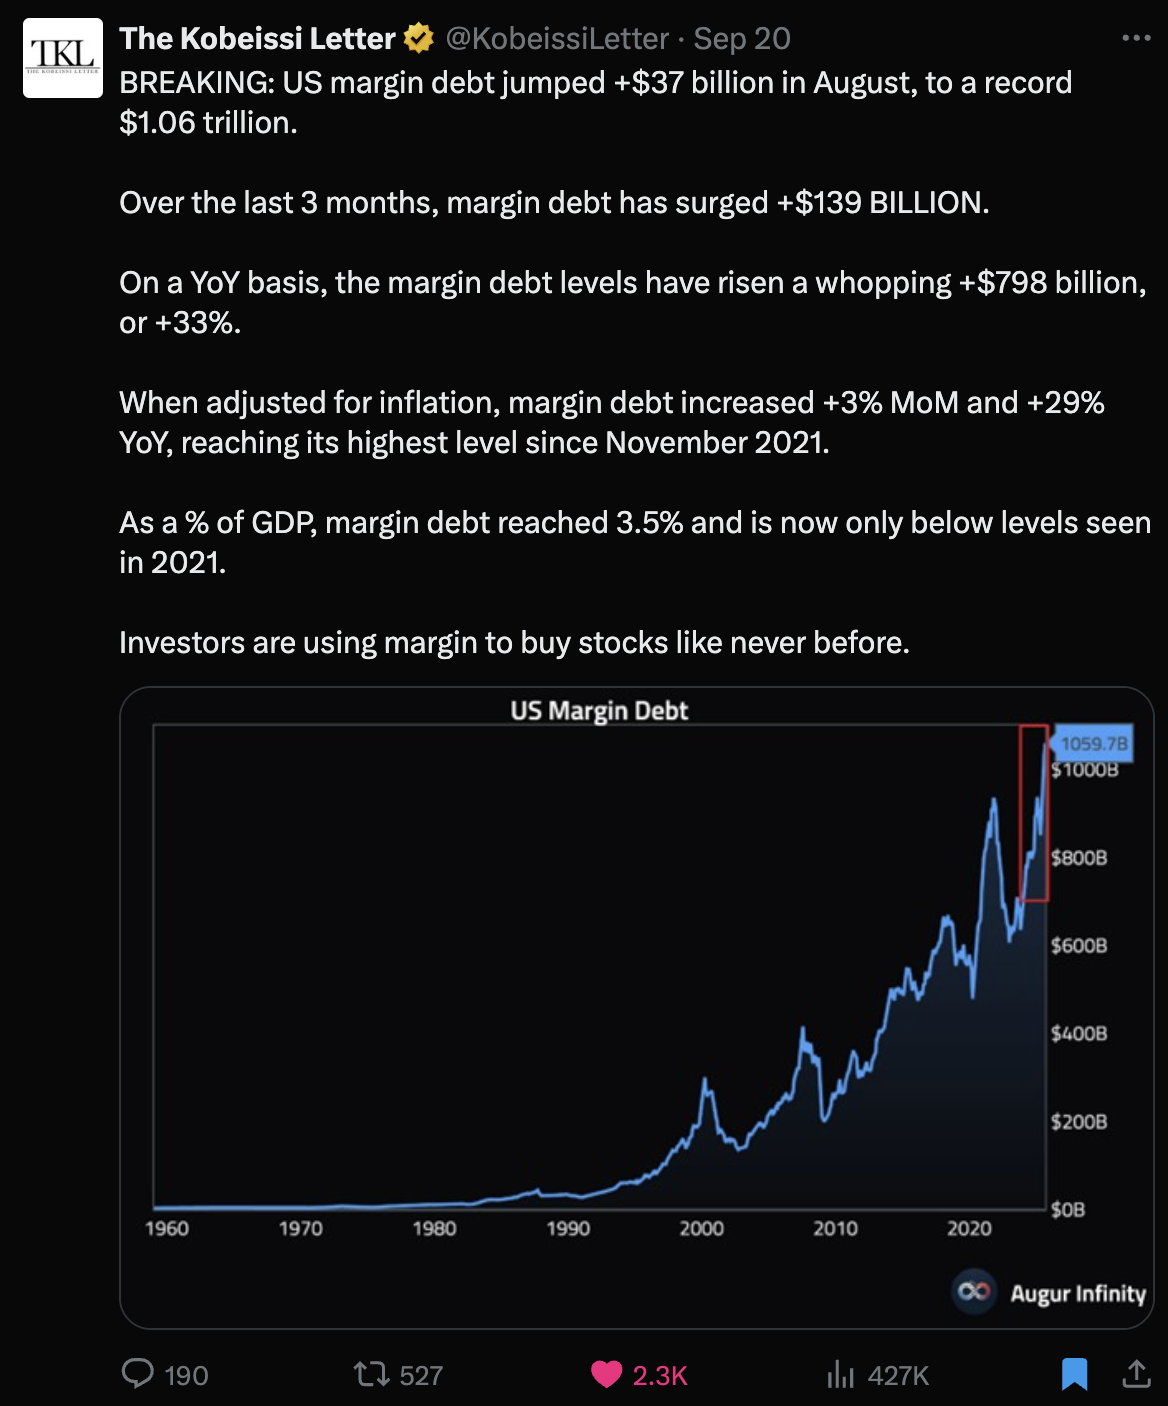
Source: @Kobessiletter, Augur Infinity
4) Another Look at Leverage
When the moving average of margin debt is above its six-month smoothed moving average, the trend/returns for the S&P 500 have been better than when margin debt outstanding declines below the moving average line.
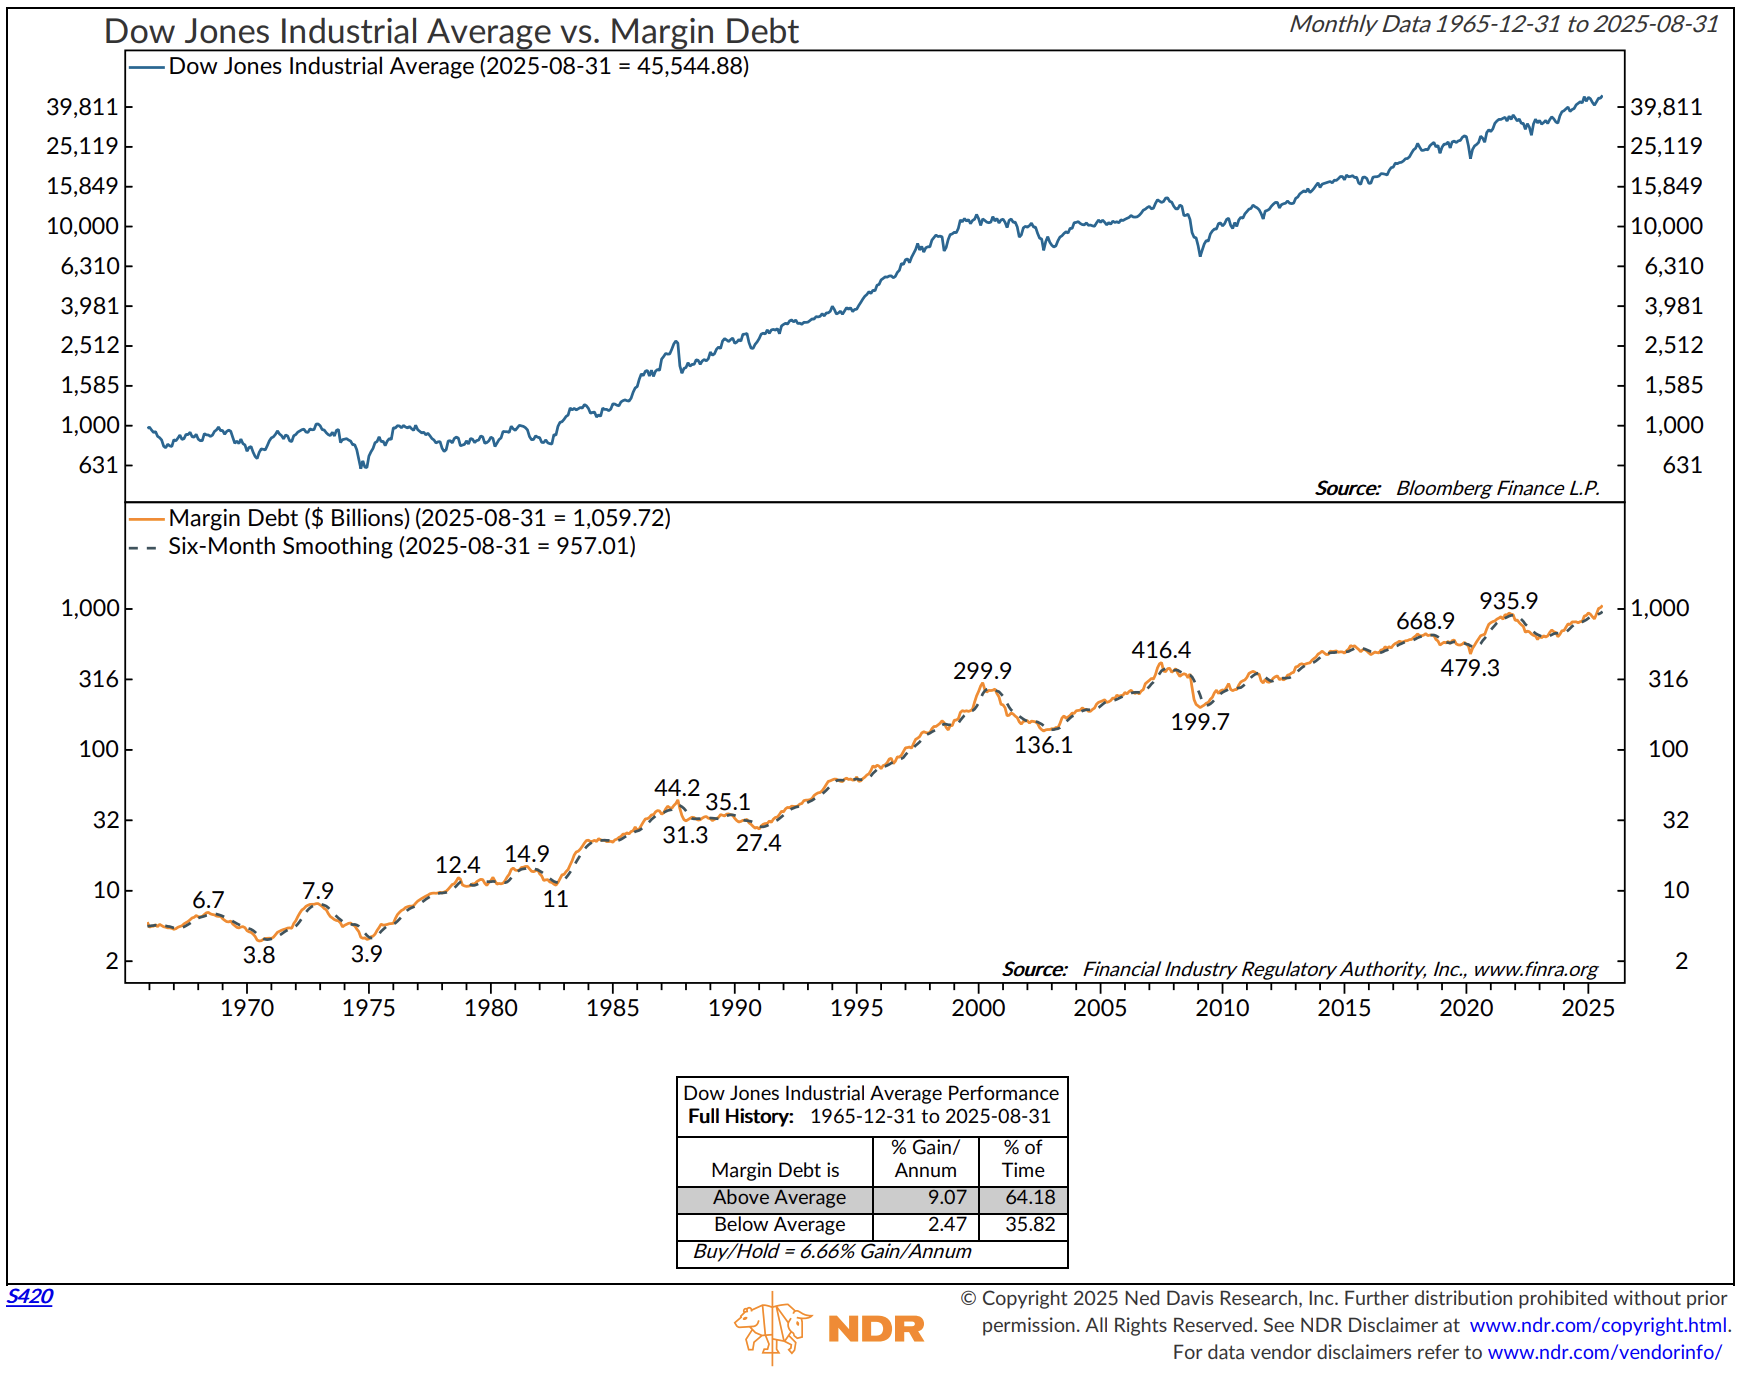
Source: NDR
5) The Mag 7 - High Market Concentration
The Mag 7 stocks are ~ 34% of the S&P 500 Index. The remaining 493 stocks are ~ 66% of the index.
The following chart plots Wall Street consensus estimates for the Mag 7, the 493, and the S&P 500.
The Mag 7 stocks (green line) are the earnings growth story. Period.
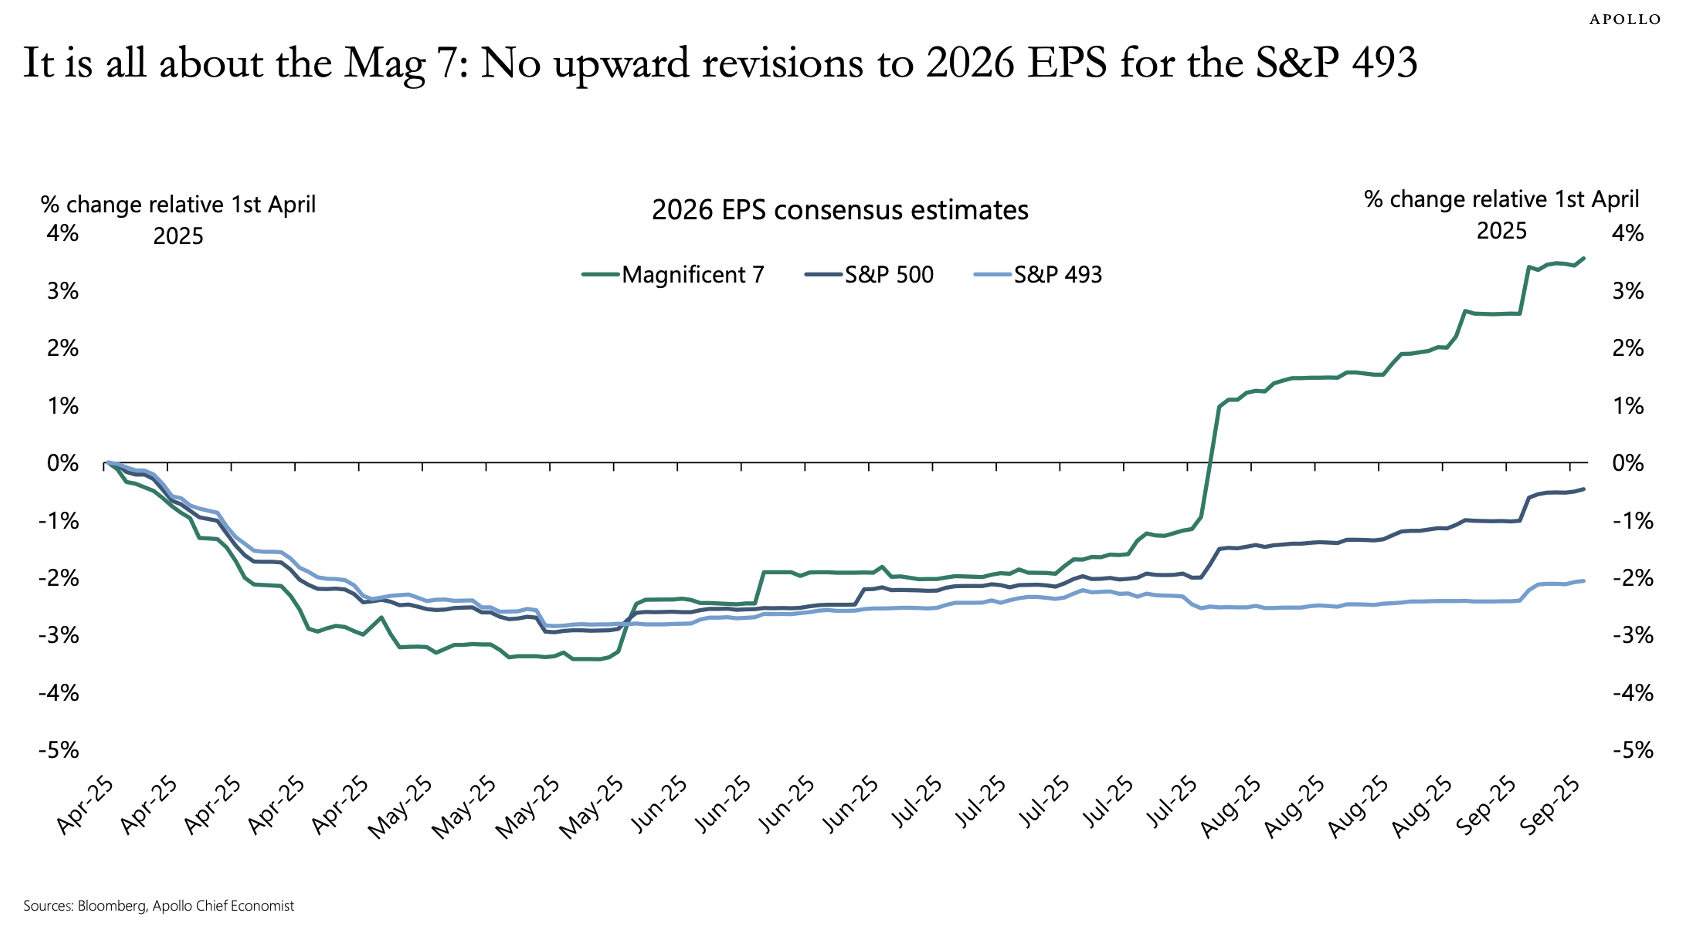
Source: Apollo
6) Cass Freight Index
Except for the Mag 7, most other areas in the economy are struggling. This next chart caught my eye - things are not looking well for the shipping.
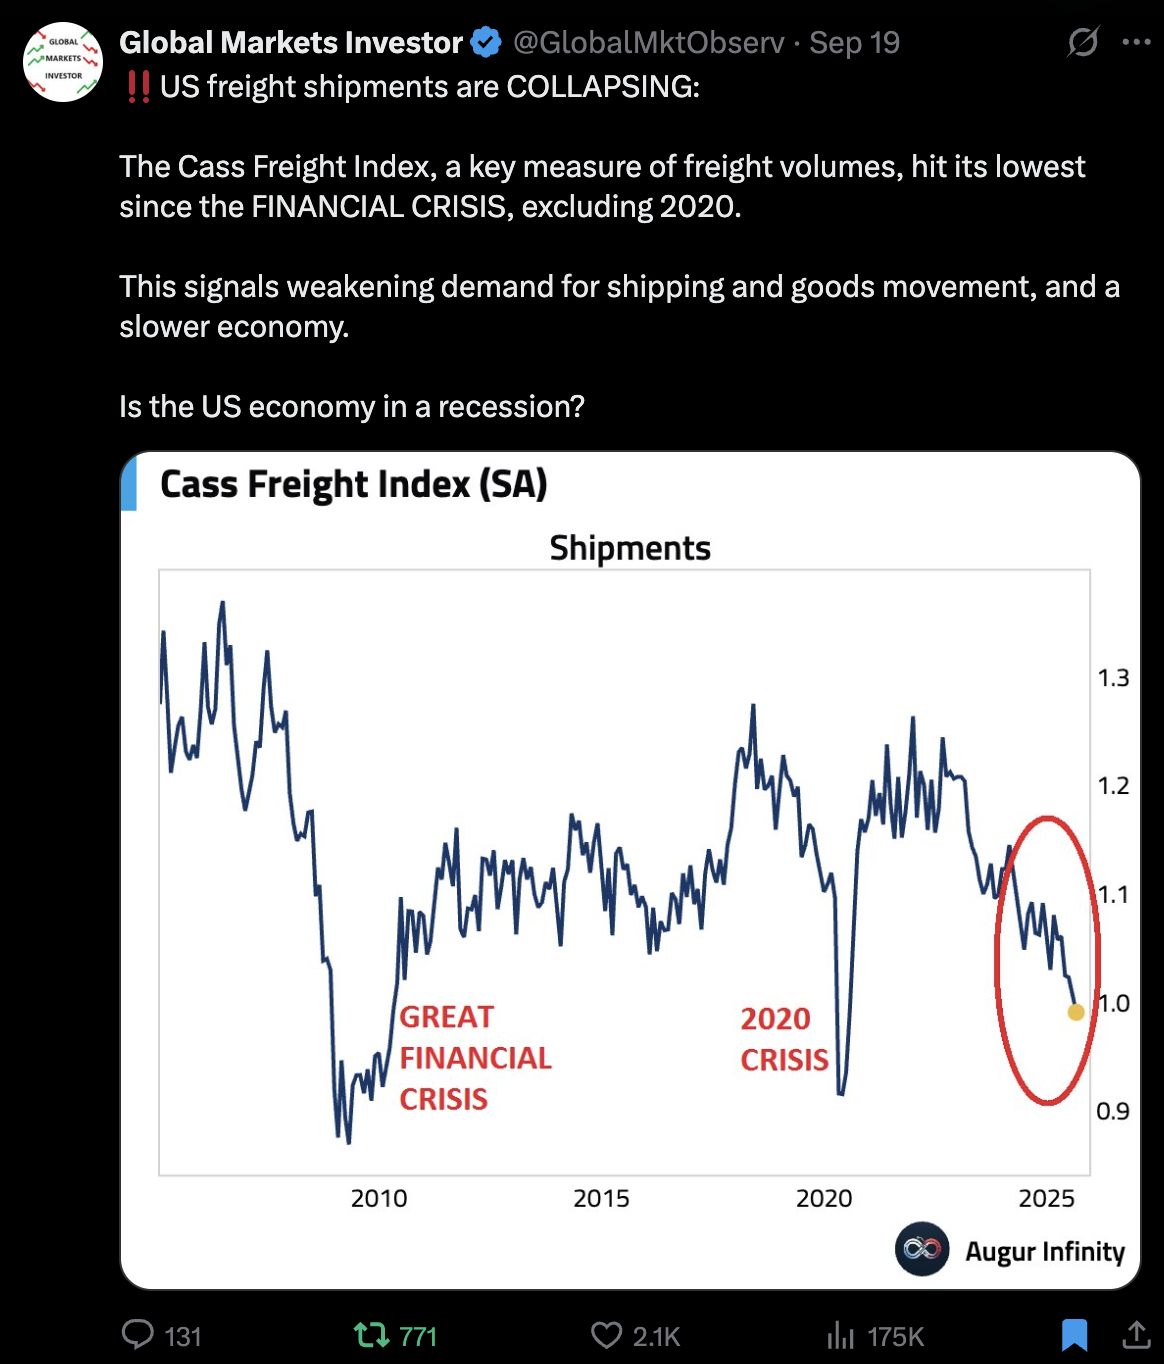
Source: @globalmktobserv, Augur Infinity
7) Data Centers
Data Centers are where construction growth is happening. The following compares data centers vs office buildings.
Not a surprise that electric power is so high.
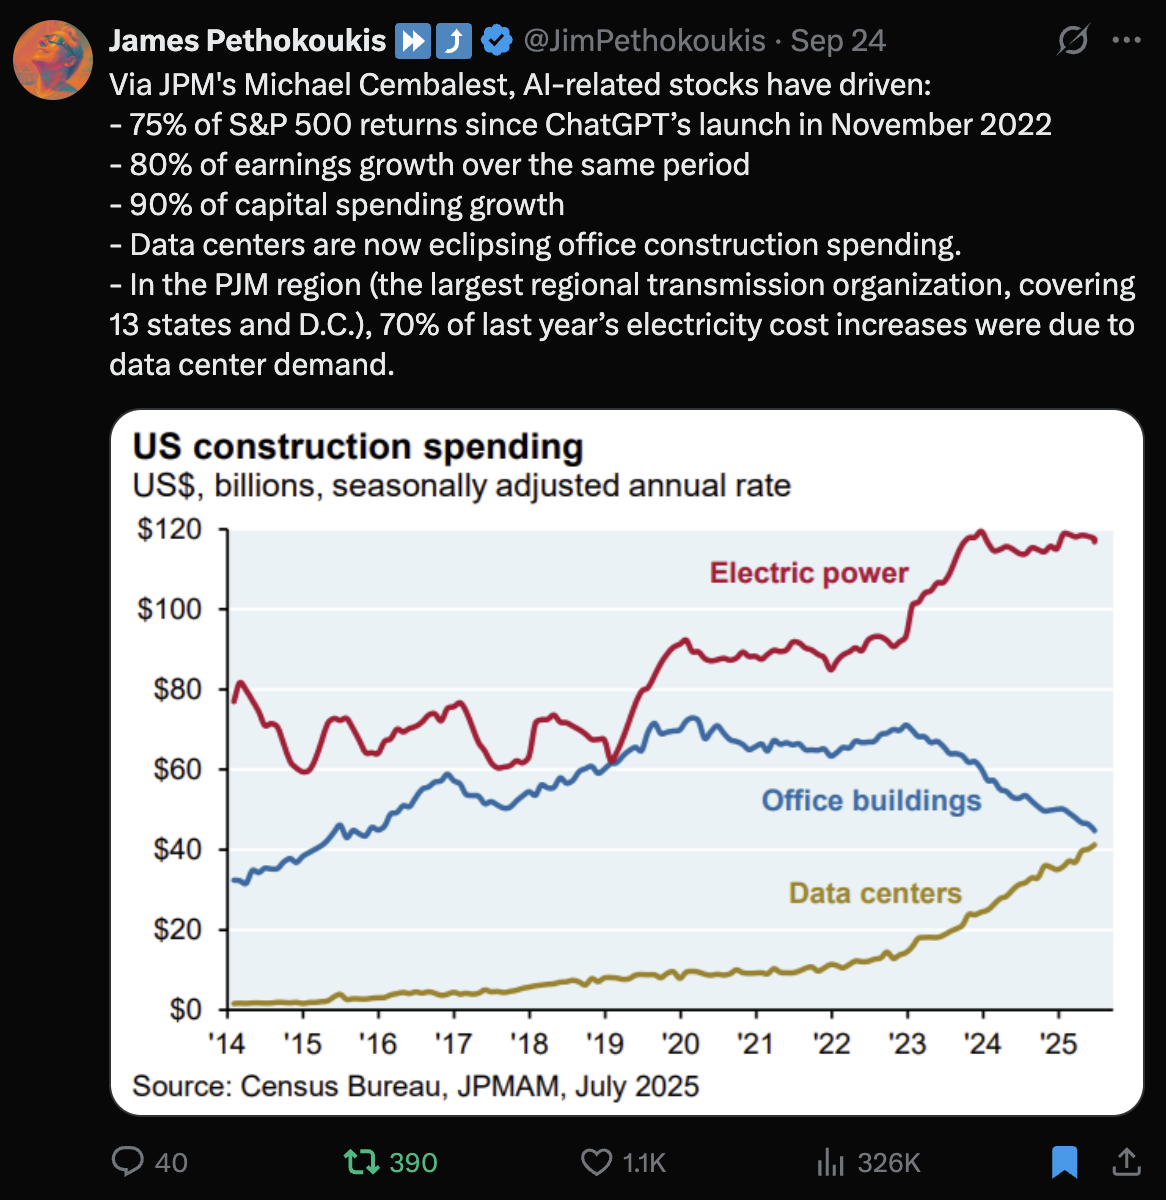
Source: Census Bureau, JPMAM, @jimpethokoukis
Bottom line
The equity market is overvalued, overbought, highly concentrated.
Diversify. Having worked with investors for more than 40 years, and reflecting on the move from 666 to 6,666, the following passage from Ray Dalio’s book, How Countries Go Broke: The Big Cycle, stood out to me. This is something I believe many investors miss.
From Ray (emphasis mine),
“While I’ve done very well as a global macro investor betting on the future in this unique way, I am wrong a lot (at least one-third of the time relative to what the markets are expecting) and I am never exactly right. Because I know that it takes only one really bad bet or a series of moderately bad bets to knock me out of the game, I am extremely risk-averse, so I have built great risk controls. I control risks through diversification of my good risky bets rather than by avoiding risky bets. To me, the “Holy Grail of Investing” is to find and make 15 or more great uncorrelated bets. I have followed this approach for about 35 of my 50-plus years as a professional investor. I am as hooked on playing this game as I have ever been, though now I want to pass along what I’ve learned rather than keep it to myself. It is of course up to others to decide whether what I’m sharing is of value, but I know that from my own experience it is. I have made a lot of money betting on the cause/effect relationships I described earlier in this book—relationships between the short-term and long-term debt and political cycles, acts of nature, and humanity’s inventiveness creating new technologies. These relationships are also logical and have appeared across thousands of years of history. I am sure that they are the biggest and most important forces, even though there are still a lot of key unknowns and uncertainties.
Also, keep in mind that I am not fully sure of anything, except death and taxes.”
Source: Dalio, Ray. How Countries Go Broke: The Big Cycle (Principles) (pp. 361-362). (Function). Kindle Edition.
SB Here: For more on this, see last week’s On My Radar: Trapped Like a Rolling Stone
Diversification ideas - If you are interested in learning about the approach we follow at my firm, CORE and EXPLORE, we wrote a paper titled “How We Think About Wealth.”
Click on the following image to sign up to receive the paper.
Registration for the paper: Please note that if you are interested in learning more about the investments we utilize to address the period ahead, we can connect with you after 30 days. There are specific regulatory qualifying rules. Regulations require us to make sure you are qualified for certain investments. If you have already been in contact with us, the 30-day regulatory rule does not apply. Please leave us a short comment if you prefer not to be contacted.
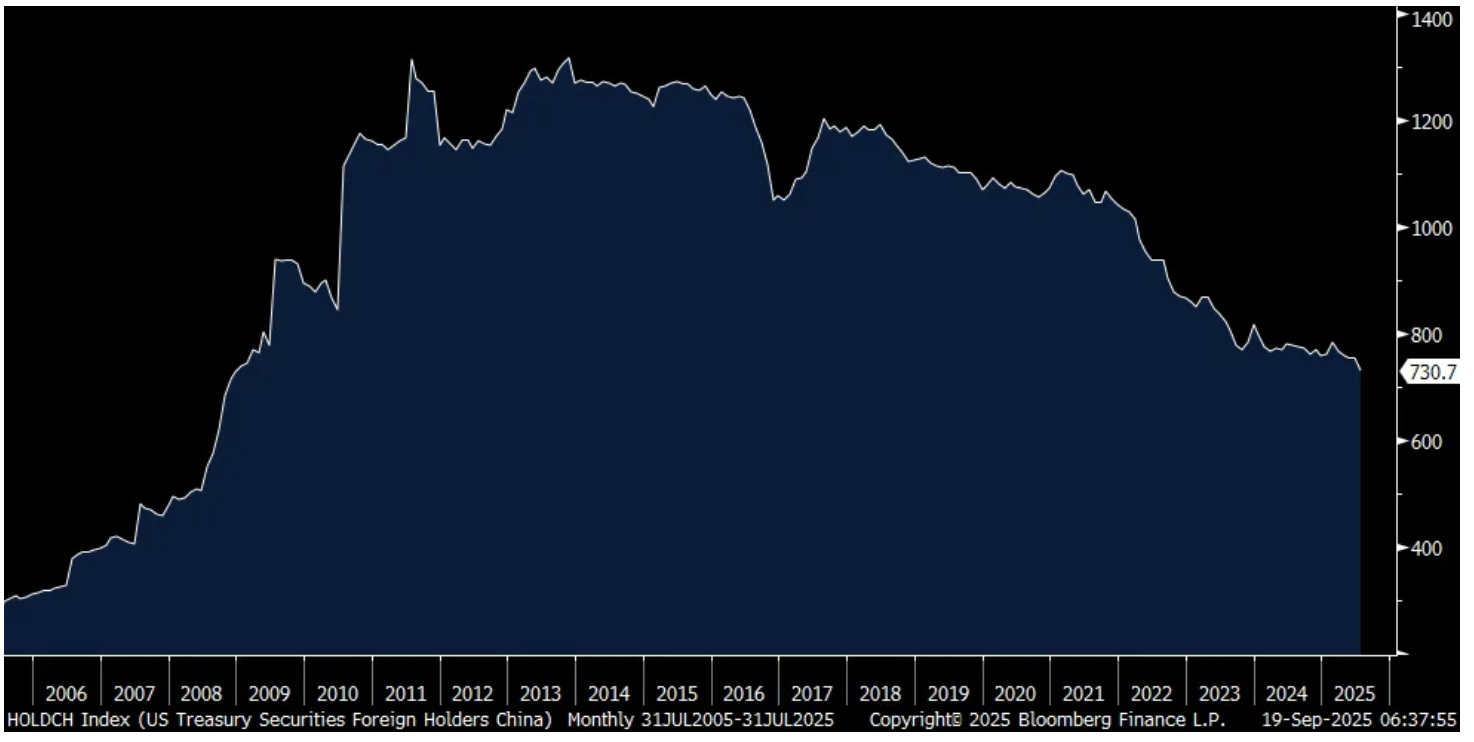
China, Treasuries and Gold
The following chart from Peter Boockvar’s Boock Report caught my eye this week.
China Holdings of US Treasuries
Peter noted a few key points:
China shed $25.7b of US Treasuries taking their holdings of US Treasuries to $731b in July which is the least since at least the end of 2008.
They did this as their foreign currency reserves have risen to a 10-year high, and
what are they owning more of instead? Gold. And as they trade more with partners in RMB, they have fewer US dollars to recycle into the US Treasury market.
Trade such as buying oil from Saudi Arabia and Russia in RMB and buying soybeans from Brazil in RMB instead of the U.S. etc., and
Those countries use the RMB to buy stuff from China.
SB point: The times they are a-changing. There is no putting the genie back in the bottle.
Source: Boock Report, Bloomberg
Please note that the information provided is not recommended for buying or selling any security and is provided for discussion purposes only. Current viewpoints are subject to change. Please note that the information provided is not recommended for buying or selling any security and is provided for discussion purposes only.
Plumbing Problems
In this next session, I’m simply pointing out the complexity in the system.
I believe we are a long way down the road to the U.S. government buying more and more of the very debt it issues. China is one example.
My belief is that “all roads lead to inflation.” The most significant contributor is the printing of money to finance U.S. government debt monetization and ongoing spending needs. To which, the interest cost as a percentage of tax revenues is nearing 25%. This is untenable.
Last week, Wall Street dealers attempted to offload nearly $24 billion of old, long-dated Treasury securities. The Treasury only bought $2 billion of the $24 billion, and only from a single issue. The Treasury issues new bonds regularly. (For example, a single issue such as a 20-year Treasury issued ten years ago at a yield of 1.75%.)
That wasn’t about juicing markets or lowering rates. It was about unclogging the plumbing.
Think of it like being stuck on the turnpike, and five miles ahead of you are workers clearing a crash. Similarly, old, illiquid bonds were jamming up trading and repo markets, making it harder for dealers to absorb the government’s massive new issuance. By selectively buying back those bonds, the Treasury is keeping traffic moving. And the Treasury needs the dealers to buy newly issued Treasury bonds.
But there is a cost. By retiring older, lower-coupon bonds and replacing them with short-term bills, the government’s near-term borrowing expenses go up. The tradeoff is stability: repo stress eases, auctions clear, and investors, foreign and domestic, can keep digesting supply without the system seizing up.
The key point: this isn’t QE (quantitative easing), which is meant to push yields down. The recent move is intended to prevent market dysfunction.
If yields rise from here, it’s about inflation, deficits, and growth - not broken plumbing.
Why this $2 billion matters
I believe the Treasury has signaled that it understands the stress in the system and will intervene to prevent a liquidity crisis. It can’t stop rates from climbing if macroeconomic forces (inflation, lack of buyers, bond vigilantes selling) demand it, but it can intervene surgically to prevent liquidity strains from escalating into a crisis.
Keep your eye on the 10-year Treasury yield and the dollar.
Trade Signals: Euphoria
Trade Signals is Organized in the Following Sections:
*Trade Signals basics: The Market Commentary section summarizes notable changes in the core key indicators: Investor sentiment, market breadth, stocks, treasury yields, the dollar, and gold. The Dashboard of Indicators provides a detailed view of all Trade Signals indicators.
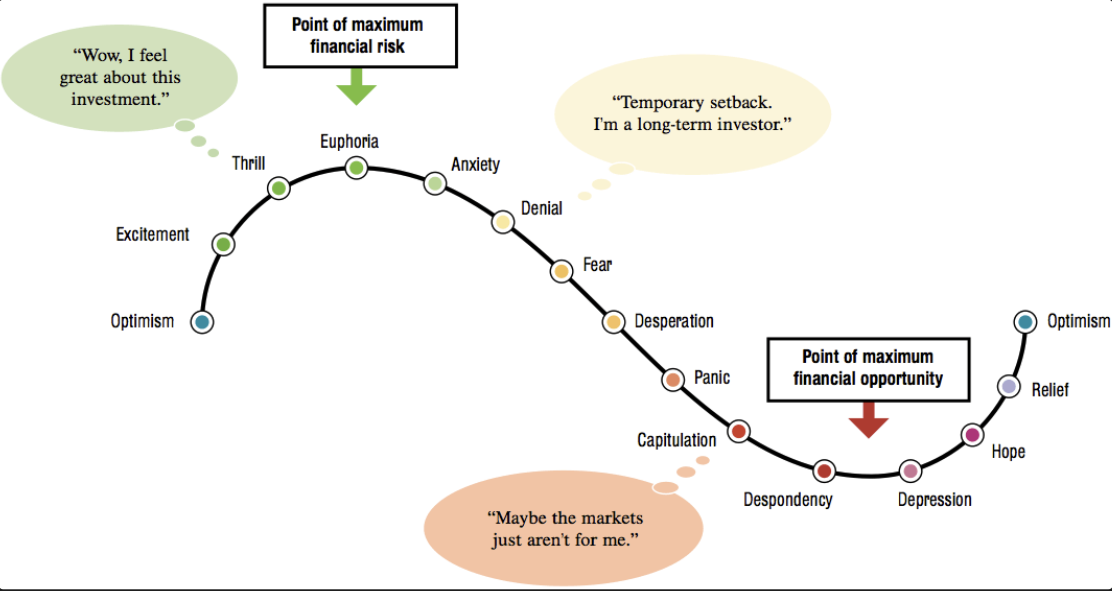
Commentary: Euphoria
Euphoria and the Emotional Investment Cycle
About Trade Signals
Trade Signals is a paid subscription service that posts the daily, weekly, and monthly trends in the markets (and more). Free for CMG clients. Not a recommendation to buy or sell any security. For discussion purposes only.
“Extreme patience combined with extreme decisiveness. You may call that our investment process.
Yes, it’s that simple.”
– Charlie Munger

TRADE SIGNALS SUBSCRIPTION ACKNOWLEDGEMENT / IMPORTANT DISCLOSURES
The views expressed herein are solely those of Steve Blumenthal as of the date of this report and are subject to change without notice. Not a recommendation to buy or sell any security.
Please note that the information provided is not recommended for buying or selling any security and is provided for discussion purposes only. Current viewpoints are subject to change. Please note that the information provided is not recommended for buying or selling any security and is provided for discussion purposes only.
Personal Note: Tampa, Phoenix, and Team
"She's the anchor, I'm a sailor, We're lost in the height of the wave."
Mt. Joy, Silver Lining
I am writing you from sunny, warm, and humid Tampa, Florida. It’s been a fun week.
I attended an outstanding dinner in NYC on Tuesday evening hosted by Jan van Eck, CEO of Van Eck. In the early 2000s, CMG ran a fund of hedge funds strategy, and Jan’s father and brother ran one of the funds in our portfolio.
Jan has grown the firm $132.9 billion in assets under management. VanEck offers both active and passive products, including mutual funds, ETFs, and separately managed accounts, with a notable early focus on international equities, gold, and emerging markets.
I was surprised to learn that they are also investing in early-stage and mid-stage private companies. That is an area of great interest to my firm. Jan, we need to talk.
Other guests were chief investment officers from various firms. What I like about Jan’s dinners is the interactive dialogue he shepards. We discussed market outlook, AI's integration into our lives, India, China, the Stablecoin Bill, and much more.
Following are a few comments (not a recommendation, views are subject to change):
Best guess: The government deficit decreases from 6.4% to 4.5%. SB here: Scott Bessent’s target is 3%. Let’s hope.
Tech efficiency is boosting profits. The chart shared showed Microsoft reached its peak employee count in 2024, and the count is meaningfully declining while profits are rising. Here are a few quotes from CEO’s:
AI will take “Half of all white collar jobs.” Jim Farley, Ford CEO
JPM could lose 10% of operational jobs
AI could cause 10-20% unemployment, says Dario Amodei, Anthropic CEO
I loved this quote from VanEck’s Angus S.: “Personal trainers will have dog walkers.” Think humanoid Robots… I think he is right.
The collective view was that gold has a long way to run. Perhaps just three years into a long-term bull market. I continue to hold a bullish view on gold.
Henry, an analyst at Bernstein, noted that derivative-based ETFs have grown at an incredible pace. He said, “I wonder what the end state will be.” Synthetic ETFs use stock options and managed futures contracts to express a defined return and downside outcome. Bernstein has an American Renaissance ETF that we’ll be looking into.
A fixed-income manager from a large firm said, “right now, you can refinance a ham sandwich.” That may be my favorite quote of the day. What he is saying is that there is a great deal of liquidity in the system.
I walked away from the dinner with a handful of new ideas and was stimulated by the depth of the discussions. Thank you, Jan.
Team update: A 3-0 halftime lead for the MP Friars evaporated in the second half. After two overtimes, the game finished 3-3. The boys look out of gas. I’ll be anxiously waiting to hear from Susan after today’s home game. Go Friars.
For new readers, my wife, Susan, is the boys’ varsity soccer coach. I serve as an assistant coach on game days. "She's the anchor, I'm a sailor…” And so happily lost in the height of the wave with her.
Mt. Joy is playing at the Mann Music Center in Philadelphia tomorrow evening. And we have tickets! Can’t wait.
Finally, if you are a golf fan, I’m sure you are tuning in to watch the Ryder Cup. Hope you enjoy watching. Go USA. However, I must say that I am a fan of many of the European golfers.
At the time of this writing, Europe took the morning matches and leads 3 points to 1. The afternoon matches are underway, with the US up in two of the matches and Europe up in the other two. Europe needs 13 1/2 points to retain the Cup. The US needs 14 1/2 points to win it back. The Ryder Cup concludes Sunday.
Channel your inner Mt. Joy, and hold your wine glass up high - “This is gonna be the best day of your life.”
Have a great week!
Kind regards,
Steve
CLICK HERE TO SUBSCRIBE TO ON MY RADAR - IT’S FREE
You can share this letter on X by clicking here.
You can share this letter on LinkedIn by clicking here.
Subscribe to OMR for free by clicking the photo.
Stephen B. Blumenthal
Executive Chairman & CIO
CMG Capital Management Group, Inc.
75 Valley Stream Parkway, Suite 201, Malvern, PA 19355
Private Wealth Client Website
CMG Customer Relationship Summary (Form CRS)
Metric-Financial, LLC Customer Relationship Summary (Form CRS)

Stephen Blumenthal founded CMG Capital Management Group in 1992 and serves today as its Executive Chairman and CIO. Steve authors a free weekly e-letter entitled, “On My Radar.” Steve shares his views on macroeconomic research, valuations, portfolio construction, asset allocation and risk management. Author of Forbes Book: On My Radar, Navigating Stock Market Cycles.
Follow Steve on X @SBlumenthalCMG and LinkedIn.
IMPORTANT DISCLOSURE INFORMATION
This document is prepared by CMG Capital Management Group, Inc. (“CMG”) and is circulated for informational and educational purposes only. There is no consideration given to the specific investment needs, objectives, or tolerances of any of the recipients. Additionally, CMG’s actual investment positions may, and often will, vary from its conclusions discussed herein based on any number of factors, such as client investment restrictions, portfolio rebalancing, and transaction costs, among others. Recipients should consult their own advisors, including tax advisors, before making any investment decision. This material is for informational and educational purposes only and is not an offer to sell or the solicitation of an offer to buy the securities or other instruments mentioned. This material does not constitute a personal recommendation or take into account the particular investment objectives, financial situations, or needs of individual investors which are necessary considerations before making any investment decision. Investors should consider whether any advice or recommendation in this research is suitable for their particular circumstances and, where appropriate, seek professional advice, including legal, tax, accounting, investment, or other advice. The views expressed herein are solely those of Steve Blumenthal as of the date of this report and are subject to change without notice.
Investing involves risk.
This letter may contain forward-looking statements relating to the objectives, opportunities, and future performance of the various investment markets, indices, and investments. Forward-looking statements may be identified by the use of such words as; “believe,” anticipate,” “planned,” “potential,” and other similar terms. Examples of forward-looking statements include, but are not limited to, estimates with respect to financial condition, results of operations, and success or lack of success of any particular market, index, investment, or investment strategy. All are subject to various factors, including, but not limited to, general and local economic conditions, changing levels of competition within certain industries and markets, changes in legislation or regulation, Federal Reserve policy, and other economic, competitive, governmental, regulatory, and technological factors affecting markets, indices, investments, investment strategy and portfolio positioning that could cause actual results to differ materially from projected results. Such statements are forward-looking in nature and involve a number of known and unknown risks, uncertainties, and other factors, and accordingly, actual results may differ materially from those reflected or contemplated in such forward-looking statements. Investors are cautioned not to place undue reliance on any forward-looking statements or examples. All statements made herein speak only as of the date that they were made. Investing is inherently risky and all investing involves the potential risk of loss.
Past performance does not guarantee or indicate future results. Different types of investments involve varying degrees of risk, and there can be no assurance that the future performance of any specific investment, investment strategy, or product (including the investments and/or investment strategies recommended or undertaken by CMG), or any non-investment related content, made reference to directly or indirectly in this commentary will be profitable, equal any corresponding indicated historical performance level(s), be suitable for your portfolio or individual situation or prove successful. Due to various factors, including changing market conditions and/or applicable laws, the content may no longer be reflective of current opinions or positions. Moreover, you should not assume that any discussion or information contained in this commentary serves as the receipt of, or as a substitute for, personalized investment advice from CMG. Please remember to contact CMG, in writing, if there are any changes in your personal/financial situation or investment objectives for the purpose of reviewing/evaluating/revising our previous recommendations and/or services, or if you would like to impose, add, or to modify any reasonable restrictions to our investment advisory services. Unless, and until, you notify us, in writing, to the contrary, we shall continue to provide services as we do currently. CMG is neither a law firm, nor a certified public accounting firm, and no portion of the commentary content should be construed as legal or accounting advice.
No portion of the content should be construed as an offer or solicitation for the purchase or sale of any security. References to specific securities, investment programs or funds are for illustrative purposes only and are not intended to be, and should not be interpreted as recommendations to purchase or sell such securities.
This presentation does not discuss, directly or indirectly, the amount of the profits or losses realized or unrealized, by any CMG client from any specific funds or securities. Please note: In the event that CMG references performance results for an actual CMG portfolio, the results are reported net of advisory fees and inclusive of dividends. The performance referenced is that as determined and/or provided directly by the referenced funds and/or publishers, has not been independently verified, and does not reflect the performance of any specific CMG client. CMG clients may have experienced materially different performance based upon various factors during the corresponding time periods. See in links provided citing limitations of hypothetical back-tested information. Past performance cannot predict or guarantee future performance. Not a recommendation to buy or sell. Please talk to your advisor.
Information herein has been obtained from sources believed to be reliable, but we do not warrant its accuracy. This document is general communication and is provided for informational and/or educational purposes only. None of the content should be viewed as a suggestion that you take or refrain from taking any action nor as a recommendation for any specific investment product, strategy, or other such purposes.
In a rising interest rate environment, the value of fixed-income securities generally declines, and conversely, in a falling interest rate environment, the value of fixed-income securities generally increases. High-yield securities may be subject to heightened market, interest rate, or credit risk and should not be purchased solely because of the stated yield. Ratings are measured on a scale that ranges from AAA or Aaa (highest) to D or C (lowest). Investment-grade investments are those rated from highest down to BBB- or Baa3.
NOT FDIC INSURED. MAY LOSE VALUE. NO BANK GUARANTEE.
Certain information contained herein has been obtained from third-party sources believed to be reliable, but we cannot guarantee its accuracy or completeness.
In the event that there has been a change in an individual’s investment objective or financial situation, he/she is encouraged to consult with his/her investment professional.
Written Disclosure Statement. CMG is an SEC-registered investment adviser located in Malvern, Pennsylvania. Stephen B. Blumenthal is CMG’s founder and CEO. Please note: The above views are those of CMG and its CEO, Stephen Blumenthal, and do not reflect those of any sub-advisor that CMG may engage to manage any CMG strategy, or exclusively determines any internal strategy employed by CMG. A copy of CMG’s current written disclosure statement discussing advisory services and fees is available upon request or via CMG’s internet web site at www.cmgwealth.com/disclosures. CMG is committed to protecting your personal information. Click here to review CMG’s privacy policies.