On My Radar: Why QE Is Likely Coming Back

January 9, 2026
By Steve Blumenthal
"MBS QE is back, this time from Fannie and Freddie, in order to close the gap between the 10-year Treasury yield and mortgage rates.”
- Peter Boockvar, The Boock Report
The current buzz about "MBS QE coming back" refers to an announcement from President Trump yesterday, January 8, 2026: He directed Fannie Mae and Freddie Mac (government-sponsored enterprises under FHFA conservatorship) to purchase $200 billion in MBS from the public market. MBS stands for Mortgage Backed Securities. Buying MBS in the open market drives prices higher and yields lower. The aim is to narrow the spread between Treasury yields and mortgage rates, potentially lowering borrowing costs and making home ownership more affordable.
This is not Fed QE; it's a targeted Government-Sponsored Enterprise (“GSE”) action using their existing cash reserves (not newly created money), and it's smaller in scale than past Fed programs (e.g., trillions during 2008–2014 or 2020), but not insignificant. Market reactions have been positive for MBS prices and related stocks (e.g., homebuilders), with some calling it "Trump MBS QE" or "Mortgage QE."
Let’s take a look at why the stimulus alone will not be enough to close the affordability gap.
Grab that coffee, settle into your favorite chair. I woke this morning intending to follow up on last week’s OMR: Valuation Record High PE discussion, where I pulled the Mag 7 stocks out of the S&P 500 Index to see what the S&P 493 valuation looked like (if you missed the post: a reasonable 15 price-to-earnings ratio). This week's plan was to analyze PEs across various dividend-paying indices. Let’s punt that topic to next week. My friend, Peter Boockvar’s “MBS QE is Back” morning letter, sent me down a QE, not-QE, MBS QE rabbit hole. I’ve resurfaced and would like to share my thinking with you.
Bottom line: More sugar from the government. This time, with the intent to drive mortgage rates lower to make housing more affordable. Good intentions, yes. The plan is half-baked. We’ll examine the extent of the affordability gap and why the Fed's purchase of mortgage-backed securities may further inflate prices. A significant part of the problem is on the supply side, driven by local issues such as permitting and the pace of new construction. Thanks for reading!
On My Radar: Why QE is Likely Coming Back
Personal Note: The Football Playoffs
OMR is for informational and educational purposes only. No consideration is given to your specific investment needs, objectives, or tolerances.
Please see the Important Disclosures at the bottom of this page. Reminder: This is not a recommendation to buy or sell any security. My views may change at any time. The information is for discussion and educational purposes only.
If you like what you are reading, you can subscribe for free.

Mortgage Backed Security “MBS” QE
Peter Boockvar highlights an important economic fact: if housing supply doesn’t pick up, MBS QE will push mortgage rates down (a good thing), but increased demand will simply push home prices up, making them more expensive and effectively not making housing less expensive.
He wrote this in his morning Boock Report (bold emphasis mine), “MBS QE is back, this time from Fannie and Freddie, in order to close the gap between the 10-year Treasury yield and mortgage rates. While I applaud the attention to easing the affordability challenge for so many in their attempt to buy a home, with the experience of the past 25 years with the government via the Fed, FNM (Fannie Mae), and FRE (Freddie Mac) goosing the demand side for housing via cheap money and MBS purchases, MBS QE is back, this time from Fannie and Freddie, in order to close the gap between the 10 yr Treasury yield and mortgage rates.
With the experience of the past 25 years with the government via the Fed, FNM, and FRE goosing the demand side for housing via cheap money and MBS purchases, if there is not a coincident increase in the supply of homes with this new demand push, all we’ll see is another rise in home prices that offsets the benefit of lower mortgage rates.
Still, the main driver of mortgage rates will remain the US Treasury market, and the 10-year yield is up 2 bps to 4.19%. So, we have a demand push at the federal level again, while the supply comes from the local level, both in terms of permitting and new home delivery.
Still, the main driver of mortgage rates will remain the US Treasury market, and the 10-year yield is up 2 bps to 4.19%.”
Just how out of whack is the housing market? Take a look at the clip in the next section.
The Monthly Payment That Broke the Housing Market
Focus on the following chart.
From EndGameMacro via X: “What you’re looking at here is three very different realities living in the same market. The green line is what it costs today to buy a home with current prices and rates. The blue line is what it costs to rent. The orange line is what existing homeowners are actually paying because they locked in low fixed rates years ago. For most of the 2010s, those lines moved together. Buying wasn’t much more expensive than renting, and sometimes it was cheaper. That made moving, upgrading, or becoming a first-time buyer feel reasonable.
Then Rates Reset In 2022, And Everything Broke. The cost to buy didn’t creep higher. It jumped. Monthly payments went from something like the mid $1,000s to the high $2,000s almost overnight. Rents kept rising too, but slowly and steadily. Existing homeowners barely felt it at all. That gap is the freeze. Buyers pull back. Sellers don’t move. Inventory stays tight. Prices don’t clear the way they normally would.”
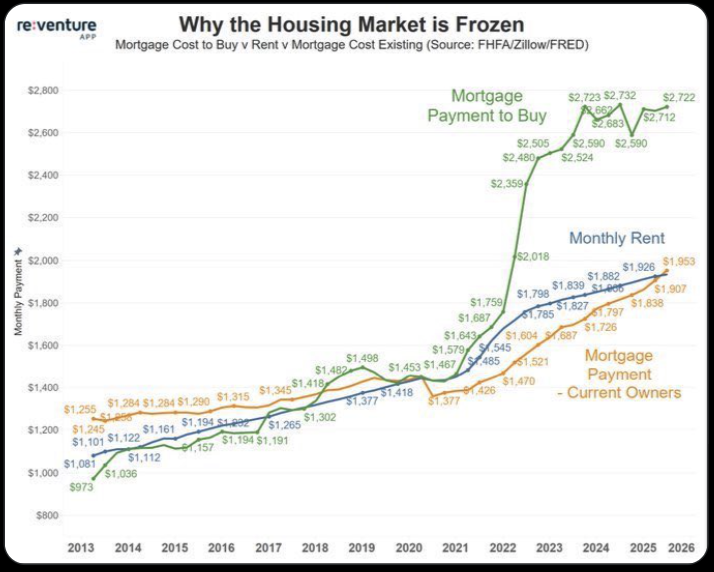
Source: EndGameMacro @onechancefreedm
The Fed first began buying mortgage debt and Treasury bonds in late 2008 during the financial crisis, launching what became known as Quantitative Easing. Since then, across four major QE programs, including the pandemic response, the Fed has created and injected roughly $9 trillion to purchase Treasuries and mortgage-backed securities, at times buying as much as $120 billion per month. This was not a one-off emergency tool. It has become a recurring policy response.
Look at the spike higher in the green line from 2021 onwards. That’s what 2-3% mortgage rates did to housing prices and, ultimately, to mortgage payments.
MBS QE is back. While it is nuanced, in spirit, Fannie Mae and Freddie Mac buying $200B of MBS frees up bank balance sheets and enables more mortgage lending. The government is goosing the system, again.
I think this game will continue until unbearable inflation breaks its back. Not today, not tomorrow, but over the next few years. We need to monitor the Federal Reserve's monetary actions and the government's fiscal actions. Let us next look at the extent of what we’ve already received and contemplate what the future might look like.
A Quick History of QE
To put what we are discussing today into perspective, I thought it might be helpful to look at the collective summary of QE: when the Fed started QE, what they bought, when they bought it, and how much they bought. I hope it is not as aggravating a review for you as it was for me. Too much for too long.
QE1 – Global Financial Crisis
Start: November 2008
This is when QE was born.
MBS purchases began first (to stabilize housing)
Treasury purchases followed
Purchases:
$1.25 trillion in Mortgage-Backed Securities (MBS)
$300 billion in Treasuries
$175 billion in agency debt
Total QE1: ~$1.7 trillion
Monthly pace: not fixed, but roughly $100–125B/month at peak
QE2 – Post-Crisis Slowdown
Start: November 2010
Treasuries only (no MBS this round)
Purchases:
$600 billion in Treasuries
Monthly pace:
~$75B/month
QE3 – “QE Infinity”
Start: September 2012
This was open-ended and the most aggressive.
Initial pace:
$40B/month MBS
Expanded in Dec 2012:
+$45B/month Treasuries
Total monthly pace: $85Bil/month ( $40B MBS + $45B Treasuries )
Total purchases (2012–2014): ~$1.6 trillion
Pandemic QE – COVID Crisis “Unlimited QE”
This dwarfed everything before it.
Start: March 2020
By mid-2020 the formal pace was:
$80Bil/month Treasuries
$40B/month MBS
$120B/month total
Total purchased (2020–2022):
~$4.6–$4.8 trillion
Big Picture Totals
From 2008 through 2022:
Total QE purchases: ~$8.5–$9 trillion
Split roughly:
~$5 trillion Treasuries
~$3 trillion MBS
Remainder agency debt, etc.
Fed balance sheet:
2007: ~$900B
Peak 2022: ~$8.9T
Why I believe this matters from a macroeconomic perspective and why it remains critical to my fiscal dominance/debt trap narrative. In short,
QE is no longer “extraordinary.”
It is now embedded in the system.
And markets have been conditioned to expect it.
Lyn Alden's famous saying, “Nothing stops this train,” resonates with me. Next, we look at why QE is Likely Coming Back.
Source: Federal Reserve (2008–2022), FOMC statements and Monetary Policy Reports; Congressional Research Service, “The Federal Reserve’s Balance Sheet,” 2022.
https://www.federalreserve.gov/newsevents/pressreleases/monetary20081125b.htm
https://www.federalreserve.gov/econresdata/feds/2010/files/2010001pap.pdf
https://www.federalreserve.gov/regreform/reform-mbs.htm?utm_source=chatgpt.com
https://www.federalreserve.gov/newsevents/pressreleases/monetary20101103a.htm
https://www.federalreserve.gov/newsevents/pressreleases/monetary20120913a.htm
https://www.federalreserve.gov/monetarypolicy/2022-02-mpr-part2.htm?utm_source=chatgpt.com
https://www.federalreserve.gov/releases/h41/
https://crsreports.congress.gov/product/pdf/IF/IF12147
www.federalreserve.gov/newsevents/pressreleases/monetary20081125b.htm
https://chatgpt.com/c/696019dc-f0d0-8333-be36-b44158360028#:~:text=2010%2C%20www.federalreserve.gov/-,econresdata,-/feds/2010/files/2010001pap
https://chatgpt.com/c/696019dc-f0d0-8333-be36-b44158360028#:~:text=3%20Nov.%202010%2C-,www.federalreserve.gov/newsevents/pressreleases/monetary20101103a.htm,-.
https://chatgpt.com/c/696019dc-f0d0-8333-be36-b44158360028#:~:text=newsevents/pressreleases/monetary20120913a.-,htm,-.
https://chatgpt.com/c/696019dc-f0d0-8333-be36-b44158360028#:~:text=2012%2C%20www.federalreserve.gov/newsevents/pressreleases/-,monetary20121212a,-.htm
https://chatgpt.com/c/696019dc-f0d0-8333-be36-b44158360028#:~:text=2020%2C%20www.federalreserve.-,gov,-/newsevents/pressreleases/monetary20200315a
https://chatgpt.com/c/696019dc-f0d0-8333-be36-b44158360028#:~:text=newsevents/pressreleases/monetary20200610a.-,htm,-.
https://chatgpt.com/c/696019dc-f0d0-8333-be36-b44158360028#:~:text=H.4.1).%20www.-,federalreserve,-.gov/releases/h41
Not a recommendation to buy or sell any security. Please note that the information provided is not recommended for buying or selling any security and is provided for discussion purposes only. Current viewpoints are subject to change. Please note that the information provided is not recommended for buying or selling any security and is provided for discussion purposes only. See important CMG and NDR disclosures below.
Why QT Is Failing – And Why QE Is Likely Coming Back
Quantitative Tightening was supposed to be the great unwind. The reversal. The return to “normal.”
It isn’t working.
In theory, QT means the Fed steps away, allows bonds to roll off its balance sheet, drains liquidity, and lets the market reprice risk. In reality, the system can’t tolerate it for long. The plumbing starts to creak. Then it groans. Then something breaks.
We’ve seen this movie before.
In 2019, QT contributed to the repo market blowing up. The Fed was forced to intervene. In 2020, the bond market seized during COVID. The Fed went all-in. In 2023–2024, bank stresses, funding pressures, and liquidity operations quietly returned. And today, with deficits exploding and Treasury issuance surging, the stress is building again.
Here’s the core problem:
The government is issuing debt faster than the private market can absorb it without pain.
That pain shows up as:
Higher long-term interest rates
tighter financial conditions
stress in banks and credit markets
and ultimately, pressure on growth
QT shrinks the Fed’s balance sheet, but deficits are expanding the Treasury’s balance sheet. Those two forces are now in direct conflict, and deficits are winning.
The U.S. is running a ~$ 1.7 trillion annual deficit in a non-recession economy. Interest expense is exploding. The Treasury must roll and refinance enormous amounts of debt at higher rates. The market can only digest so much supply before yields spike and something gives.
This is why QT keeps getting “paused,” “adjusted,” or offset by so-called “technical” operations: repo facilities, BTFP, bill purchases, liquidity injections.
The labels change, but the intent doesn’t.
The system needs liquidity. Which brings us back to QE:
The Fed can say all it wants that QE is “not on the table.” But history is very clear: when financial conditions tighten too much, and growth starts to wobble, the Fed intervenes. Because of:
debt levels where they are
deficits where they are
and political realities where they are…
There is no path that does not lead back to balance sheet expansion.
Maybe it starts quietly. Maybe it’s framed as “market functioning.” Maybe it’s interest rate controls on the front end of the curve. Maybe it’s during a crisis. One way or another, the direction is clear.
QT is a speed bump.
QE is the destination.
This is fiscal dominance in action. The central bank is no longer fully in control. It is increasingly used to meet the government's funding needs.
Why do I keep harping on this? It is not academic. It shapes everything:
Asset prices
Inflation
Currency value
Future returns
QE supports asset prices in the short run. It is corrosive to purchasing power in the long run. That’s what we are seeing in the housing affordability gap that's developed.
When QE returns in an environment of supply-driven inflation and structural deficits, the inflation impulse is stronger, not weaker. This is why I believe MBS QE is bullish for housing prices.
That’s why I keep saying: the 40-year tailwind of falling rates is behind us. We are in a new regime. Expect more volatility, more intervention, and sadly, more money printing.
Not a recommendation to buy or sell any security. Please note that the information provided is not recommended for buying or selling any security and is provided for discussion purposes only. Current viewpoints are subject to change. Please note that the information provided is not recommended for buying or selling any security and is provided for discussion purposes only. See important CMG and NDR disclosures below.
If you like what you are reading, click on the following link.
CLICK HERE TO SUBSCRIBE TO ON MY RADAR - IT’S FREE
Not a recommendation to buy or sell any security. Please note that the information provided is not recommended for buying or selling any security and is provided for discussion purposes only. Current viewpoints are subject to change. Please note that the information provided is not recommended for buying or selling any security and is provided for discussion purposes only.
Trade Signals: January 8, 2025 Update
Weekly Market Commentary - A plain-English snapshot of what changed this week, and what matters most beneath the surface.
The Indicators Dashboard - A consolidated view of key technical signals across equities, investor sentiment, bonds, commodities, currencies, and gold.
Valuations and Subsequent 10-Year Returns - Where current valuations stand historically, and what they may mean in terms of forward returns.
Supporting Charts with Explanations - The technical charts that anchor the signals, with concise commentary on what they’re indicating.
Sequentially, you’ll find the following sections:
Weekly Market Commentary
The Indicators Dashboard - Stocks, Investor Sentiment, Bonds, Commodities, Currencies, and Gold
Valuations and Subsequent 10-year Returns
Supporting Charts with Explanations
Not a recommendation for you to buy or sell any security. For information purposes only. Outlook and viewpoints are subject to change at a moment's notice. This material is for discussion purposes and does not give you specific advice. Please discuss needs, goals, time horizons, and risk tolerances with your advisor.
Market Commentary
Please let me know if you have any questions. Please email Amy@cmgwealth.com if you would like a free sample of Trade Signals.
About Trade Signals
Trade Signals is a paid subscription service that posts the daily, weekly, and monthly trends in the markets (and more). Free for CMG clients. Not a recommendation to buy or sell any security. For discussion purposes only.
“Extreme patience combined with extreme decisiveness. You may call that our investment process.
Yes, it’s that simple.”
– Charlie Munger

TRADE SIGNALS SUBSCRIPTION ACKNOWLEDGEMENT / IMPORTANT DISCLOSURES
The views expressed herein are solely those of Steve Blumenthal as of the date of this report and are subject to change without notice. Not a recommendation to buy or sell any security.
Please note that the information provided is not recommended for buying or selling any security and is provided for discussion purposes only. Current viewpoints are subject to change. Please note that the information provided is not recommended for buying or selling any security and is provided for discussion purposes only.
Personal Note: The Football Playoffs
The NCAA Division I football semi-finals kicked off last night with the University of Miami beating Old Miss with just seconds to go in the game. It was a back-and-forth nail-biter. I was pulling for Old Miss. Congratulations to Miami.
Tonight’s College Football Playoff semifinal in the Peach Bowl pits the undefeated No. 1 Indiana Hoosiers against the No. 5 Oregon Ducks in a rematch of their October duel. All eyes will be on Indiana quarterback Fernando Mendoza, the 2025 Heisman Trophy winner who has led the Hoosiers to historic heights with pinpoint accuracy, poise, and leadership, becoming the first Heisman winner in program history.
Indiana’s remarkable turnaround has been guided by head coach Curt Cignetti, whose culture shift and disciplined approach have transformed a perennial underdog into a national title contender. They face a dynamic offense and strong defense that will test Indiana. I’m a Big 10 guy, so I’m pulling for Indiana.
My Eagles play San Francisco at home Sunday afternoon. It’s playoff season, and great fun if you are a sports junkie like me. It’s going to be a good game. Go Birds!
No travel next week. Much to catch up on. Wishing the best to your favorite team. Unless they are called the 49ers. This weekend, anyway.
I’m having a podcast discussion with Peter Boockvar next Monday. I will share it with you next Friday in OMR. Excited for that!
Wishing you a great week!
Warm regards,
Steve
CLICK HERE TO SUBSCRIBE TO ON MY RADAR - IT’S FREE
You can share this letter on X by clicking here.
You can share this letter on LinkedIn by clicking here.
Subscribe to OMR for free by clicking the photo.
Stephen B. Blumenthal
Executive Chairman & CIO
CMG Capital Management Group, Inc.
75 Valley Stream Parkway, Suite 201,
Malvern, PA 19355
CMG Customer Relationship Summary (Form CRS)
Metric-Financial, LLC Customer Relationship Summary (Form CRS)

Stephen Blumenthal founded CMG Capital Management Group in 1992 and serves today as its Executive Chairman and CIO. Steve authors a free weekly e-letter entitled, “On My Radar.” Steve shares his views on macroeconomic research, valuations, portfolio construction, asset allocation and risk management. Author of Forbes Book: On My Radar, Navigating Stock Market Cycles.
Follow Steve on X @SBlumenthalCMG and LinkedIn.
IMPORTANT DISCLOSURE INFORMATION
This document is prepared by CMG Capital Management Group, Inc. (“CMG”) and is circulated for informational and educational purposes only. There is no consideration given to the specific investment needs, objectives, or tolerances of any of the recipients. Additionally, CMG’s actual investment positions may, and often will, vary from its conclusions discussed herein based on any number of factors, such as client investment restrictions, portfolio rebalancing, and transaction costs, among others. Recipients should consult their own advisors, including tax advisors, before making any investment decision. This material is for informational and educational purposes only and is not an offer to sell or the solicitation of an offer to buy the securities or other instruments mentioned. This material does not constitute a personal recommendation or take into account the particular investment objectives, financial situations, or needs of individual investors which are necessary considerations before making any investment decision. Investors should consider whether any advice or recommendation in this research is suitable for their particular circumstances and, where appropriate, seek professional advice, including legal, tax, accounting, investment, or other advice. The views expressed herein are solely those of Steve Blumenthal as of the date of this report and are subject to change without notice.
Investing involves risk.
This letter may contain forward-looking statements relating to the objectives, opportunities, and future performance of the various investment markets, indices, and investments. Forward-looking statements may be identified by the use of such words as; “believe,” anticipate,” “planned,” “potential,” and other similar terms. Examples of forward-looking statements include, but are not limited to, estimates with respect to financial condition, results of operations, and success or lack of success of any particular market, index, investment, or investment strategy. All are subject to various factors, including, but not limited to, general and local economic conditions, changing levels of competition within certain industries and markets, changes in legislation or regulation, Federal Reserve policy, and other economic, competitive, governmental, regulatory, and technological factors affecting markets, indices, investments, investment strategy and portfolio positioning that could cause actual results to differ materially from projected results. Such statements are forward-looking in nature and involve a number of known and unknown risks, uncertainties, and other factors, and accordingly, actual results may differ materially from those reflected or contemplated in such forward-looking statements. Investors are cautioned not to place undue reliance on any forward-looking statements or examples. All statements made herein speak only as of the date that they were made. Investing is inherently risky and all investing involves the potential risk of loss.
Past performance does not guarantee or indicate future results. Different types of investments involve varying degrees of risk, and there can be no assurance that the future performance of any specific investment, investment strategy, or product (including the investments and/or investment strategies recommended or undertaken by CMG), or any non-investment related content, made reference to directly or indirectly in this commentary will be profitable, equal any corresponding indicated historical performance level(s), be suitable for your portfolio or individual situation or prove successful. Due to various factors, including changing market conditions and/or applicable laws, the content may no longer be reflective of current opinions or positions. Moreover, you should not assume that any discussion or information contained in this commentary serves as the receipt of, or as a substitute for, personalized investment advice from CMG. Please remember to contact CMG, in writing, if there are any changes in your personal/financial situation or investment objectives for the purpose of reviewing/evaluating/revising our previous recommendations and/or services, or if you would like to impose, add, or to modify any reasonable restrictions to our investment advisory services. Unless, and until, you notify us, in writing, to the contrary, we shall continue to provide services as we do currently. CMG is neither a law firm, nor a certified public accounting firm, and no portion of the commentary content should be construed as legal or accounting advice.
No portion of the content should be construed as an offer or solicitation for the purchase or sale of any security. References to specific securities, investment programs or funds are for illustrative purposes only and are not intended to be, and should not be interpreted as recommendations to purchase or sell such securities.
This presentation does not discuss, directly or indirectly, the amount of the profits or losses realized or unrealized, by any CMG client from any specific funds or securities. Please note: In the event that CMG references performance results for an actual CMG portfolio, the results are reported net of advisory fees and inclusive of dividends. The performance referenced is that as determined and/or provided directly by the referenced funds and/or publishers, has not been independently verified, and does not reflect the performance of any specific CMG client. CMG clients may have experienced materially different performance based upon various factors during the corresponding time periods. See in links provided citing limitations of hypothetical back-tested information. Past performance cannot predict or guarantee future performance. Not a recommendation to buy or sell. Please talk to your advisor.
Information herein has been obtained from sources believed to be reliable, but we do not warrant its accuracy. This document is general communication and is provided for informational and/or educational purposes only. None of the content should be viewed as a suggestion that you take or refrain from taking any action nor as a recommendation for any specific investment product, strategy, or other such purposes.
In a rising interest rate environment, the value of fixed-income securities generally declines, and conversely, in a falling interest rate environment, the value of fixed-income securities generally increases. High-yield securities may be subject to heightened market, interest rate, or credit risk and should not be purchased solely because of the stated yield. Ratings are measured on a scale that ranges from AAA or Aaa (highest) to D or C (lowest). Investment-grade investments are those rated from highest down to BBB- or Baa3.
NOT FDIC INSURED. MAY LOSE VALUE. NO BANK GUARANTEE.
Certain information contained herein has been obtained from third-party sources believed to be reliable, but we cannot guarantee its accuracy or completeness.
In the event that there has been a change in an individual’s investment objective or financial situation, he/she is encouraged to consult with his/her investment professional.
Written Disclosure Statement. CMG is an SEC-registered investment adviser located in Malvern, Pennsylvania. Stephen B. Blumenthal is CMG’s founder and CEO. Please note: The above views are those of CMG and its CEO, Stephen Blumenthal, and do not reflect those of any sub-advisor that CMG may engage to manage any CMG strategy, or exclusively determines any internal strategy employed by CMG. A copy of CMG’s current written disclosure statement discussing advisory services and fees is available upon request or via CMG’s internet web site at www.cmgwealth.com/disclosures. CMG is committed to protecting your personal information. Click here to review CMG’s privacy policies.
See CMG Disclosures at the bottom of this page.
For more information about NDR, please visit at www.ndr.com.
NDR, Inc. (NDR), d.b.a. Ned Davis Research Group (NDRG), any NDRG affiliates or employees, or any third-party data provider, shall not have any liability for any loss sustained by anyone who has relied on the information contained in any NDRG publication. The data and analysis contained herein are provided "as is." NDRG disclaims any and all express or implied warranties, including, but not limited to, any warranties of merchantability, suitability or fitness for a particular purpose or use. NDRG's past recommendations and model results are not a guarantee of future results. This communication reflects our analysts' opinions as of the date of this communication and will not necessarily be updated as views or information change. All opinions expressed herein are subject to change without notice. NDRG or its affiliated companies or their respective shareholders, directors, officers and/or employees, may have long or short positions in the securities discussed herein and may purchase or sell such securities without notice. For NDRG's important additional disclaimers, refer to www.ndr.com/invest/public/copyright.html. Further distribution prohibited without prior permission. Copyright 2025 © NDR, Inc. All rights reserved.