On My Radar: Valuations, Inflation, Stagflation, and Finding Value

November 7, 2025
By Steve Blumenthal
“Prices tell you everything. Patterns repeat because people don’t change. There’s nothing new in the market - only new traders.”
– Reminiscences of a Stock Operator, by Edwin Lefévre
As today’s letter hits your inbox, I’ll be landing in Phila. I was in Denver attending the annual Schwab Advisor conference. What a show. Every major vendor and product sponsor in the industry was there. My biggest takeaway in a word: technology. The conference concluded with a Keith Urban concert on Thursday evening. It was a jam-packed week.
I had a wonderful breakfast meeting yesterday with a brilliant friend. A former brain surgeon who is mostly retired, but he remains far too curious ever truly to retire. He does some consulting in areas that interest him. We caught up on life, kids, and golf. Given my obsession with risk management and my perhaps overly frequent messaging about the current macro state, he asked what I’m doing about it, investment-wise. It is the critical question. We’ll look at a few ideas today.
Finally, my team and I recently completed a paper on Tax Mitigation Strategies. The U.S. tax landscape, a complex system of laws and regulations often measured in the tens of thousands of pages, is not merely a set of restrictions; it is a catalog of incentives provided by Congress to encourage specific types of investment and economic activity. If you are a high-net-worth investor and interested in learning more, you’ll find the link to the paper in the Tax Mitigation Strategies section.
Grab that coffee and find your favorite chair. It’s been a few months since we last examined market valuations, so let’s do that today with an eye toward setting a mental entry target. Where is “fair value?” You’ll find it easy to see.
I conclude that we are in a period very similar to the 1966 stock market peak and, by some measures, higher than every major bull market peak since 1929. This sounds doom and gloom, but I don’t see it that way. There are plenty of opportunities.
On My Radar:
Valuations
Inflation - Stagflation Cycles, and Finding Value
Tax Mitigation Strategies
Trade Signals: November 6, 2025
Personal Note: Season Ending
OMR is for informational and educational purposes only. No consideration is given to your specific investment needs, objectives, or tolerances.
Please see the Important Disclosures at the bottom of this page. Reminder: This is not a recommendation to buy or sell any security. My views may change at any time. The information is for discussion and educational purposes only.
If you like what you are reading, you can subscribe for free.

Valuations
The purpose of reviewing the valuation data monthly is to identify market extremes. I typically provide you with an update quarterly. The last was in July. Let’s see where we are today.
Focus on “Fair Value” and think of that point as a good investment opportunity.
And focus on extreme moves below fair value, thinking of that point as an exceptional opportunity.
In summary, the broad market remains extremely overpriced. Yet, that doesn’t mean there aren't opportunities in other areas. Value-oriented stocks, in general, look fairly valued.
Just because the general stock market is overvalued doesn’t mean everything is. We’ll examine high-yielding dividend payers and discuss other investment themes further below.
As you review the valuation data, focus on “fair value” and consider it an opportunity presenting itself. It is most likely to occur during a recession/stock market dislocation. Measuring market extremes is relatively easy, but timing is impossible to predict accurately. Thus, being prepared in advance is a smart move.
One of my favorite valuation measures is the Price-to-Sales ratio. I also like NDR’s Median PE. Following, we’ll review both along with Warren Buffett’s favorite, Total Stock Market Cap to GDP.
Price-to-Sales Ratio
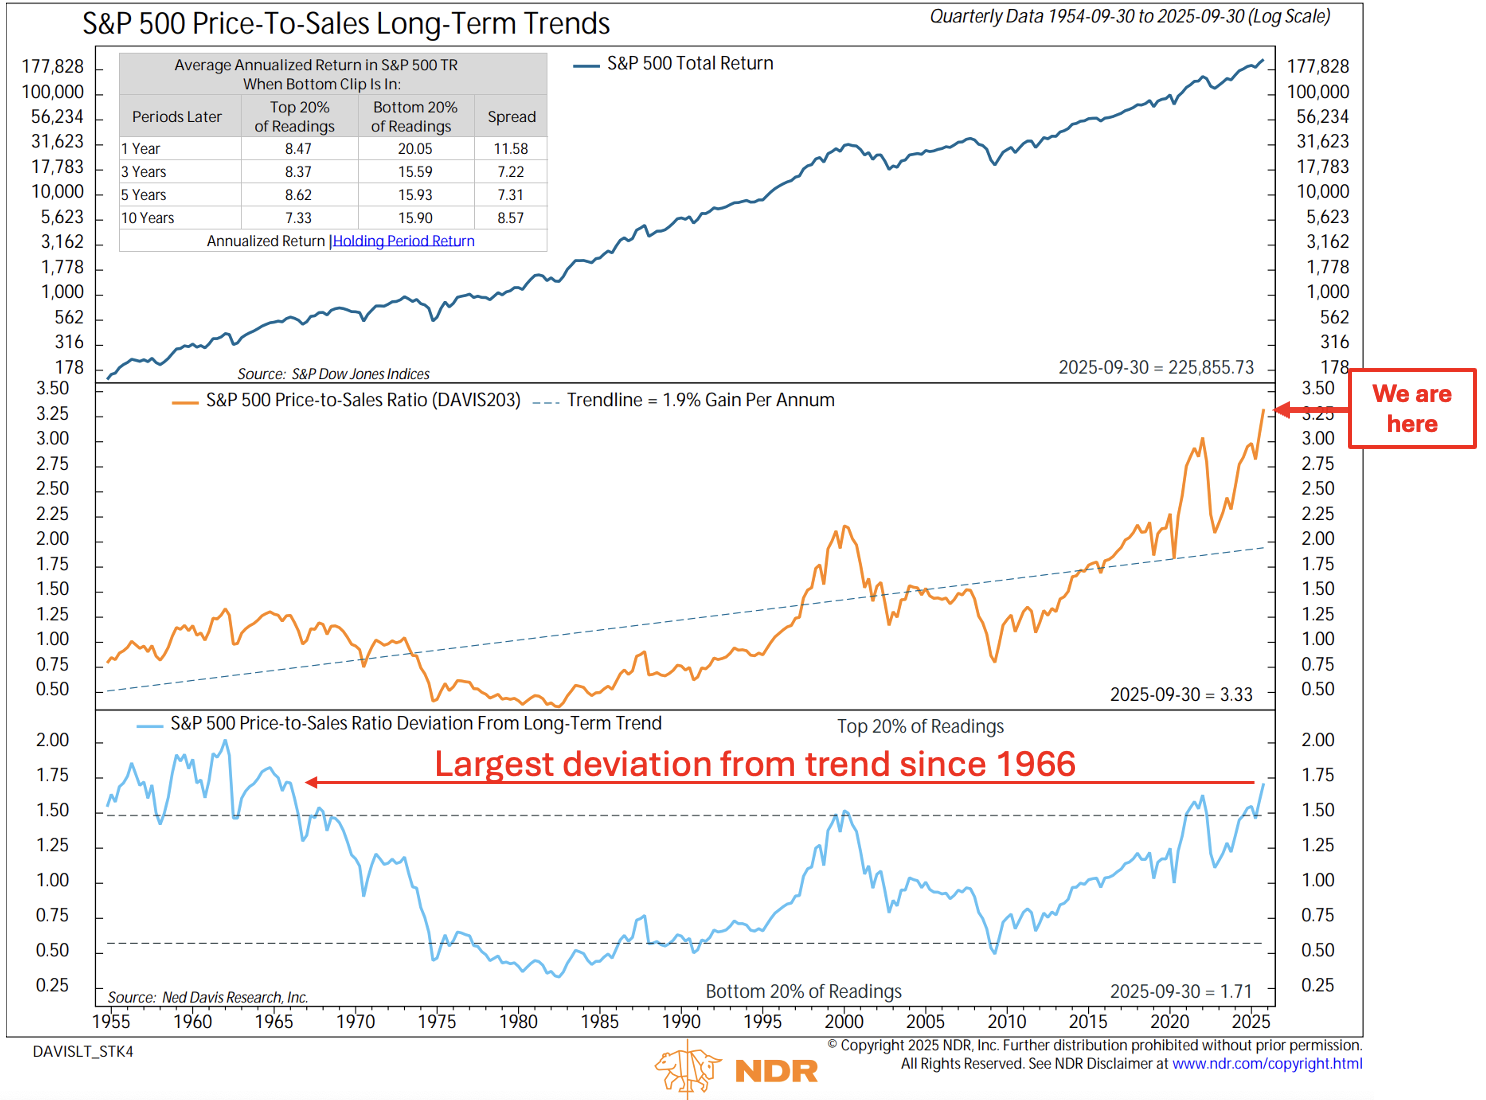
The Price-to-Sales ratio is a key valuation metric that measures how much investors are paying for each dollar of a company's sales. Unlike the P/E ratio, P/S is less sensitive to earnings volatility, making it a reliable tool for comparing companies within the same industry or assessing revenue efficiency, or comparing an index’s current state to its long-term historical trends.
When I last shared this data with you in July, the orange line (“We are here” red arrow) was challenging its 2021 high (which was then a record high reading).
In the lower section, I drew a red line pointing back to 1966. 1966 marked the peak of the post-World War II bull market. It wasn’t until 1980 that investors regained even footing.
The chart jumped off the page at me while reviewing this morning:
Source: NDR, CMG Investment Research notations
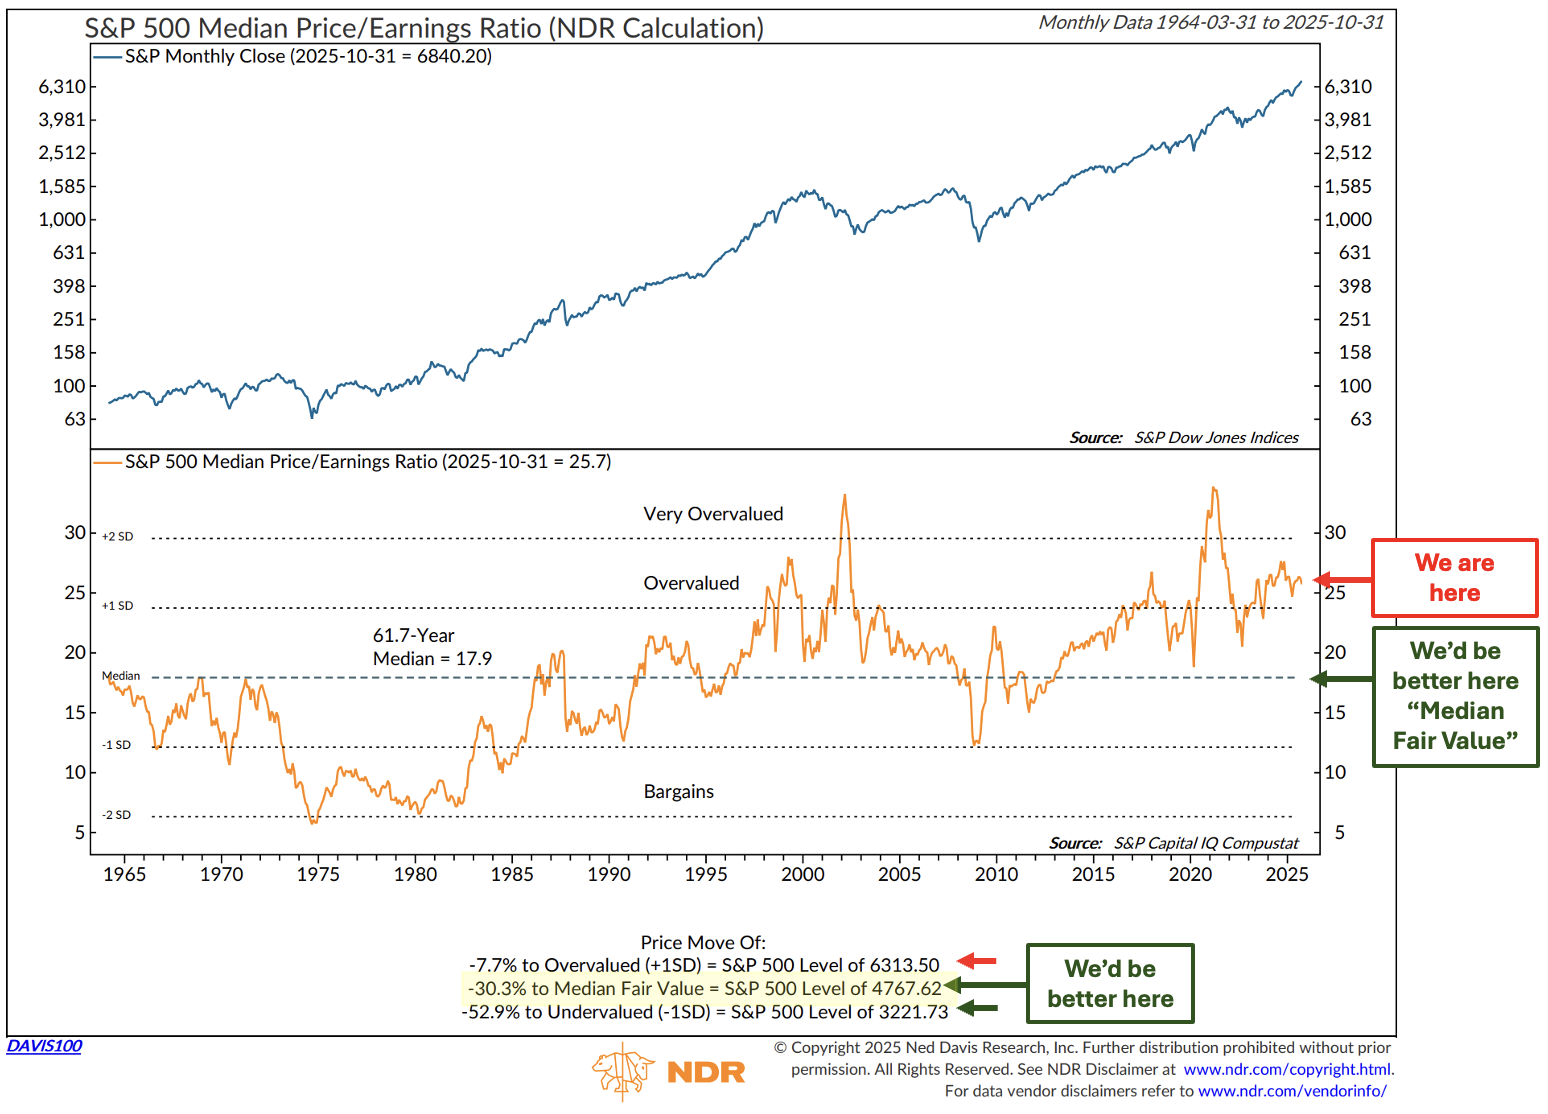
Median Fair Value is 30.3% below the October S&P 500 Index Close
Note the red and green arrows.
Median Fair Value is at 4,767 (that’s a good target to keep in mind).
“We’d be better off here,” points to the 61.7-year median PE of 17.9.
Median PE as of 10-31-25 is 25.7.
Source: NDR, CMG Investment Research notations
S&P 500 Index vs Stock Market Capitalization as a Percentage of GDI
The middle section (orange line) plots month-by-month market cap as a percentage of nominal (before inflation factored in) gross domestic income. The dotted line is an upsloping regression trend line.
The lower section (blue line) plots how far above or below the orange line is vs the trendline. When the blue line is above the upper dotted line, it is in the “Top Quintile” of all readings dating back to 1925. When below the bottom dotted line, it is in the “Bottom Quintile” of all readings since 1925.
NDR then plots the “Averge % Change in the S&P 500” that occurred 1-, 3-,5-, 7-, 9-, and 11 years later when your starting point was in the “Top Quintile” and when your starting point was in the “Bottom Quintile.”
Bottom line: Highest reading (data back to 1954) and the “largest deviation from trend since 1966.” Warning Will Robinson, Warning Will! (Oldtimers will get that).

Source: NDR, CMG Investment Research
Hussman’s “Most Reliable” Valuation Measure
“To be clear – this is not a price chart. It’s a valuation chart. It aligns precisely with the happiest and most satisfying moment of a speculative bubble: the point where wildly misaligned expectations for market returns are being realized anyway – via self-fulfilling speculation. If you understand how a bubble works, this chart is both strikingly beautiful from a mathematical standpoint, yet utterly terrifying from an investment perspective.” Source: John Hussman, An Unsustainable Equilibrium, October 27, 2025
John says the following is his “most reliable valuation measure which is based on correlation with actual subsequent S&P 500 10-to-12 year total returns using historical data spanning a century of market cycles.”
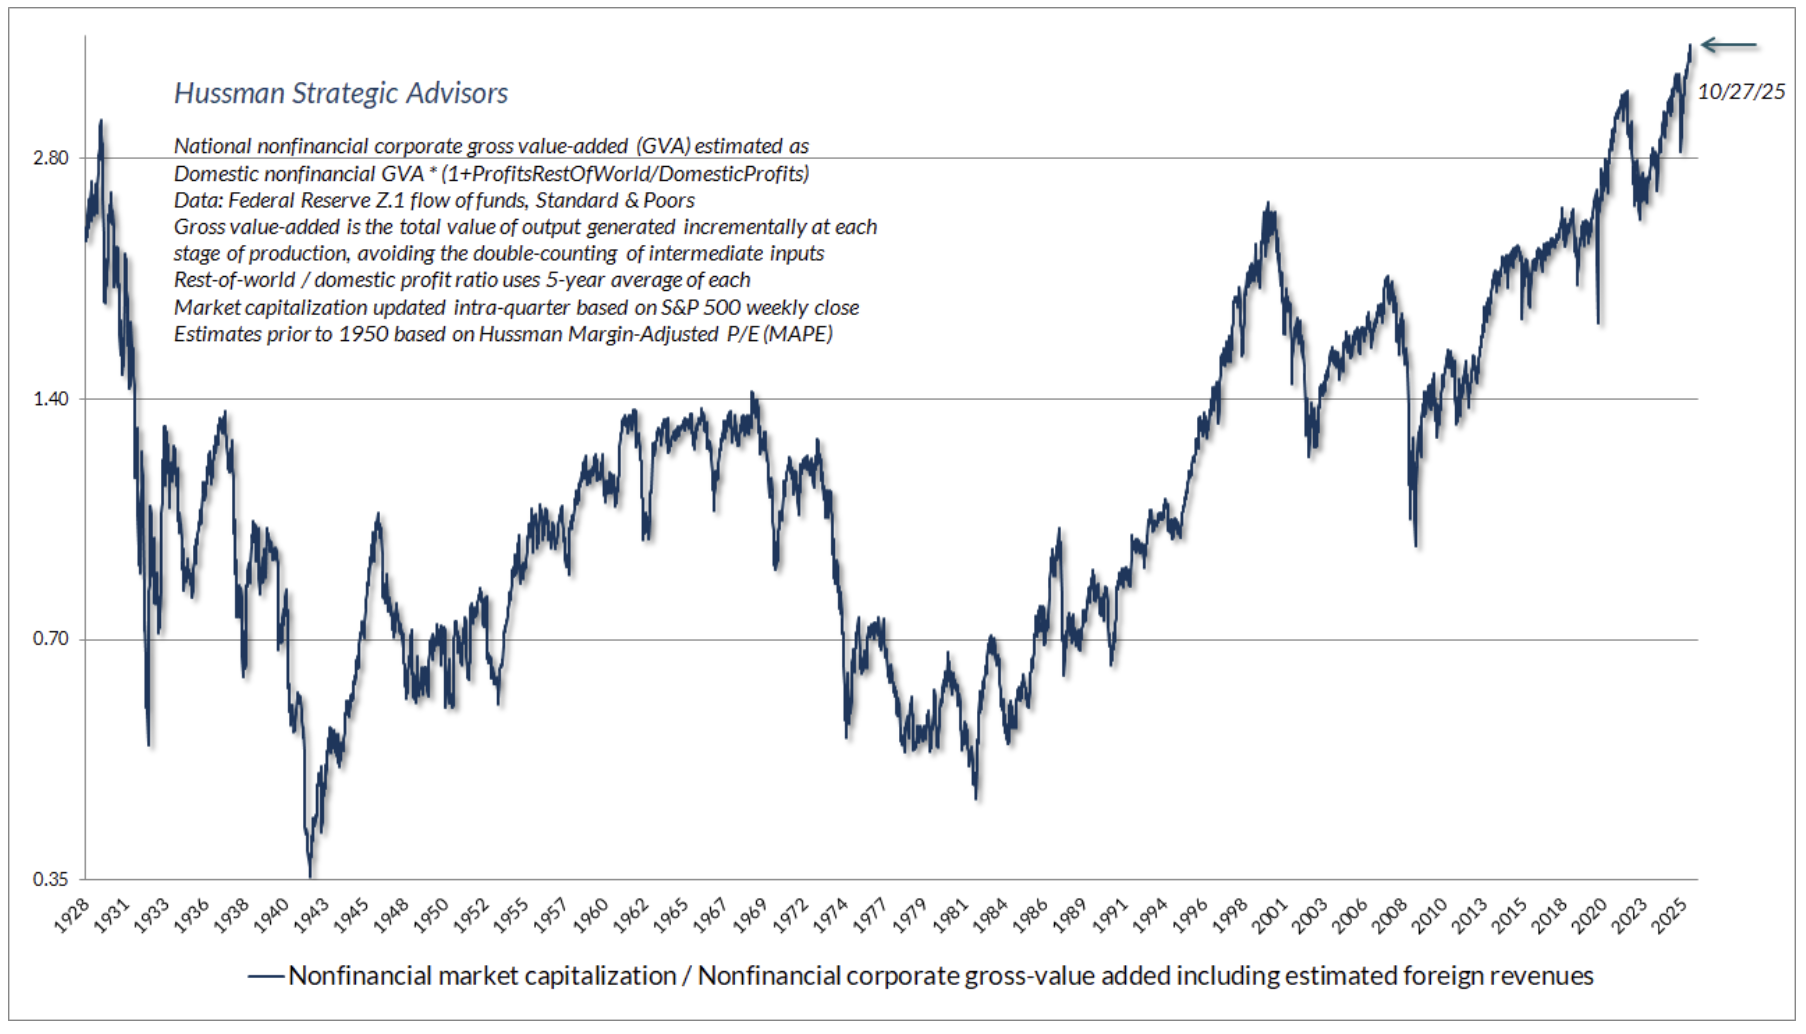
From Hussman, “The chart below shows our most reliable gauge of market valuations in data since 1928: the ratio of nonfinancial market capitalization to gross value-added (MarketCap/GVA). Gross value-added is the sum of corporate revenues generated incrementally at each stage of production, so MarketCap/GVA might be reasonably be viewed as an economy-wide, apples-to-apples price/revenue multiple for U.S. nonfinancial corporations.”
The blue line shows the market capitalization of U.S. non-financial equities as a ratio to their gross value-added, including our estimate of foreign revenues.
The arrow in the upper right points to the current level, which is higher than all prior stock market bubble peaks: 1929, 1966, 2000, and 2021.
Source: HussmanFunds
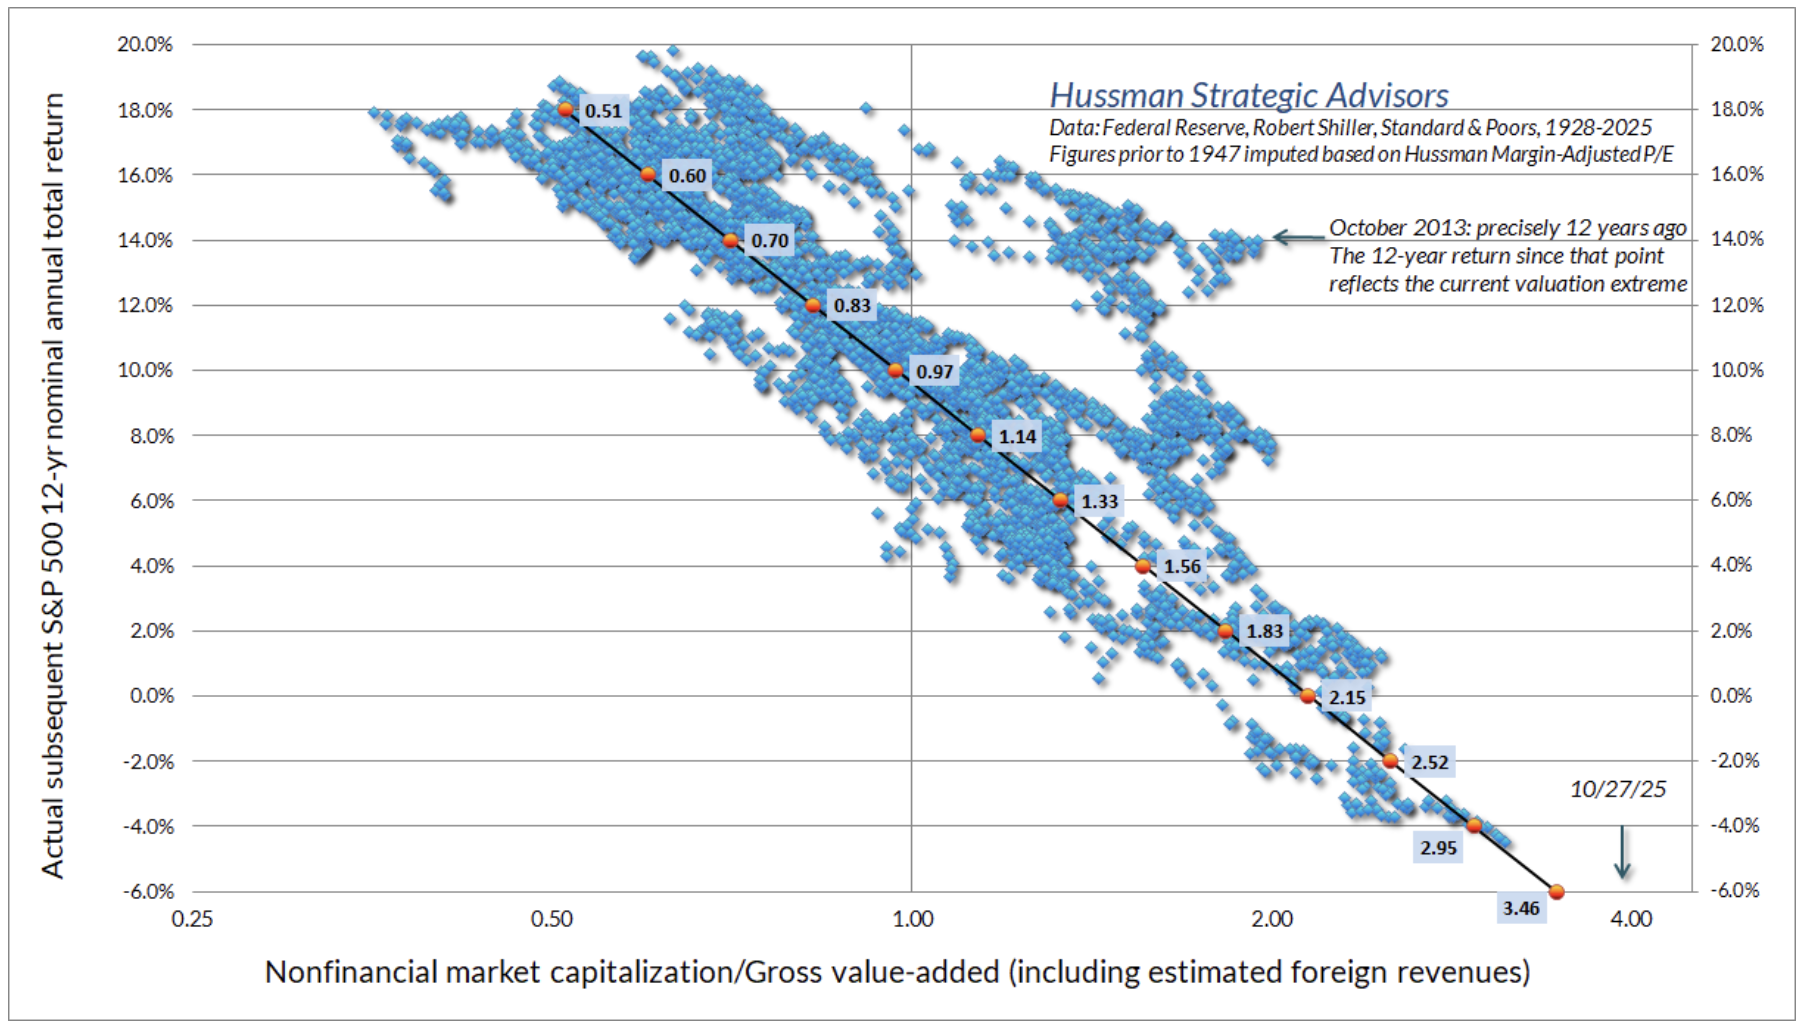
In terms of subsequent 12-year returns, Hussman’s says, “The scatterplot below shows this same measure versus actual subsequent 12-year average annual S&P 500 nominal total returns. Recall how “errors” work – since a bubble peak features valuations that are vastly beyond historical norms, the market returns during the 12-year period leading up to that bubble peak are also vastly beyond the returns one would have expected based on the starting valuations at that time.
As I’ve detailed in prior comments, these “errors” are informative. Large positive “errors” over the trailing 12-year period are associated with dismal market returns over the subsequent 12-year period. This reflects the fact that the end of the trailing period and the beginning of the future period is a bubble extreme.”
The arrow in the lower right is pointing to a -6% nominal annual return outcome 12 years from now.” Losing 6% per year is a significant loss, although slightly mitigated by the adverse compounding effect. Regardless, not a good number.
Source: HussmanFunds
The Buffett Indicator
With the Q1 GDP third estimate and the June close data, we now have an updated look at the popular "Buffett Indicator:" the ratio of corporate equities to GDP.
The current reading is 208.6%, a record high (data back to 1924).
AdvisorPerspectives says this, “The 'Buffett Indicator,' an imperfect but useful metric for assessing whether equity valuations have become bloated, has risen past its pandemic-era record that preceded 2022’s bear market. The measure pits total market capitalization of US stocks. These days, it shows the stock market is more than twice the size of the economy, even after GDP grew at the fastest pace in nearly two years.”

Source: NDR, CMG Investment Research
Inflation - Stagflation Cycles, and Finding Value
I continue to believe that, given the government's debt and spending challenges, all roads lead to inflation.
On My Radar: On Path to a New Monetary System
On My Radar: It’s All Happened Before For the Same Reasons
On My Radar: Our Dollar, Your Problem
What is certain to me, though I can’t guarantee it, is that we will always experience bull and bear market cycles in stocks, interest rates, commodities, and inflation—understanding where we are in the cycle matters. As Jessie Livermore wrote in one of the most excellent investment books of all time, “Prices tell you everything. Patterns repeat because people don’t change. There’s nothing new in the market - only new traders.”
This week, there have been some wobbles in the market, but the price trend data I share in Trade Signals continues to evidence a bull market. We watch and monitor.
In the big picture, I believe we are transitioning from a speculative equity bull market bubble / low-inflation cycle to a period that will see higher inflation, rising interest rates (on the long-end of the curve), and overpriced stocks revert to their fair values. An environment that favors select stock picking and undervalued asset classes, which we’ll look at below.
History cycles, and my best guess is that we may be approaching a period similar to the 1966 - 1980 era. A secular bull market peak in 1966, a change in the currency in 1971 (Nixon took us off the gold standard), inflation, a commodity, and a gold secular bull market.
The period from the U.S. stock market peak in early 1966 (S&P 500 ~94) through 1980 was marked by stagflation, high inflation averaging ~7.1% annually, two recessions (1969-70 and 1973-75), and the 1973 and 1979 oil crises, resulting in nominal S&P 500 price returns of essentially flat and real total returns (including dividends) of about -1.5% CAGR, as equities struggled to keep pace with eroding purchasing power.
Inflation beneficiaries and alternatives performed well, particularly commodities tied to supply shocks and gold.
Here is a brief summary:
Commodities and real assets thrived as hedges against the era's ~110% cumulative inflation, while equity indices and bonds suffered from rising rates (10-year Treasury yields hit 15%).
Industrial metals, agriculture, and energy surged on inflation and supply disruptions.
Gold and oil performed well.
Real estate provided rental income and appreciation as a tangible asset.
Energy and commodities-related firms (e.g., oil producers) performed well; however, the broader market lagged, but value/dividend stocks outpaced inflation slightly.
High and Growing Dividend Stocks slightly beat inflation.
The following are the key performers during that cycle:
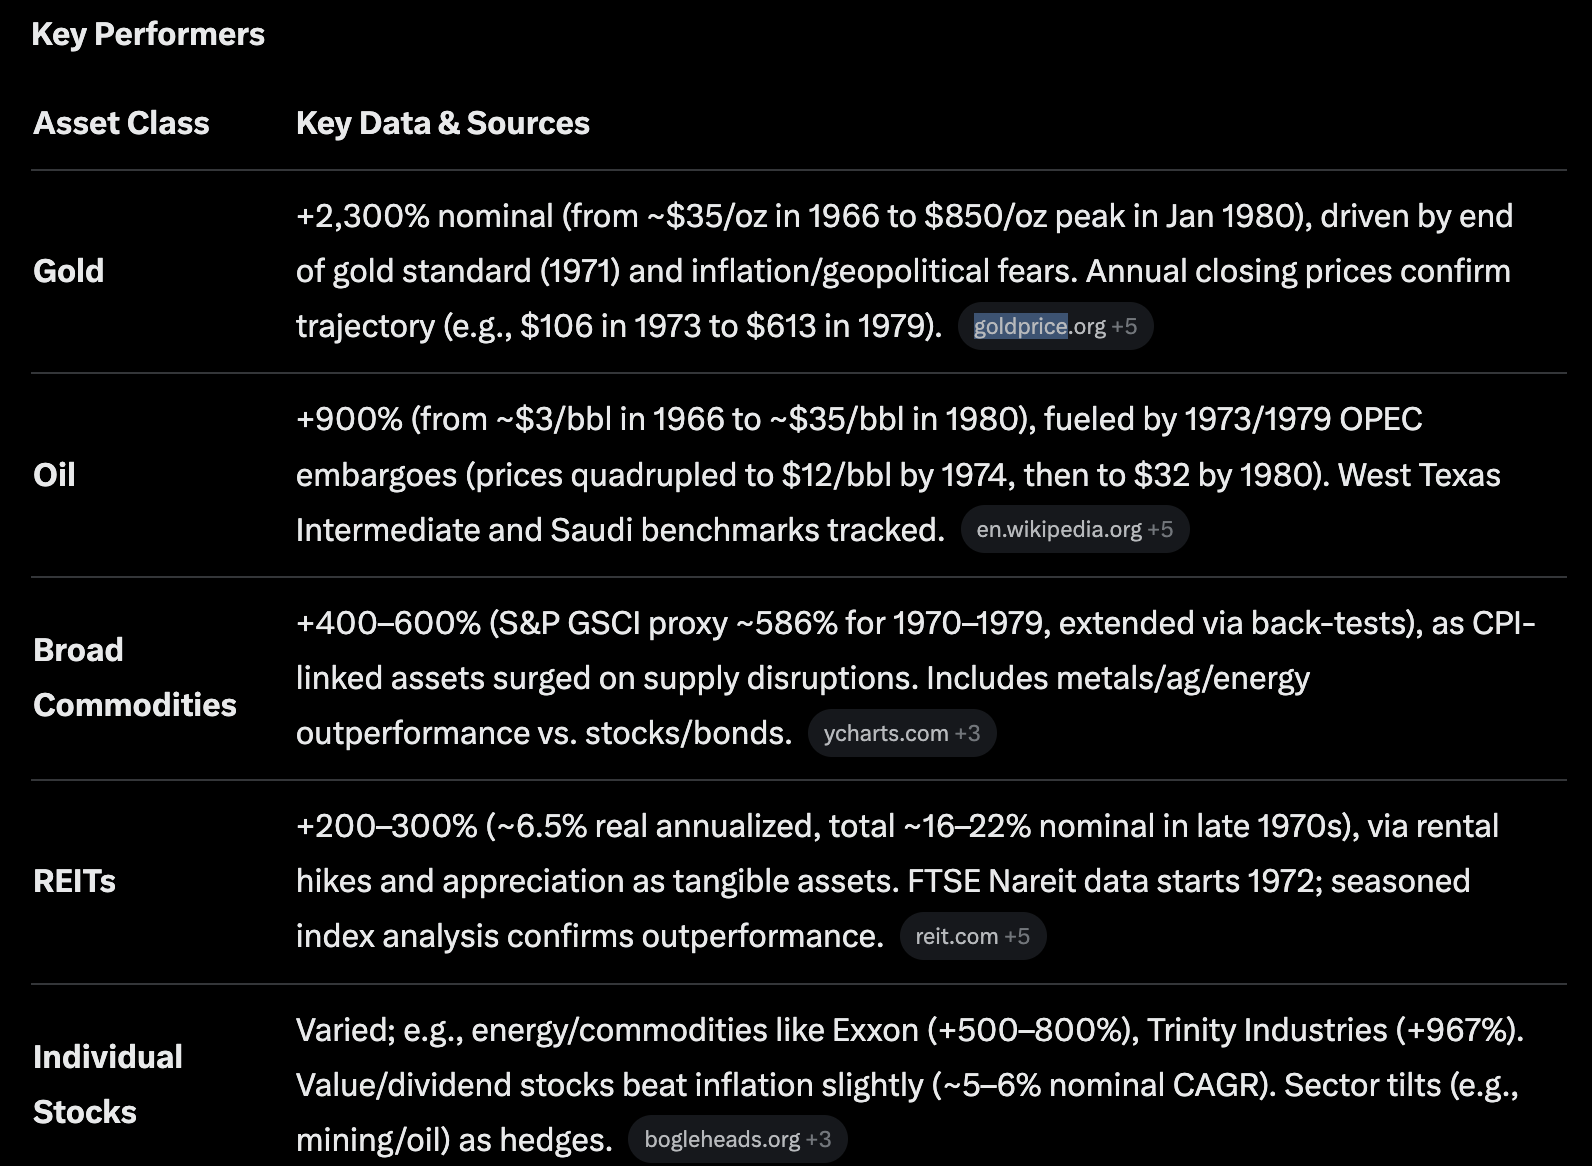
AI generated, Sources follow below
Note the sources in each category if you’d like to dig further. Various sources were cross-verified for consistency (e.g., gold/oil surges align across datasets). Sources included: Wikipedia, YCharts, Reit.com, Bogleheads.org, Goldprice.org, the BLS CPI, Macrotrends charts, or Nareit archives.
Conclusion: I can’t mention specific securities, but within our multi-family office, I can tell you we are avoiding overpriced cap-weighted equity indices and bonds in general. Instead, we are finding good returns in niche lending strategies, absolute return managers, gold, metals, uranium, and select direct investments in venture capital and private equity. We like bio-agriculture, select pharmaceutical assets, oil and natural gas, gold, select digital assets, and high-dividend-paying companies. Additionally, we allocate to absolute return strategies and are interested in AI and Robotics. Please note that this is not a recommendation for you to buy or sell anything, nor is it a sales pitch for my firm. I hope it fuels some discussion with your advisor.
As a quick aside: A 60-40 stocks and bonds allocation is fine if you can hold on tight for the long run and dollar-cost average along the way. My experience is that, by and large, most people lack the DNA to avoid behaving badly at the wrong times.
Gold
I am frequently asked about gold. Especially, recently, given its price correction.
In the late 1970s and early 1980s, gold’s rise had gone parabolic. At the peak in 1980, the price of gold was nearly 400% above its long-term trend. Gold bottomed in the early 2000s. Today, the move is starting to look parabolic. However, given the likelihood of continued government money printing, its impact on inflation and the dollar, I believe we are moving towards a restructuring of our currency (and that of other developed countries as well). Also, I believe gold is essential for restoring confidence in the dollar and other financial systems. We are not yet at that point. I remain bullish on gold, think we're in the third inning of a nine-inning game, and favor buying the dips. We are currently experiencing one of the dips.
PLEASE KNOW THIS IS NOT A RECOMMENDATION FOR YOU TO BUY OR SELL ANYTHING. There is no guarantee my view will prove to be correct. Talk with your advisor.

Source: NDR
See important CMG and NDR disclosures below.
Tax Mitigation Strategies
The U.S. tax landscape, a complex system of laws and regulations often measured in the tens of thousands of pages, is not merely a set of restrictions; it is a catalog of incentives provided by Congress to encourage specific types of investment and economic activity.
This paper is designed to complement traditional investment allocation planning by providing a basic foundational understanding of sophisticated tax mitigation strategies. By exploring these strategies, we encourage investors to view the tax code as a powerful tool for wealth creation, not just a liability to be managed.
Click here or on the icon to sign up for the paper (it’s free):

If you like what you are reading, click on the following link.
CLICK HERE TO SUBSCRIBE TO ON MY RADAR - IT’S FREE
Not a recommendation to buy or sell any security. Please note that the information provided is not recommended for buying or selling any security and is provided for discussion purposes only. Current viewpoints are subject to change. Please note that the information provided is not recommended for buying or selling any security and is provided for discussion purposes only.
Trade Signals: November 6, 2025 Update
Trade Signals is Organized in the Following Sections:
*Trade Signals basics: The Market Commentary section summarizes notable changes in the core key indicators: Investor sentiment, market breadth, stocks, treasury yields, the dollar, and gold. The Dashboard of Indicators provides a detailed view of all Trade Signals indicators.
Market Commentary
ADP and Challenger reported on the state of employment this week. Of course, the government jobs data report will not come out this Friday due to the ongoing government shutdown. The following is a brief summary of the current state of employment, as reported by ADP and Challenger:
The ADP National Employment Report
ADP tracks the increase in private-sector payrolls, which represents the net addition of jobs (i.e., the number of jobs added minus the number of jobs lost). Bottom line: Private sector employment increased by +42,000 jobs.
The Challenger Report
Employers announced a total of 153,074 planned job cuts.
Bottom line: The Challenger report should be taken as a strong signal that the labor market's decline is accelerating, contradicting Federal Reserve Chair Jerome Powell's recent description of a "very gradual cooling."
The ADP data confirms the cooling trend and the contraction in white-collar employment.
The Challenger data confirms that corporate anxiety is spiking, with businesses now aggressively planning cuts.
Key Macro Indicators - Investor Sentiment, Market Breadth, The S&P 500 Index (Stocks), The 10-year Treasury Yield (Bonds), and the Dollar
About Trade Signals
Trade Signals is a paid subscription service that posts the daily, weekly, and monthly trends in the markets (and more). Free for CMG clients. Not a recommendation to buy or sell any security. For discussion purposes only.
“Extreme patience combined with extreme decisiveness. You may call that our investment process.
Yes, it’s that simple.”
– Charlie Munger

TRADE SIGNALS SUBSCRIPTION ACKNOWLEDGEMENT / IMPORTANT DISCLOSURES
The views expressed herein are solely those of Steve Blumenthal as of the date of this report and are subject to change without notice. Not a recommendation to buy or sell any security.
Please note that the information provided is not recommended for buying or selling any security and is provided for discussion purposes only. Current viewpoints are subject to change. Please note that the information provided is not recommended for buying or selling any security and is provided for discussion purposes only.
Personal Note: Season Ending, Final Game
"When it’s all said and done, the scoreboard fades. What remains is how we made people better, how we made them feel, the culture we helped build, and the lives we elevated along the climb."
— The Daily Coach
Tomorrow is the final game of the season for the Malvern Prep soccer team. A win and Coach Sue and her Friars boys soccer team finish nine wins, ten losses, and two ties. The team currently sits in fifth place in the InterAc conference, which is most important to them. A win tomorrow secures 5th place. Not the outcome the team envisioned, but the real win will be with them for the rest of their lives. F.A.M.I.L.Y.
The World Series
There was a wonderful story in the Daily Coach about Game Seven of the World Series. It is titled, Back-to-Back: How Great Teams Find a Way and the Will to Win.
From the article, “When it’s all said and done, the scoreboard fades. What remains is how we made people better, how we made them feel, the culture we helped build, and the lives we elevated along the climb.” I read that and immediately thought about Susan. Win or lose, when you have a team of really good people, there is always some emotion when the season comes to an end. The amount of love poured into the players. I appreciate my college coach so much more today than I did after the season ended. One day, they will know.
Congratulations to the LA Dodgers and heartfelt condolences to the Toronto Blue Jays. A bottom of the ninth inning slide into home, a quarter of an inch from scoring the winning run, sent the game into extra innings and ultimately a Dodgers back-to-back World Champion repeat. What a series!
The Daily Coach said, “It was the kind of night even Hollywood couldn’t script — a masterpiece of resilience, emotion, high performance, leadership, and human connection.
Both teams faced adversity throughout the postseason. Both were tested. Yet both kept finding a way. And that’s the beauty of sport, leadership, and life.”
“The summit is temporary and never guaranteed. The climb is daily and always earned.”
I’m going to be next to Susan on the sidelines tomorrow, with a notebook in hand and a lot of love in my heart. This year’s senior class is special. They will be missed.
All the best to you and the young athletes in your life.
It is really about life! Ever forward…
Wishing you a wonderful week,
Steve
CLICK HERE TO SUBSCRIBE TO ON MY RADAR - IT’S FREE
You can share this letter on X by clicking here.
You can share this letter on LinkedIn by clicking here.
Subscribe to OMR for free by clicking the photo.
Stephen B. Blumenthal
Executive Chairman & CIO
CMG Capital Management Group, Inc.
75 Valley Stream Parkway, Suite 201,
Malvern, PA 19355
CMG Customer Relationship Summary (Form CRS)
Metric-Financial, LLC Customer Relationship Summary (Form CRS)

Stephen Blumenthal founded CMG Capital Management Group in 1992 and serves today as its Executive Chairman and CIO. Steve authors a free weekly e-letter entitled, “On My Radar.” Steve shares his views on macroeconomic research, valuations, portfolio construction, asset allocation and risk management. Author of Forbes Book: On My Radar, Navigating Stock Market Cycles.
Follow Steve on X @SBlumenthalCMG and LinkedIn.
IMPORTANT DISCLOSURE INFORMATION
This document is prepared by CMG Capital Management Group, Inc. (“CMG”) and is circulated for informational and educational purposes only. There is no consideration given to the specific investment needs, objectives, or tolerances of any of the recipients. Additionally, CMG’s actual investment positions may, and often will, vary from its conclusions discussed herein based on any number of factors, such as client investment restrictions, portfolio rebalancing, and transaction costs, among others. Recipients should consult their own advisors, including tax advisors, before making any investment decision. This material is for informational and educational purposes only and is not an offer to sell or the solicitation of an offer to buy the securities or other instruments mentioned. This material does not constitute a personal recommendation or take into account the particular investment objectives, financial situations, or needs of individual investors which are necessary considerations before making any investment decision. Investors should consider whether any advice or recommendation in this research is suitable for their particular circumstances and, where appropriate, seek professional advice, including legal, tax, accounting, investment, or other advice. The views expressed herein are solely those of Steve Blumenthal as of the date of this report and are subject to change without notice.
Investing involves risk.
This letter may contain forward-looking statements relating to the objectives, opportunities, and future performance of the various investment markets, indices, and investments. Forward-looking statements may be identified by the use of such words as; “believe,” anticipate,” “planned,” “potential,” and other similar terms. Examples of forward-looking statements include, but are not limited to, estimates with respect to financial condition, results of operations, and success or lack of success of any particular market, index, investment, or investment strategy. All are subject to various factors, including, but not limited to, general and local economic conditions, changing levels of competition within certain industries and markets, changes in legislation or regulation, Federal Reserve policy, and other economic, competitive, governmental, regulatory, and technological factors affecting markets, indices, investments, investment strategy and portfolio positioning that could cause actual results to differ materially from projected results. Such statements are forward-looking in nature and involve a number of known and unknown risks, uncertainties, and other factors, and accordingly, actual results may differ materially from those reflected or contemplated in such forward-looking statements. Investors are cautioned not to place undue reliance on any forward-looking statements or examples. All statements made herein speak only as of the date that they were made. Investing is inherently risky and all investing involves the potential risk of loss.
Past performance does not guarantee or indicate future results. Different types of investments involve varying degrees of risk, and there can be no assurance that the future performance of any specific investment, investment strategy, or product (including the investments and/or investment strategies recommended or undertaken by CMG), or any non-investment related content, made reference to directly or indirectly in this commentary will be profitable, equal any corresponding indicated historical performance level(s), be suitable for your portfolio or individual situation or prove successful. Due to various factors, including changing market conditions and/or applicable laws, the content may no longer be reflective of current opinions or positions. Moreover, you should not assume that any discussion or information contained in this commentary serves as the receipt of, or as a substitute for, personalized investment advice from CMG. Please remember to contact CMG, in writing, if there are any changes in your personal/financial situation or investment objectives for the purpose of reviewing/evaluating/revising our previous recommendations and/or services, or if you would like to impose, add, or to modify any reasonable restrictions to our investment advisory services. Unless, and until, you notify us, in writing, to the contrary, we shall continue to provide services as we do currently. CMG is neither a law firm, nor a certified public accounting firm, and no portion of the commentary content should be construed as legal or accounting advice.
No portion of the content should be construed as an offer or solicitation for the purchase or sale of any security. References to specific securities, investment programs or funds are for illustrative purposes only and are not intended to be, and should not be interpreted as recommendations to purchase or sell such securities.
This presentation does not discuss, directly or indirectly, the amount of the profits or losses realized or unrealized, by any CMG client from any specific funds or securities. Please note: In the event that CMG references performance results for an actual CMG portfolio, the results are reported net of advisory fees and inclusive of dividends. The performance referenced is that as determined and/or provided directly by the referenced funds and/or publishers, has not been independently verified, and does not reflect the performance of any specific CMG client. CMG clients may have experienced materially different performance based upon various factors during the corresponding time periods. See in links provided citing limitations of hypothetical back-tested information. Past performance cannot predict or guarantee future performance. Not a recommendation to buy or sell. Please talk to your advisor.
Information herein has been obtained from sources believed to be reliable, but we do not warrant its accuracy. This document is general communication and is provided for informational and/or educational purposes only. None of the content should be viewed as a suggestion that you take or refrain from taking any action nor as a recommendation for any specific investment product, strategy, or other such purposes.
In a rising interest rate environment, the value of fixed-income securities generally declines, and conversely, in a falling interest rate environment, the value of fixed-income securities generally increases. High-yield securities may be subject to heightened market, interest rate, or credit risk and should not be purchased solely because of the stated yield. Ratings are measured on a scale that ranges from AAA or Aaa (highest) to D or C (lowest). Investment-grade investments are those rated from highest down to BBB- or Baa3.
NOT FDIC INSURED. MAY LOSE VALUE. NO BANK GUARANTEE.
Certain information contained herein has been obtained from third-party sources believed to be reliable, but we cannot guarantee its accuracy or completeness.
In the event that there has been a change in an individual’s investment objective or financial situation, he/she is encouraged to consult with his/her investment professional.
Written Disclosure Statement. CMG is an SEC-registered investment adviser located in Malvern, Pennsylvania. Stephen B. Blumenthal is CMG’s founder and CEO. Please note: The above views are those of CMG and its CEO, Stephen Blumenthal, and do not reflect those of any sub-advisor that CMG may engage to manage any CMG strategy, or exclusively determines any internal strategy employed by CMG. A copy of CMG’s current written disclosure statement discussing advisory services and fees is available upon request or via CMG’s internet web site at www.cmgwealth.com/disclosures. CMG is committed to protecting your personal information. Click here to review CMG’s privacy policies.
See CMG Disclosures at the bottom of this page.
For more information about NDR, please visit at www.ndr.com.
NDR, Inc. (NDR), d.b.a. Ned Davis Research Group (NDRG), any NDRG affiliates or employees, or any third-party data provider, shall not have any liability for any loss sustained by anyone who has relied on the information contained in any NDRG publication. The data and analysis contained herein are provided "as is." NDRG disclaims any and all express or implied warranties, including, but not limited to, any warranties of merchantability, suitability or fitness for a particular purpose or use. NDRG's past recommendations and model results are not a guarantee of future results. This communication reflects our analysts' opinions as of the date of this communication and will not necessarily be updated as views or information change. All opinions expressed herein are subject to change without notice. NDRG or its affiliated companies or their respective shareholders, directors, officers and/or employees, may have long or short positions in the securities discussed herein and may purchase or sell such securities without notice. For NDRG's important additional disclaimers, refer to www.ndr.com/invest/public/copyright.html. Further distribution prohibited without prior permission. Copyright 2025 © NDR, Inc. All rights reserved.