October 30, 2026
By Steve Blumenthal
“The crisis takes a much longer time coming than you think, and then it happens much faster than you would have thought.”
– Rudi Dornbusch
I sat down this morning intending to write about Black October. That's what some in the cybersecurity world are calling this month, following reports that AI-powered tools have exposed serious vulnerabilities across the web. Then came news of a reported $6.3 billion crypto theft tied to Binance, the world's largest crypto exchange. A quick practical suggestion before we go further: update your passwords and turn on two-factor authentication. Today.
But cybersecurity is only part of the story. There are cracks forming elsewhere, and they deserve our attention.
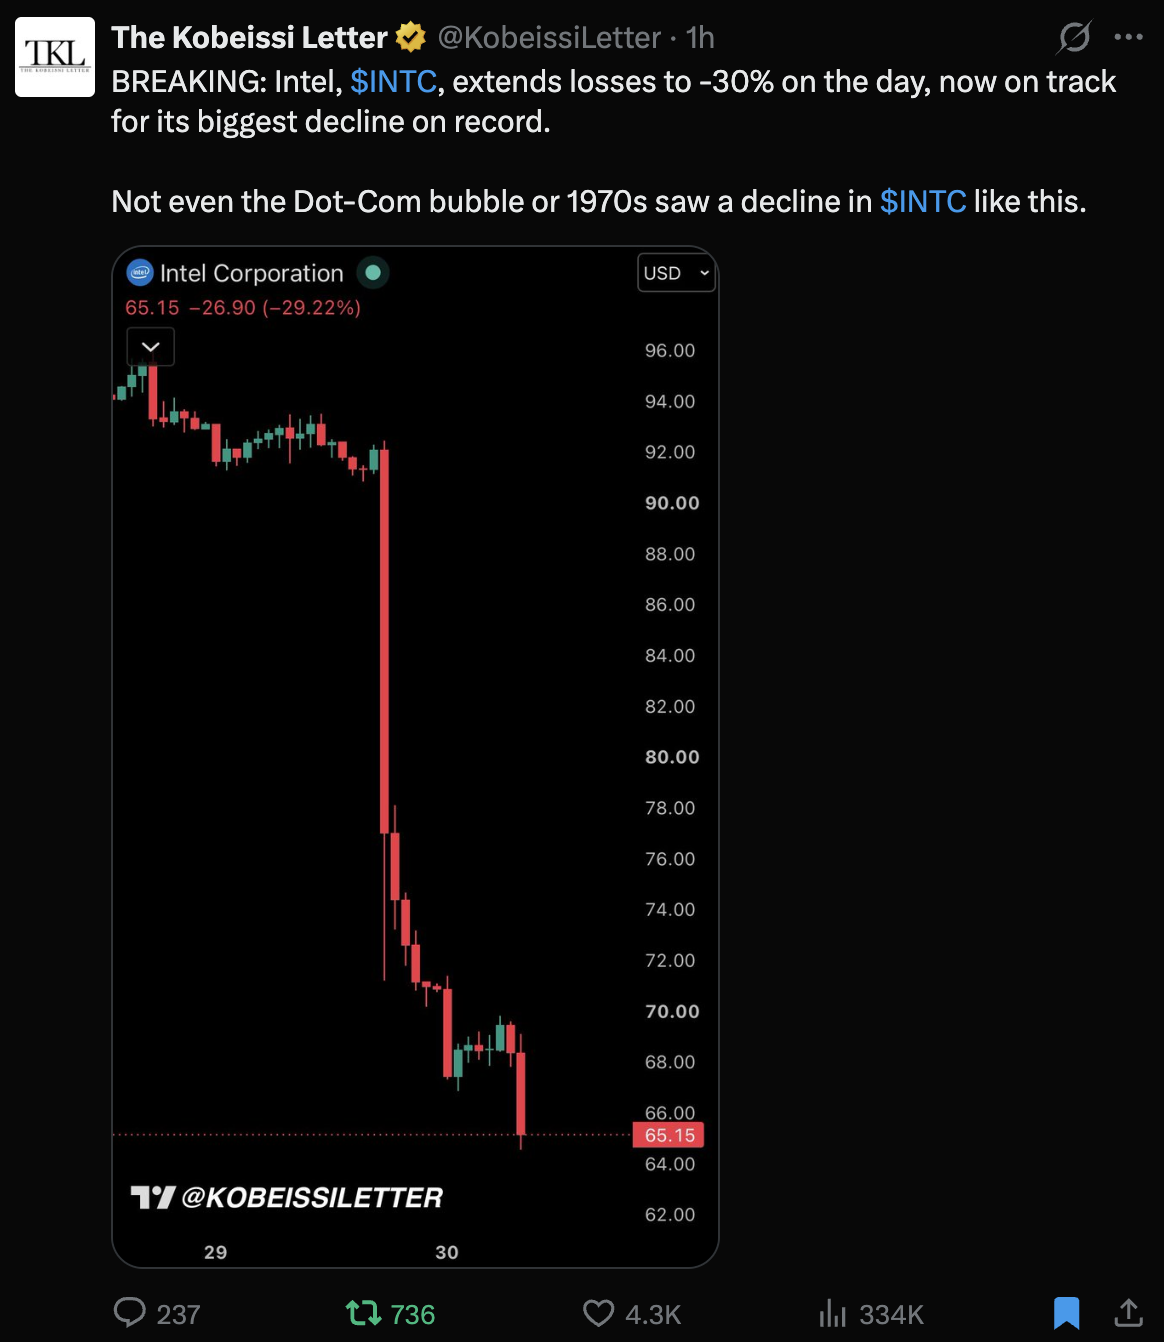
Technology stocks are under pressure. Intel plunged roughly 25% following disappointing guidance, and Amazon took a hit after reporting negative free cash flow. Investors are beginning to ask a question that has been largely ignored during the AI boom: When will all this spending translate into profits?
For the better part of three years, investors have rewarded companies for spending hundreds of billions of dollars building out AI infrastructure. Now, the market wants to see a return on that investment. It's an important shift, especially when so much of the market's gains, and so much of the economy's momentum, have been tied to a handful of technology companies.
Meanwhile, the Fed met on Wednesday and held interest rates steady. The market is still pricing in a high probability of another rate hike in December.
My friend Peter Boockvar sees it differently. He made an interesting point on X this morning. In short, if technology stocks continue to fall, the Fed may find it difficult to raise rates again. The U.S. economy, consumer confidence, and financial markets have become increasingly dependent on rising technology stock prices. A meaningful decline could change the Fed's calculus. Peter also believes that a shift away from further rate hikes could weaken the dollar, push real interest rates lower, and help gold find its footing.
I think Peter makes a good point. He may well be right about December.
But looking further ahead, I wouldn't be surprised to see the Fed Funds rate reach 5.5% next year. Washington continues to spend far more than it takes in. Deficits remain enormous, debt keeps piling up, and the Treasury must continually find buyers to finance it all. At some point, investors may demand higher yields to absorb that supply.
And higher interest rates have consequences. They raise borrowing costs for businesses, consumers, and the government itself. They pressure asset valuations, slow economic activity, and expose weaknesses that were easier to hide when money was cheap.
This brings me back to Dornbusch.
The trouble with late-cycle markets is that everything can look reasonably stable right up until it isn't. Debt builds slowly. Leverage increases. Valuations stretch. Investors grow comfortable taking more risk. And then something changes.
We don't know what that something will be, or when it will arrive, or if this week it showed up. But we can see the conditions that make markets vulnerable.
High debt. High leverage. High valuations. Extreme market concentration. And an economy increasingly dependent on a narrow group of technology companies continuing to deliver.
None of this means a crisis is inevitable or that a major market decline is now underway. Timing these things is extraordinarily difficult. But history reminds us that risks tend to build quietly, and when confidence turns, markets can move much faster than most expect. This week was the wake-up call.
Seat belts on.
Grab your coffee and find your favorite chair. There's a lot to unpack this week.
On My Radar: Pressure Points
Black October and Other Notes
The Yen Carry Trade and Key Data Charts
Trade Signals: October 30, 2026
Personal Note: Boston and Myopia Hunt Club
OMR is for informational and educational purposes only. No consideration is given to your specific investment needs, objectives, or tolerances.
Please see the Important Disclosures at the bottom of this page. Reminder: This is not a recommendation to buy or sell any security. My views may change at any time. The information is for discussion and educational purposes only.
If you like what you are reading, you can subscribe for free.

Black October and Other Notes
October has a reputation: 1929, 1987, 2008. This year it earned a nickname of its own, and it didn’t come from the stock market.
Black October. Researchers using AI tools have been finding critical flaws in PHP, the software behind roughly 70% of the world’s websites, and companies are racing to patch them. Former CISA director Chris Krebs said that about 3% of all critical vulnerabilities ever found were discovered in the past month. CrowdStrike CEO George Kurtz: “it’s only the beginning. Actually only going to get worse from here.” Large companies can afford AI-powered defenses. Smaller ones mostly can’t.
Then the vault got robbed. On Thursday afternoon, hackers linked to North Korea took about $6.4 billion from Binance. Most of it moved in roughly 20 minutes. It’s the largest crypto theft on record, about four times February 2025’s $1.5 billion Bybit hack. Binance paused withdrawals, and stablecoin issuers froze roughly $3 billion. Bitcoin fell to about $77,000, and around $1.5 billion of leveraged crypto bets were wiped out. Investigators haven’t tied the Binance hack to the PHP flaws. The lesson is the same, though: when the plumbing breaks, leverage gets exposed.
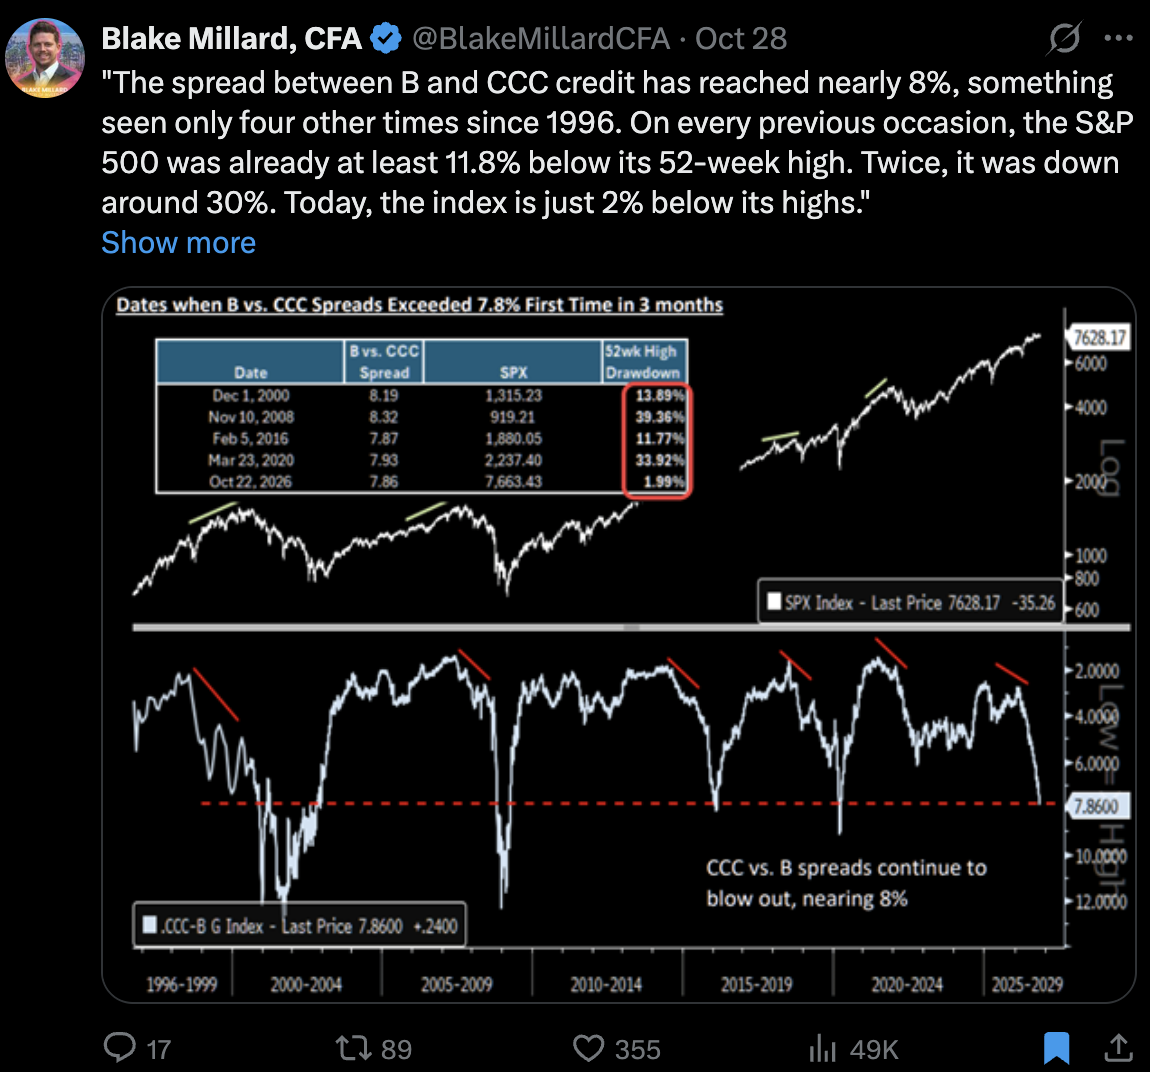
The cracks show up in credit first. On Thursday, the S&P 500 slipped only 0.3%. The Nasdaq fell 1.4%, while the equal-weight S&P rose 1.2%. Money is rotating, not running. The bond market is telling a less comfortable story, though. Overall high-yield spreads are still tight, around 314 basis points. At the riskiest end of the market, it’s a different picture. Blake Millard, CFA, shared this:
“The spread between B and CCC credit has reached nearly 8%, something seen only four other times since 1996. On every previous occasion, the S&P 500 was already at least 11.8% below its 52-week high. Twice, it was down around 30%. Today, the index is just 2% below its highs.”
Chart: Blake Millard, CFA – B vs. CCC spreads and the S&P 500
Source: @BlakeMillardCFA
In simple English, lenders are demanding much more in return for lending to the weakest companies. The last four times this happened, in 2000, 2008, 2016 and 2020, the stock market was already well into a decline. This time the stock market hasn’t reacted. Either credit is wrong, or stocks are. Historically, I’ve learned to give the edge to credit.
Keep your eye on margin debt. In On My Radar: Rising Tide, I flagged record margin debt of $1.42 trillion. FINRA’s September figure is $1.48 trillion, up 31% from a year ago and about 4.6% of GDP, above both the 2000 and 2021 peaks. Here’s how it works. Investors borrow against their stocks. When prices fall far enough, the broker asks for more cash, and if it isn’t there, the broker sells your stock. That selling pushes prices lower and triggers the next round of margin calls. Bank of America’s Paul Ciana notes that when borrowing growth slows from extreme levels, as it is now, it has often come before market peaks. Weak credit and heavy leverage together are the combination to watch.
The Fed: hawkish words but easy money. The Fed held at 3.75%–4% on a 10–2 vote, with Lisa Cook and Beth Hammack dissenting in favor of a hike. Chairman Warsh said, “Inflation is too high,” and that “quashing inflation is not about some fixed individual date on a calendar.” Stephanie Pomboy summed up the frustration with the balance sheet:
“FINALLY! A reporter (from Korea!!) finally asks Warsh the obvious question: why is the Fed doing QE to the tune of $40b a month if you said QE should only be used in emergencies?? Answer: waiting for the task force report. 😂😂 And gold is DOWN???”
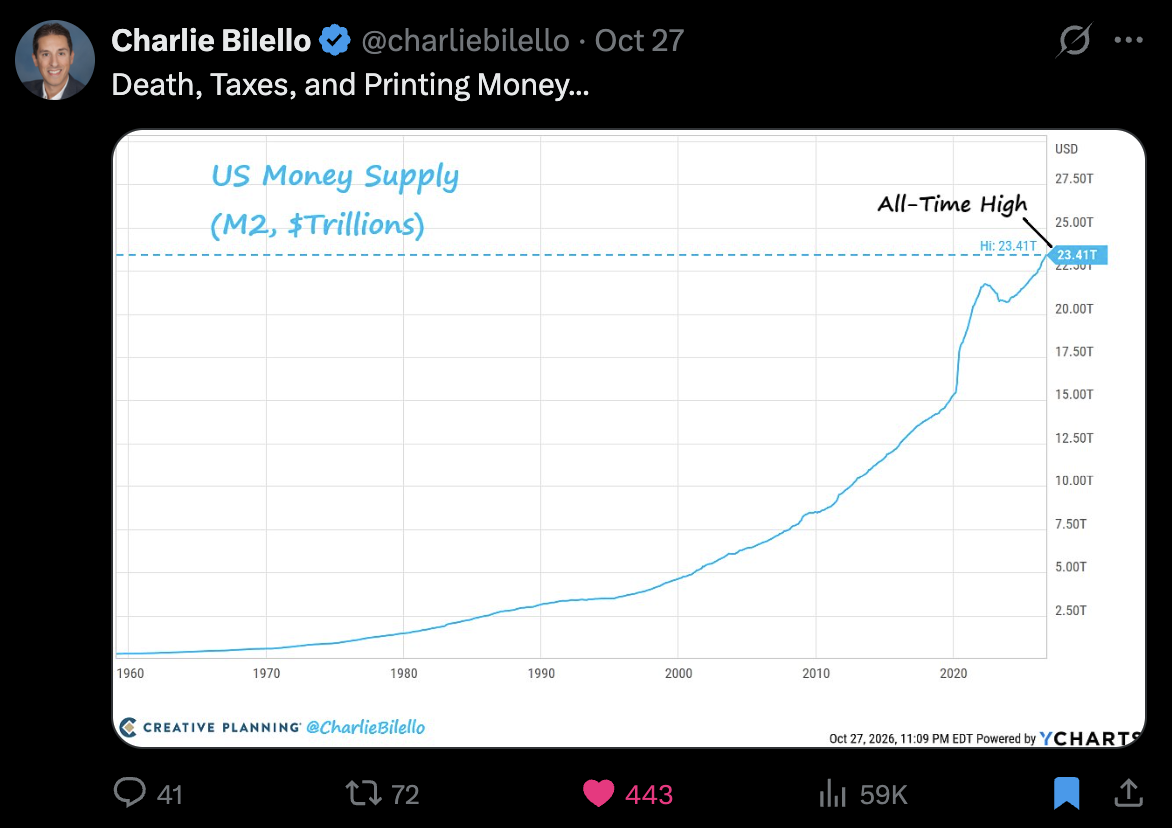
Warsh’s actual answer was that the balance sheet “is solely within the four walls of the Balance Sheet Task Force,” with recommendations due early next year. Meanwhile, the money keeps coming. Charlie Bilello titled his chart this week “Death, Taxes, and Printing Money.” M2, the broadest everyday measure of the money supply, just hit an all-time high of $23.4 trillion.
It’s the printing money part that causes inflation.
Chart: Charlie Bilello – US Money Supply (M2), All-Time High
Source: @charliebilello
Liquidity is still rising, and asset prices have been riding the wave. The question is what happens when tighter credit and margin calls collide with a Fed that says it’s hawkish but keeps adding money. All roads seem to be leading to rising inflation. We seem to be near an inflection point or just past it.
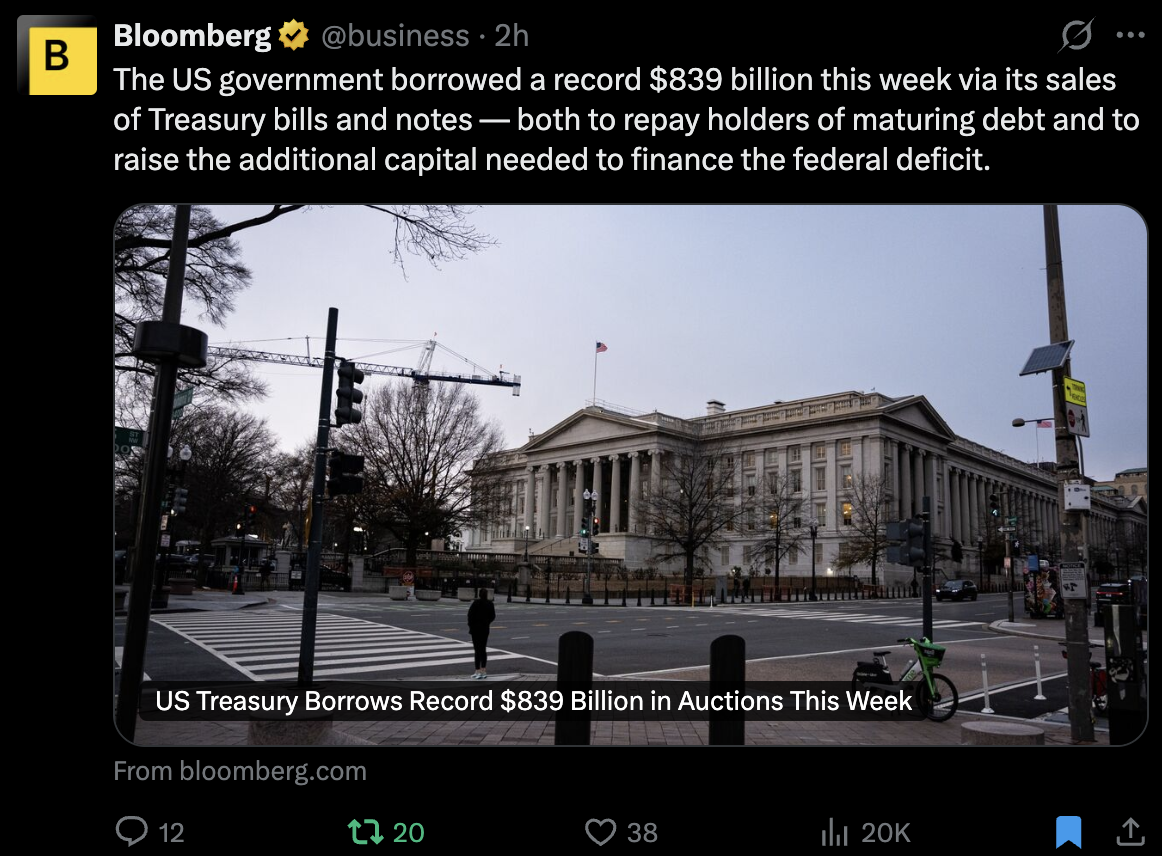
Source: @business, Bloomberg
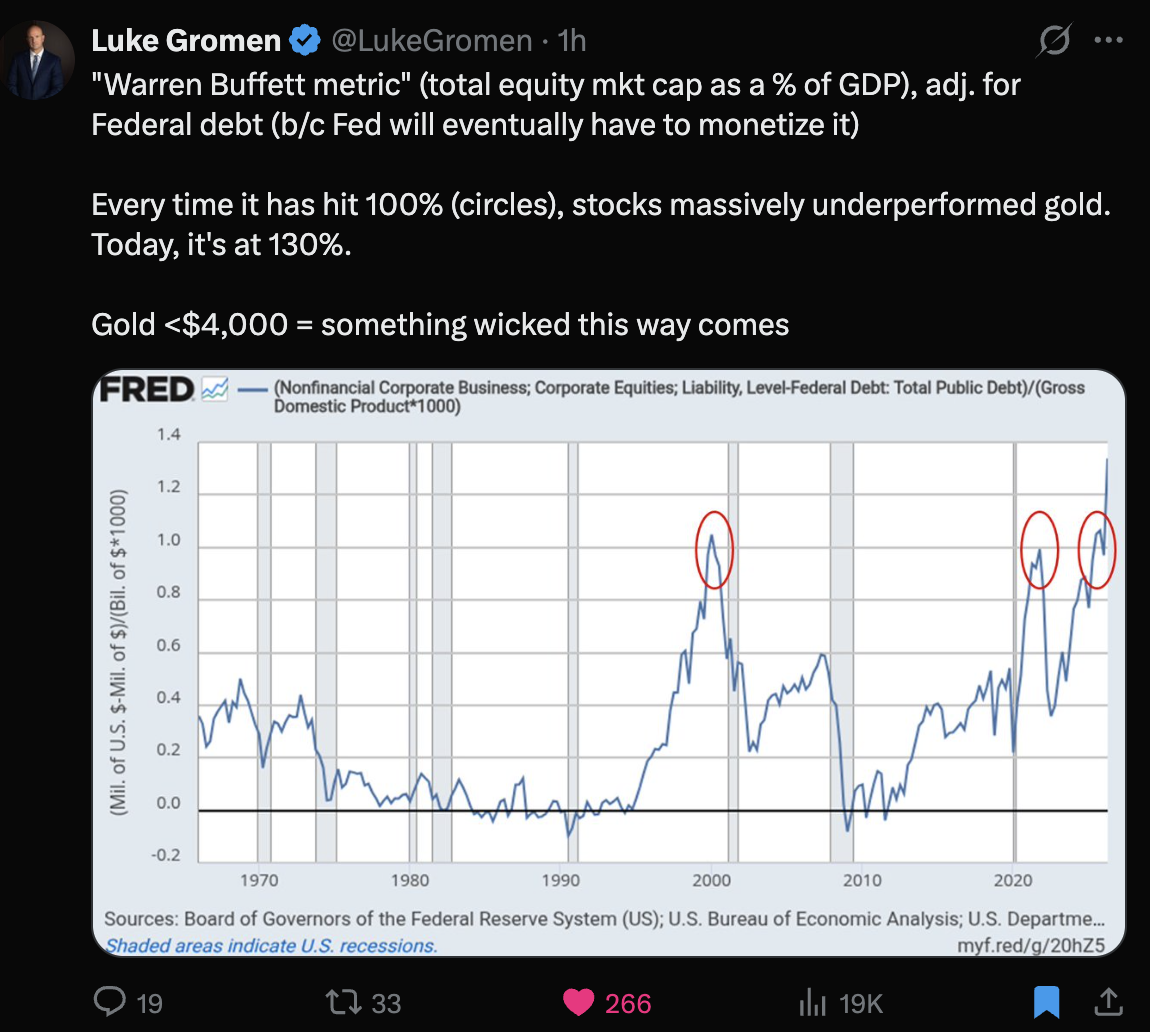
Gold. With the money supply at a record and stocks at stretched valuations, why is gold below $4,000? I found this next chart, from Luke Gromen via X, insightful. He takes the “Warren Buffett metric” (total stock market value as a percentage of GDP, which I post fairly frequently) and adjusts it for federal debt, on the view that the Fed will eventually have to monetize it. Every time it hit 100%, stocks went on to underperform gold. Today it sits at 130%. His summary: “Gold < $4,000 = something wicked this way comes.”
Chart: Luke Gromen – “Warren Buffett metric” adjusted for federal debt
Source: @lukegromen
I see that as a warning about stocks, not a knock on gold. If tech stumbles and the Fed backs off a December hike, real rates fall (as inflation rises), and gold’s correction is likely to end. Either way, I like gold’s role in a portfolio.
Tuesday’s vote. Prediction markets give Democrats about a 93% chance of winning the House and about 70% for the Senate. Gridlock tends to calm markets. But none of those past midterms started with margin debt at 4.6% of GDP, a CAPE near 40, junk-credit spreads near 8%, and a 10-year Treasury at 5%. The odds of stocks rallying into year-end are high. But history is a guide, not a guarantee. So will see.
The seasonal tailwind ahead is a positive. So are the risks in the leveraged equity and credit markets (see the charts in the Yen Carry Trade section).
What we are seeing is what I’ve been writing about for months. If margin calls are triggered, brokerage firms won’t ask for permission. I admit I am a little concerned about Monday.
Bottom line: Keep hedges in place and start bracing for opportunity. My guess is it is too early; a move in the S&P 500 to 5,000 is a good target. The best opportunities present themselves in panic. It will feel bad; it will be good.
Source: @kobeissiletter
One last note on the geopolitical front. I’m hearing from my geopolitical friends that the U.S. is likely to launch another major attack on Iran; Russia and Ukraine are blowing up critical energy infrastructure that has taken years to build; the Houthis are attacking Saudi Arabia energy and public targets. Energy prices lower? The world is a mess. Pray for peace and factor energy into your inflation calculus.
Opinions are subject to change. Not a recommendation to buy or sell any security. Provided for discussion and educational purposes only. Past performance is not indicative of future results.
Tax Mitigation - Strategies for High-Net-Worth Investors
In CMG’s newly updated white paper, Tax Mitigation Strategies for High-Net-Worth Investors, we explore how tax incentives designed to encourage investment in areas such as energy, small businesses, real estate, opportunity zones, equipment, and charitable giving can play a role in a broader wealth management strategy.
You can find the paper here.

The Yen Carry Trade and Key Data Charts
The charts are updated. And I’ll keep doing so each week as this section is how I’m monitoring a potential unwind in the Yen Carry Trade. It’s about leverage, and I believe it is always leverage that blows things up.
In summary: Risk is high.
Interest rates are the cost of money. Everything macro is tied to the cost of money. The match that lights the fuse to the global leverage problem is rising rates. We should all be on high alert.
Tracking the potential unwinding of the yen carry trade, here is the bottom line:
Across each of the key risk assets, we are seeing red flags. Signs risk is unwinding. Risk of a disruptive event is high.
Since we are at a critical point in terms of rising yields at a time of extreme system-wide leverage (the Yen Carry Trade, Government Debt, global developed market debt, and US margin debt), I’m going to update the following charts each week going forward as we may be near a critical inflection point.
When viewing the MACD signals, keep the following in mind. For example, the Monthly MACD signals the dominant trend over the next 8 to 20 months from the signal date. Note: nothing is perfect in investing. The idea here is to understand what price activity (actual buyers and sellers) indicates.
The Daily (short-term) MACD Trend: ~ 8 days to 20 days
The Weekly (intermediate-term) MACD Trend: ~ 8 weeks to 20 weeks
The Monthly (long-term) MACD Trend: ~ 8 months to 20 months
Updated charts with brief notes follow:
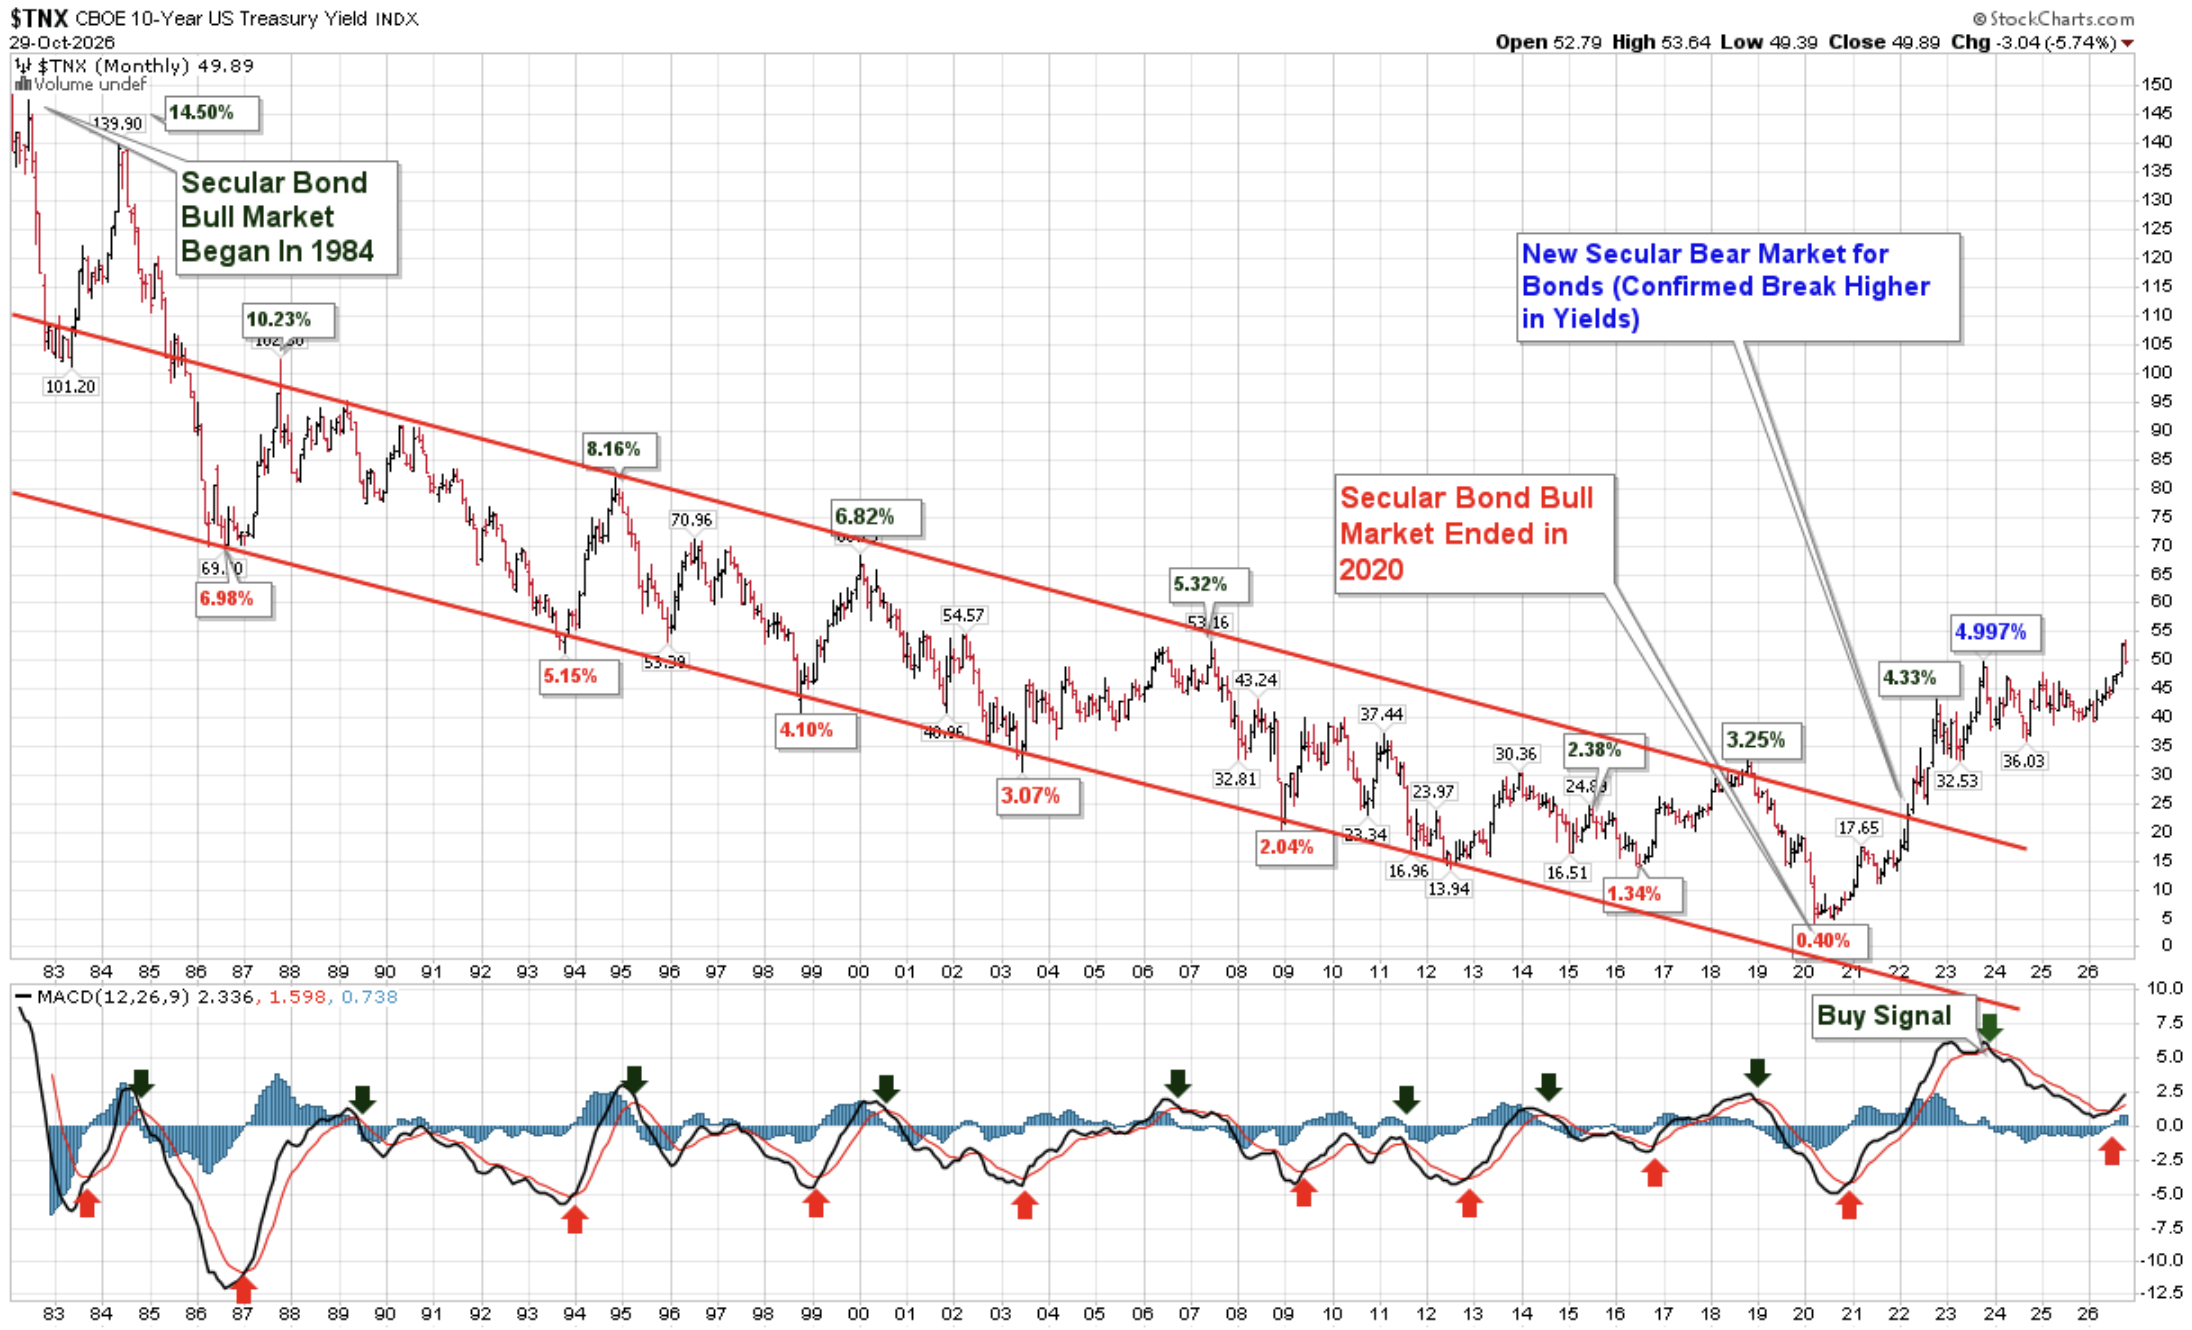
The 10-year Treasury - Monthly MACD
After peaking at 5.36% last week, the yield has remained at 5%. It is at 4.99% after yesterday’s close, the same level it closed at last Thursday.
Source: StockCharts.com, CMG annotations (arrows)
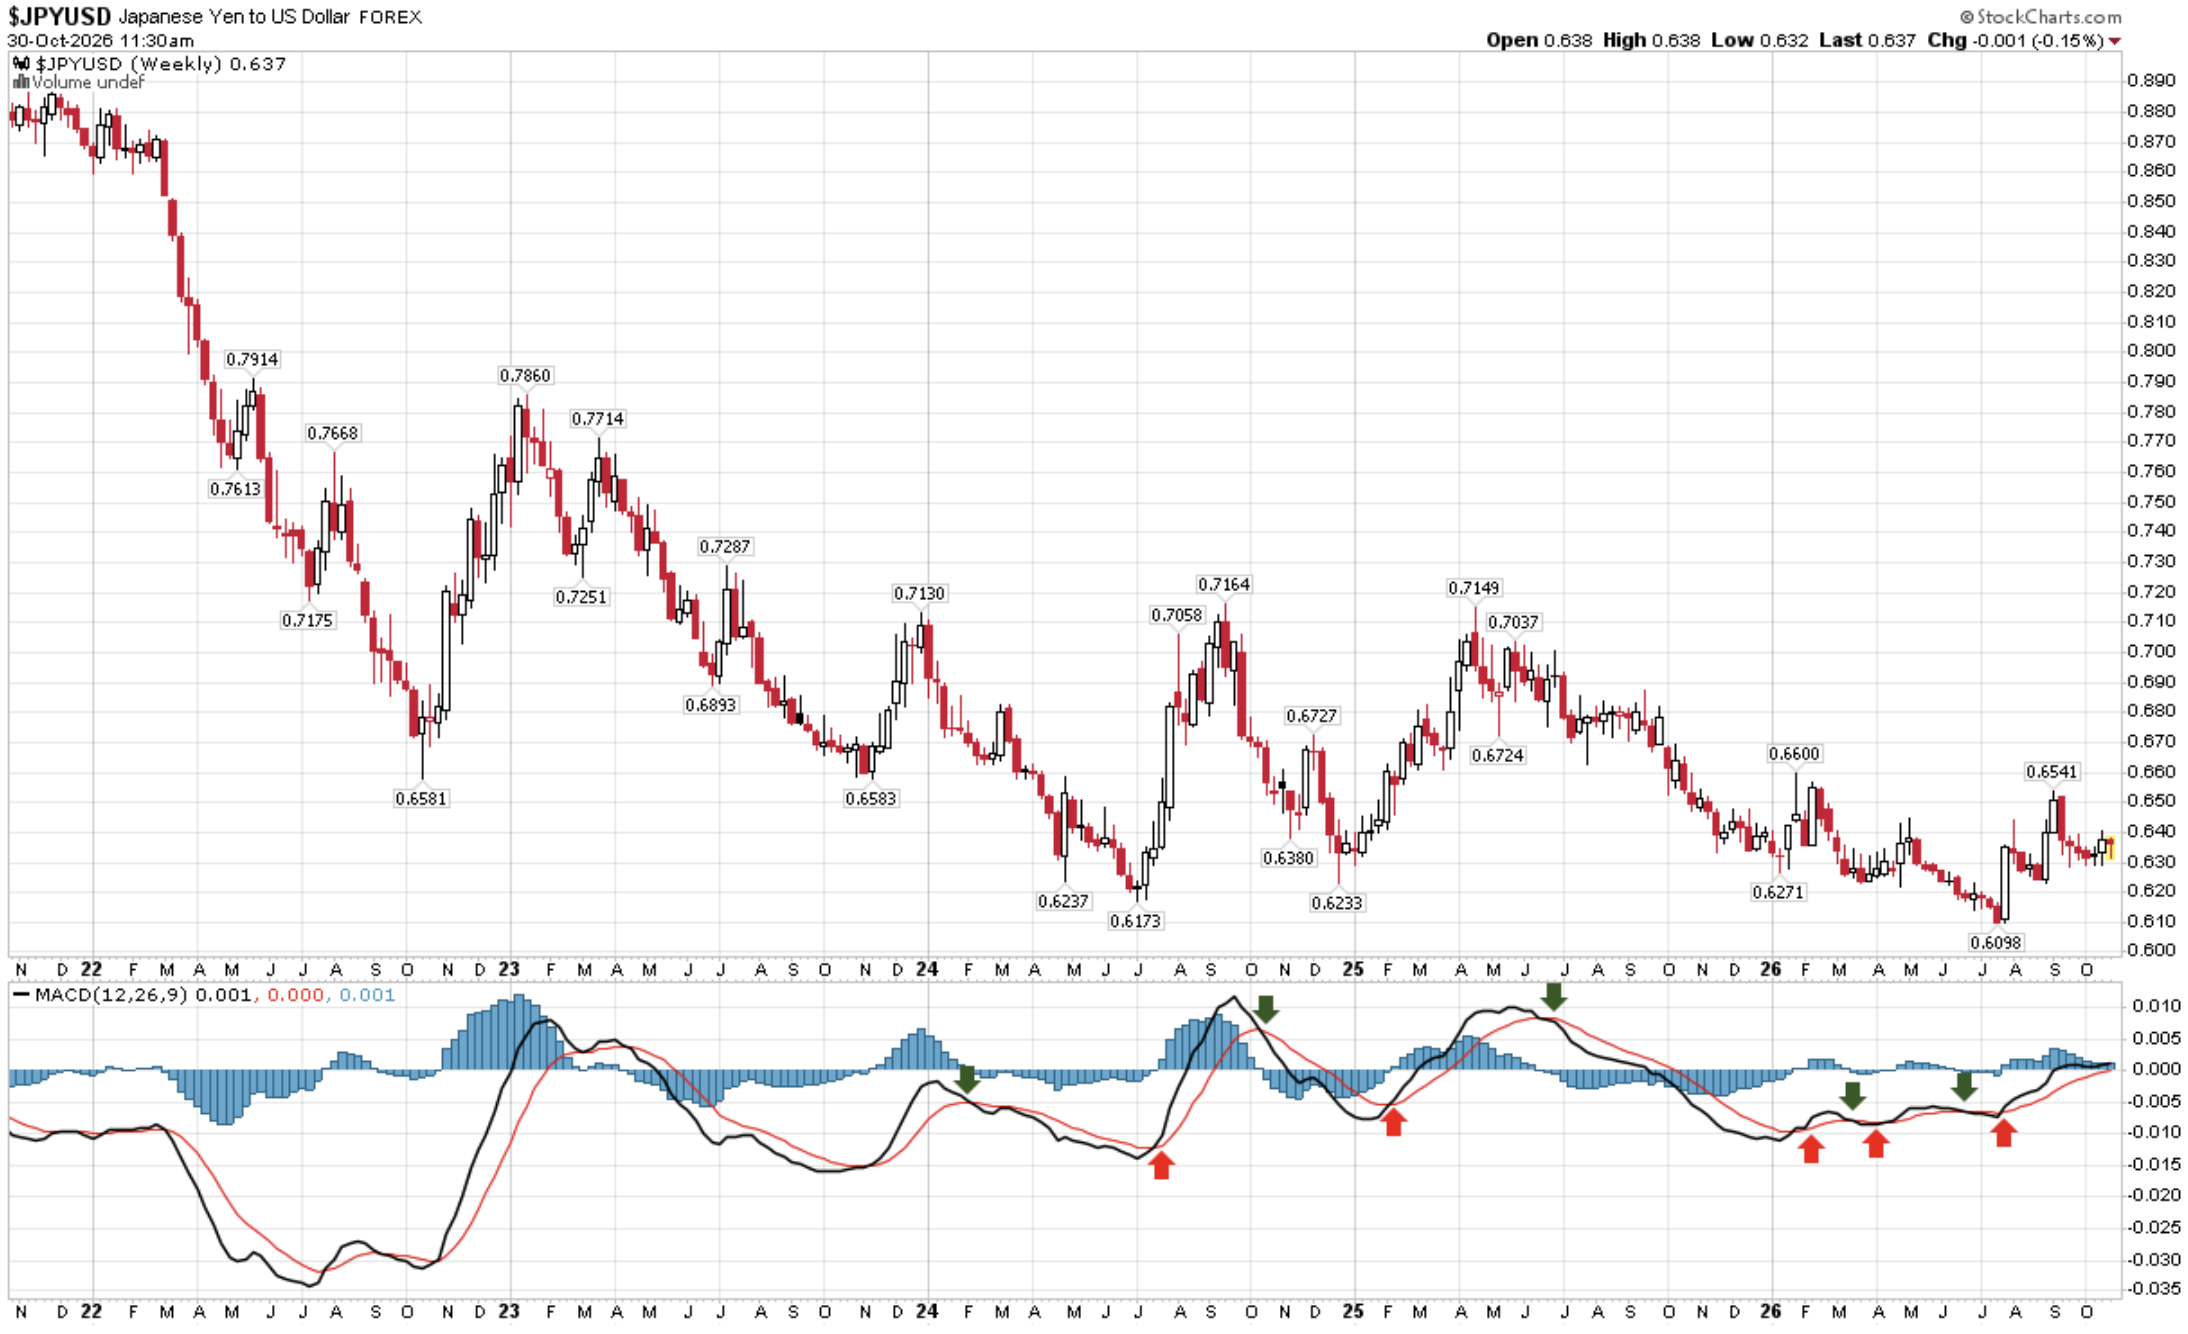
The Yen:
The Bank of Japan needs the yen to be higher to fight off inflation.
They would prefer not to raise their interest rates, as this would increase the interest costs they pay on their debt and risk unwinding the leveraged yen carry trade (borrowing at near 0% and investing in higher-yielding assets globally, including the US).
When the borrow-for-free spread goes away, the leverage likely unwinds.
The current trend, as measured by the weekly MACD, points to a higher yen. A rising yen is bearish for global liquidity. A declining yen is bullish.
Bottom line: The Weekly MACD trend indicator is signaling a rising yen, and the rising price is bearish for global liquidity. We are watching for a sharp spike higher, which is not yet evident.
Source: StockCharts.com, CMG annotations
The Dollar:
The Weekly MACD trend signal is pointing to a higher dollar.
Remember, we are looking at the yen vs. the dollar. So, a rising dollar relative to the yen is bullish for global liquidity.
Bottom line: There is currently a low risk of the unwinding of the yen carry trade.
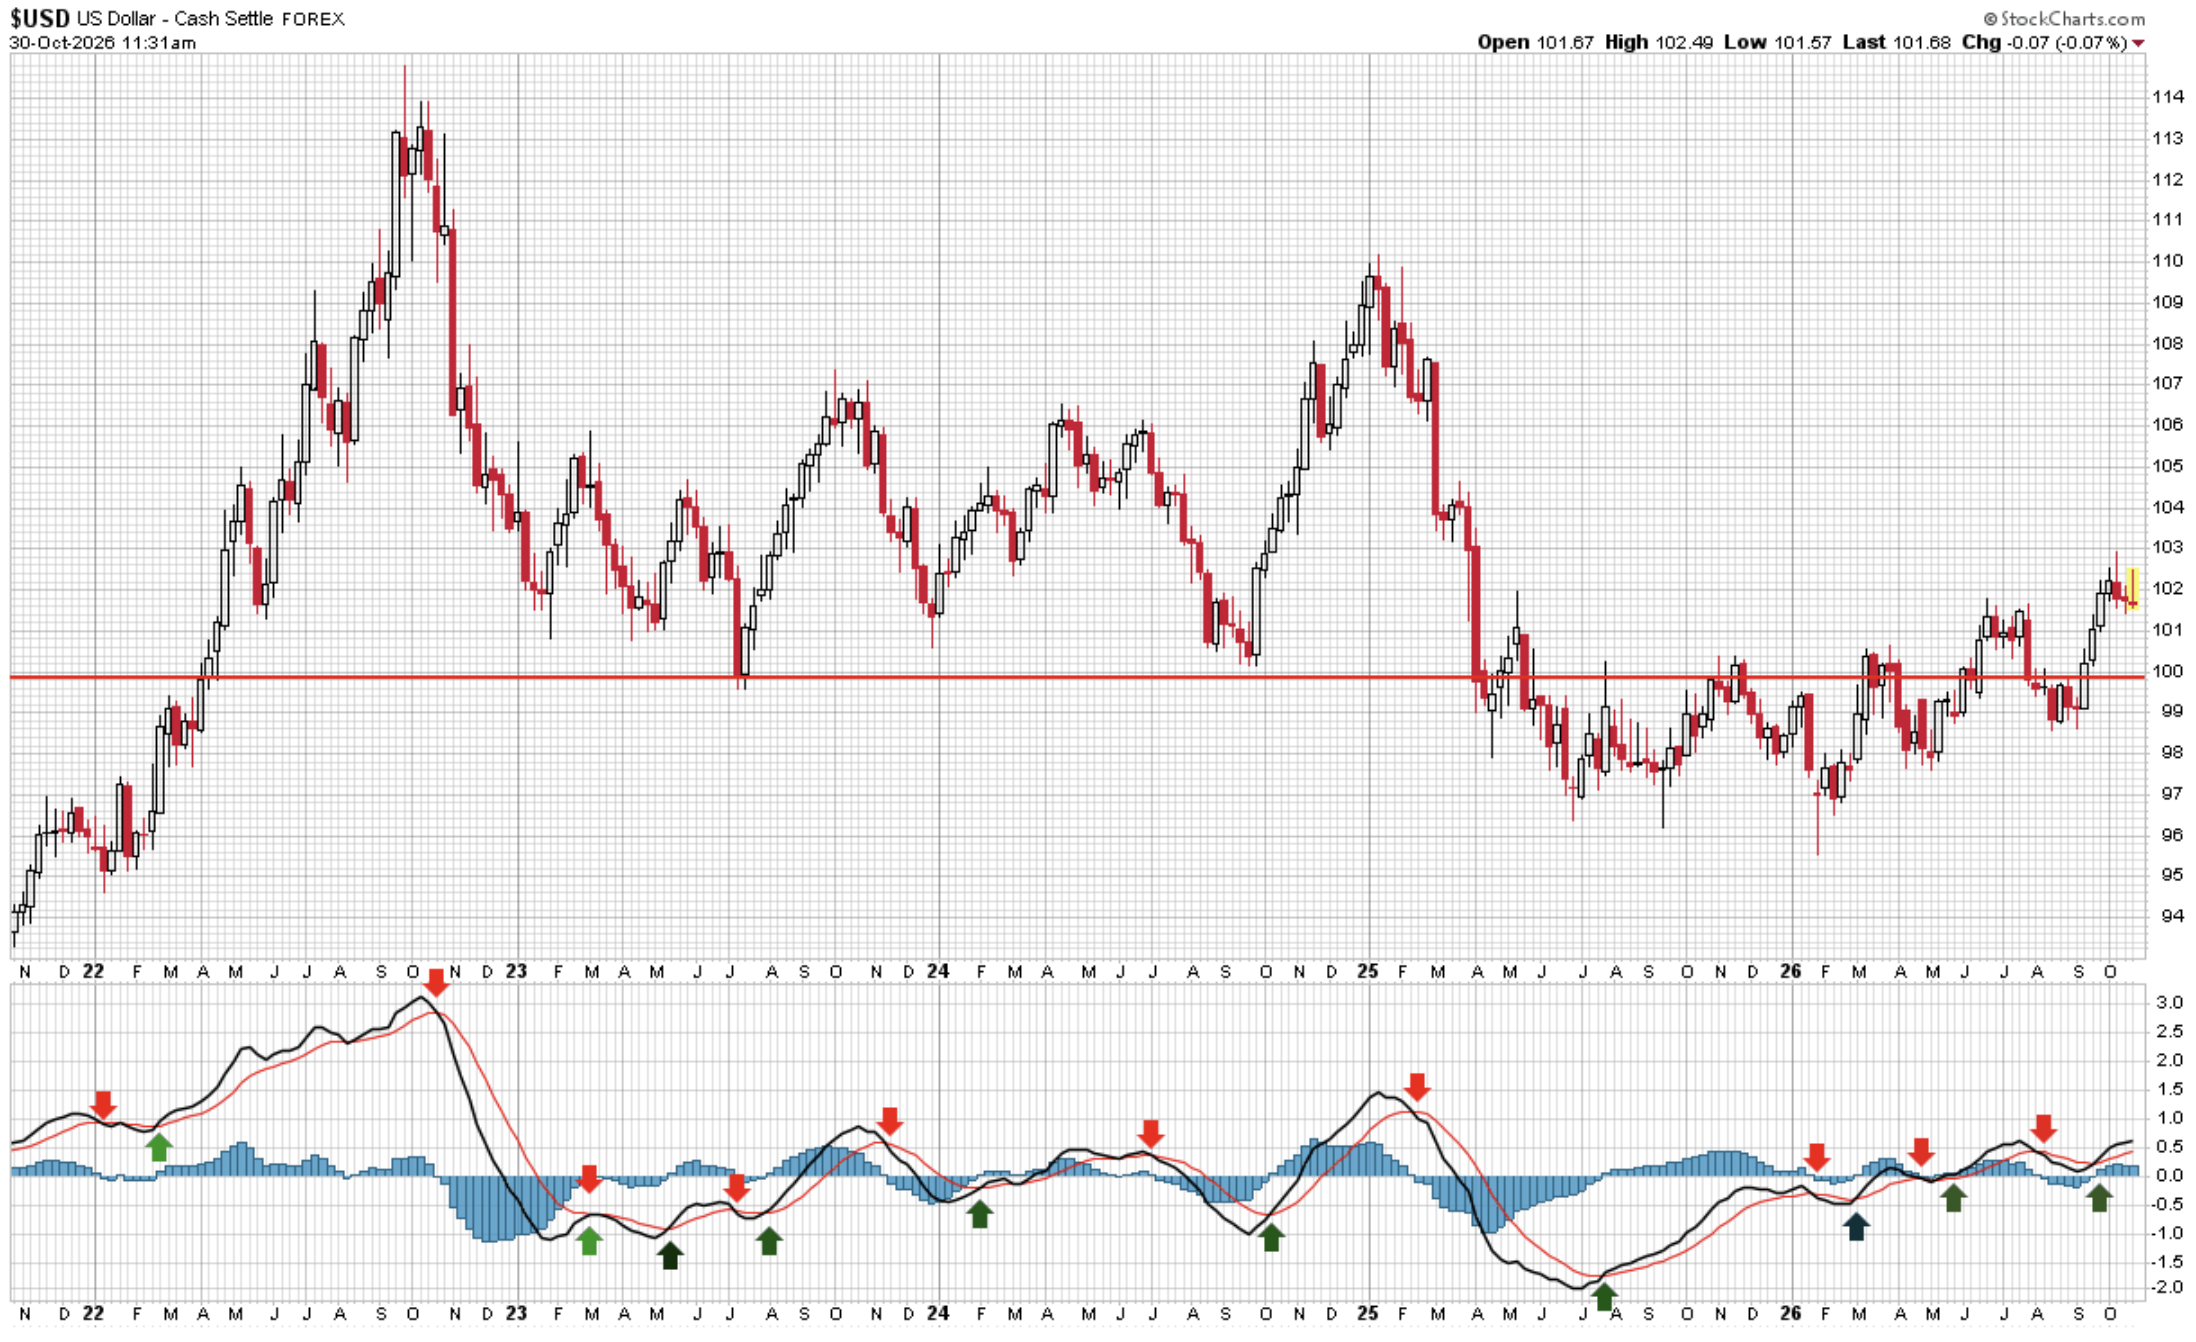
Source: StockCharts.com, CMG Investment Research
High-yield bonds - Monthly MACD Bear Trend Signal
Next is the “canary in the coal mine” indicator I’ve been using since 1992.
The long-term monthly MACD price trend remains bearish (the monthly MACD is the dominant long-term trend; the weekly is the intermediate-term trend).
The HY market tends to lead the equity market, which in turn leads the economy.
Bottom line: The red down arrow (bottom right) is a major warning. Risk is high.
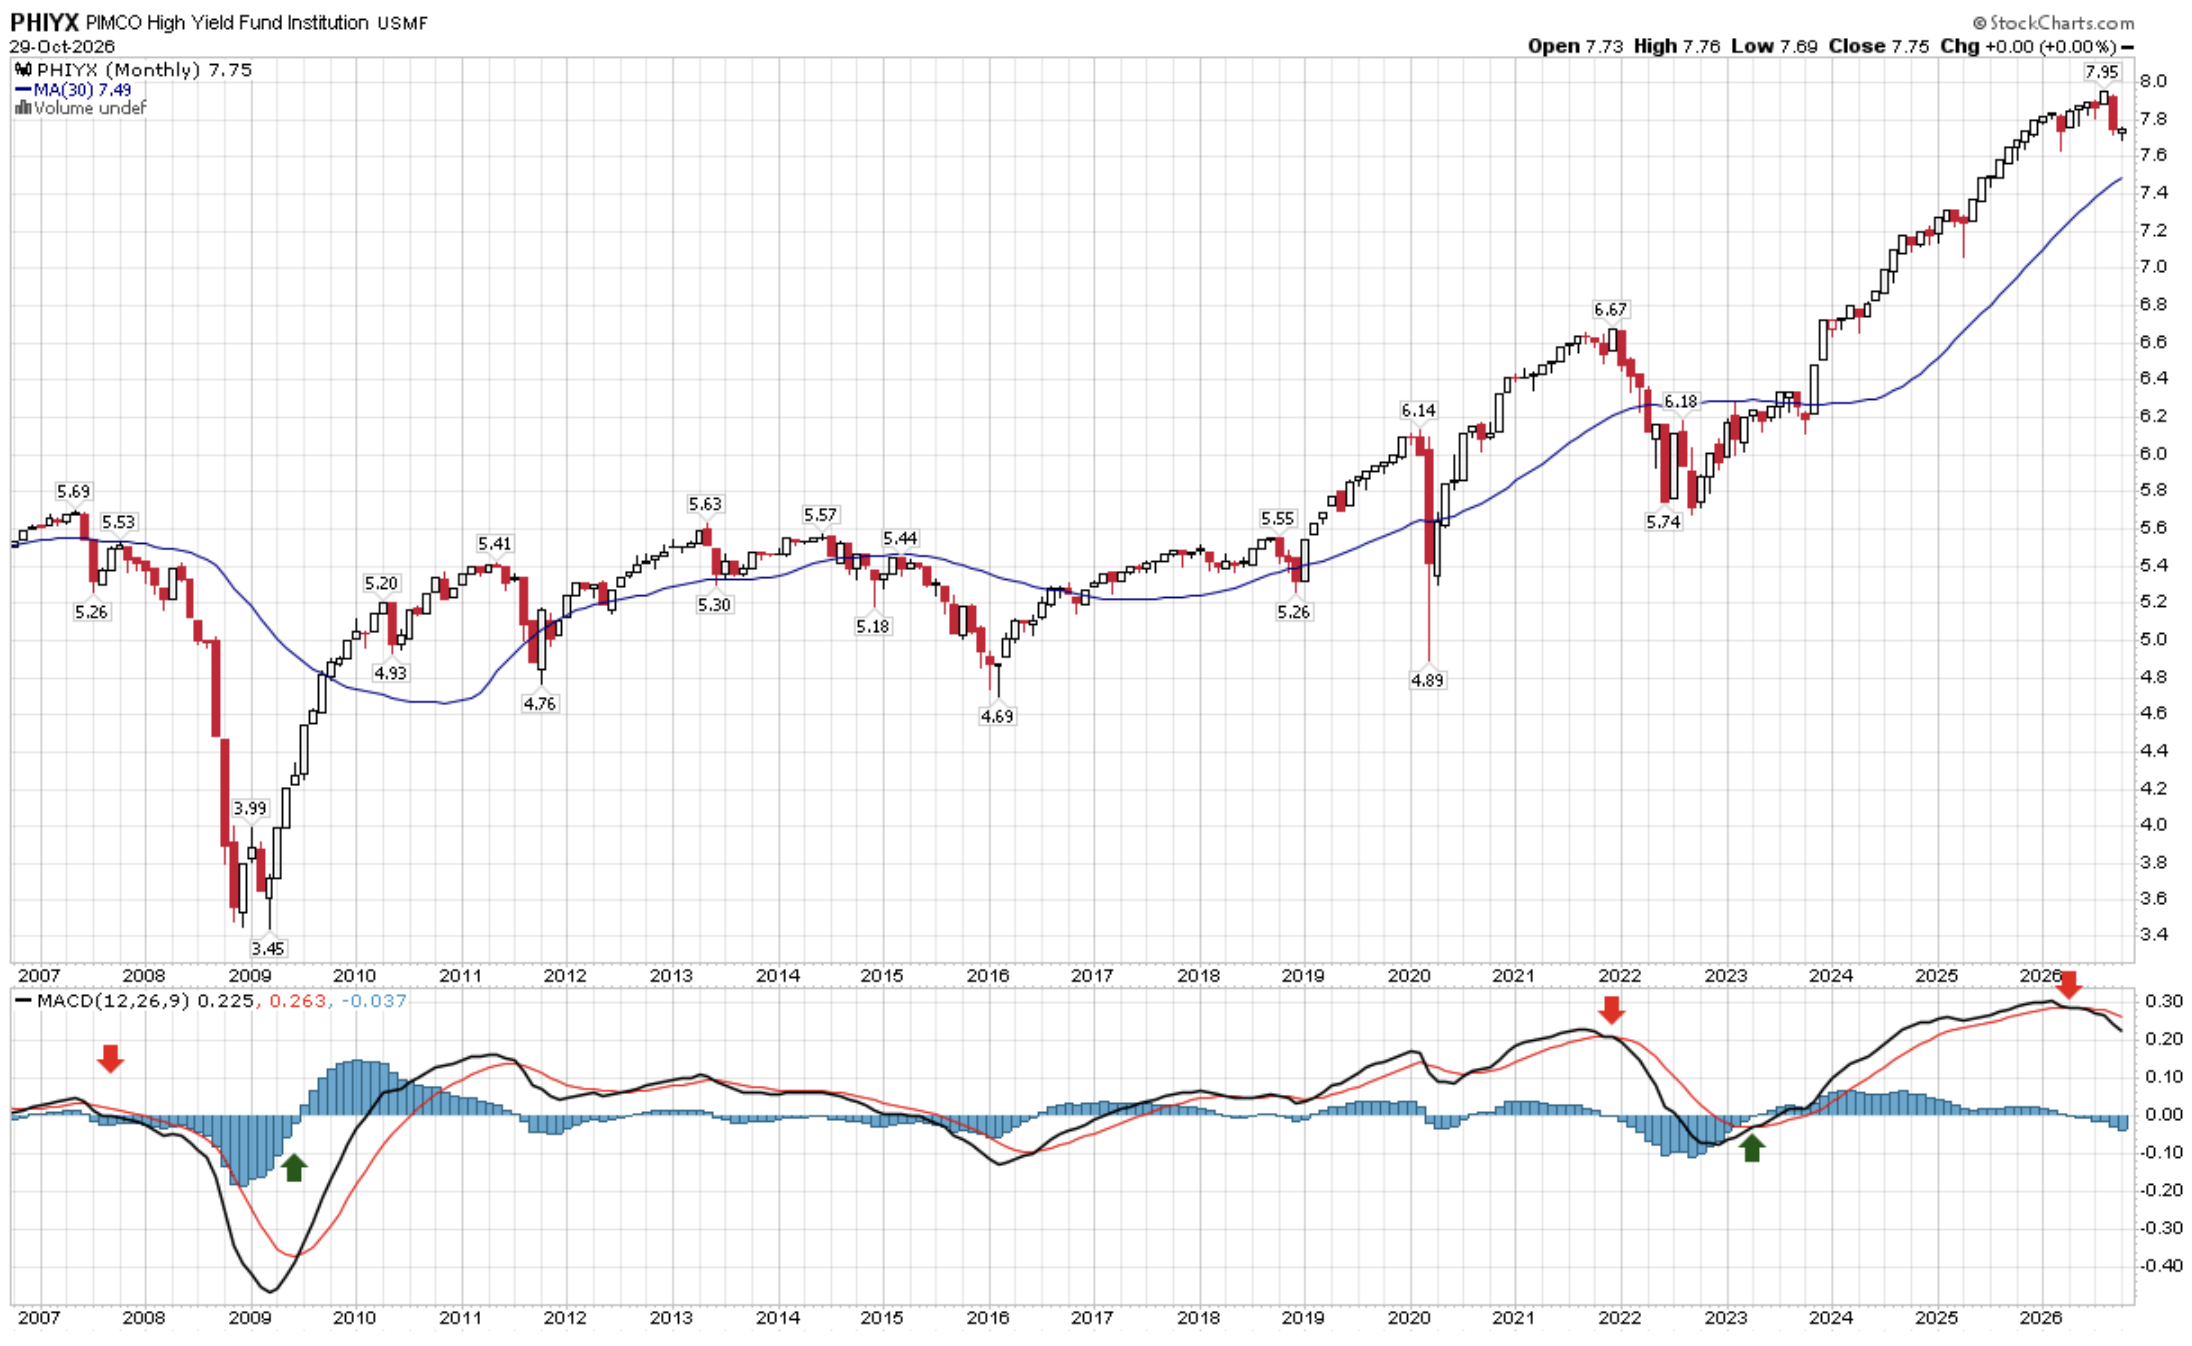
Source: StockCharts.com, CMG arrows
High-yield bond yields are higher. When prices decline, yields rise. Rising HY yields are a concern.
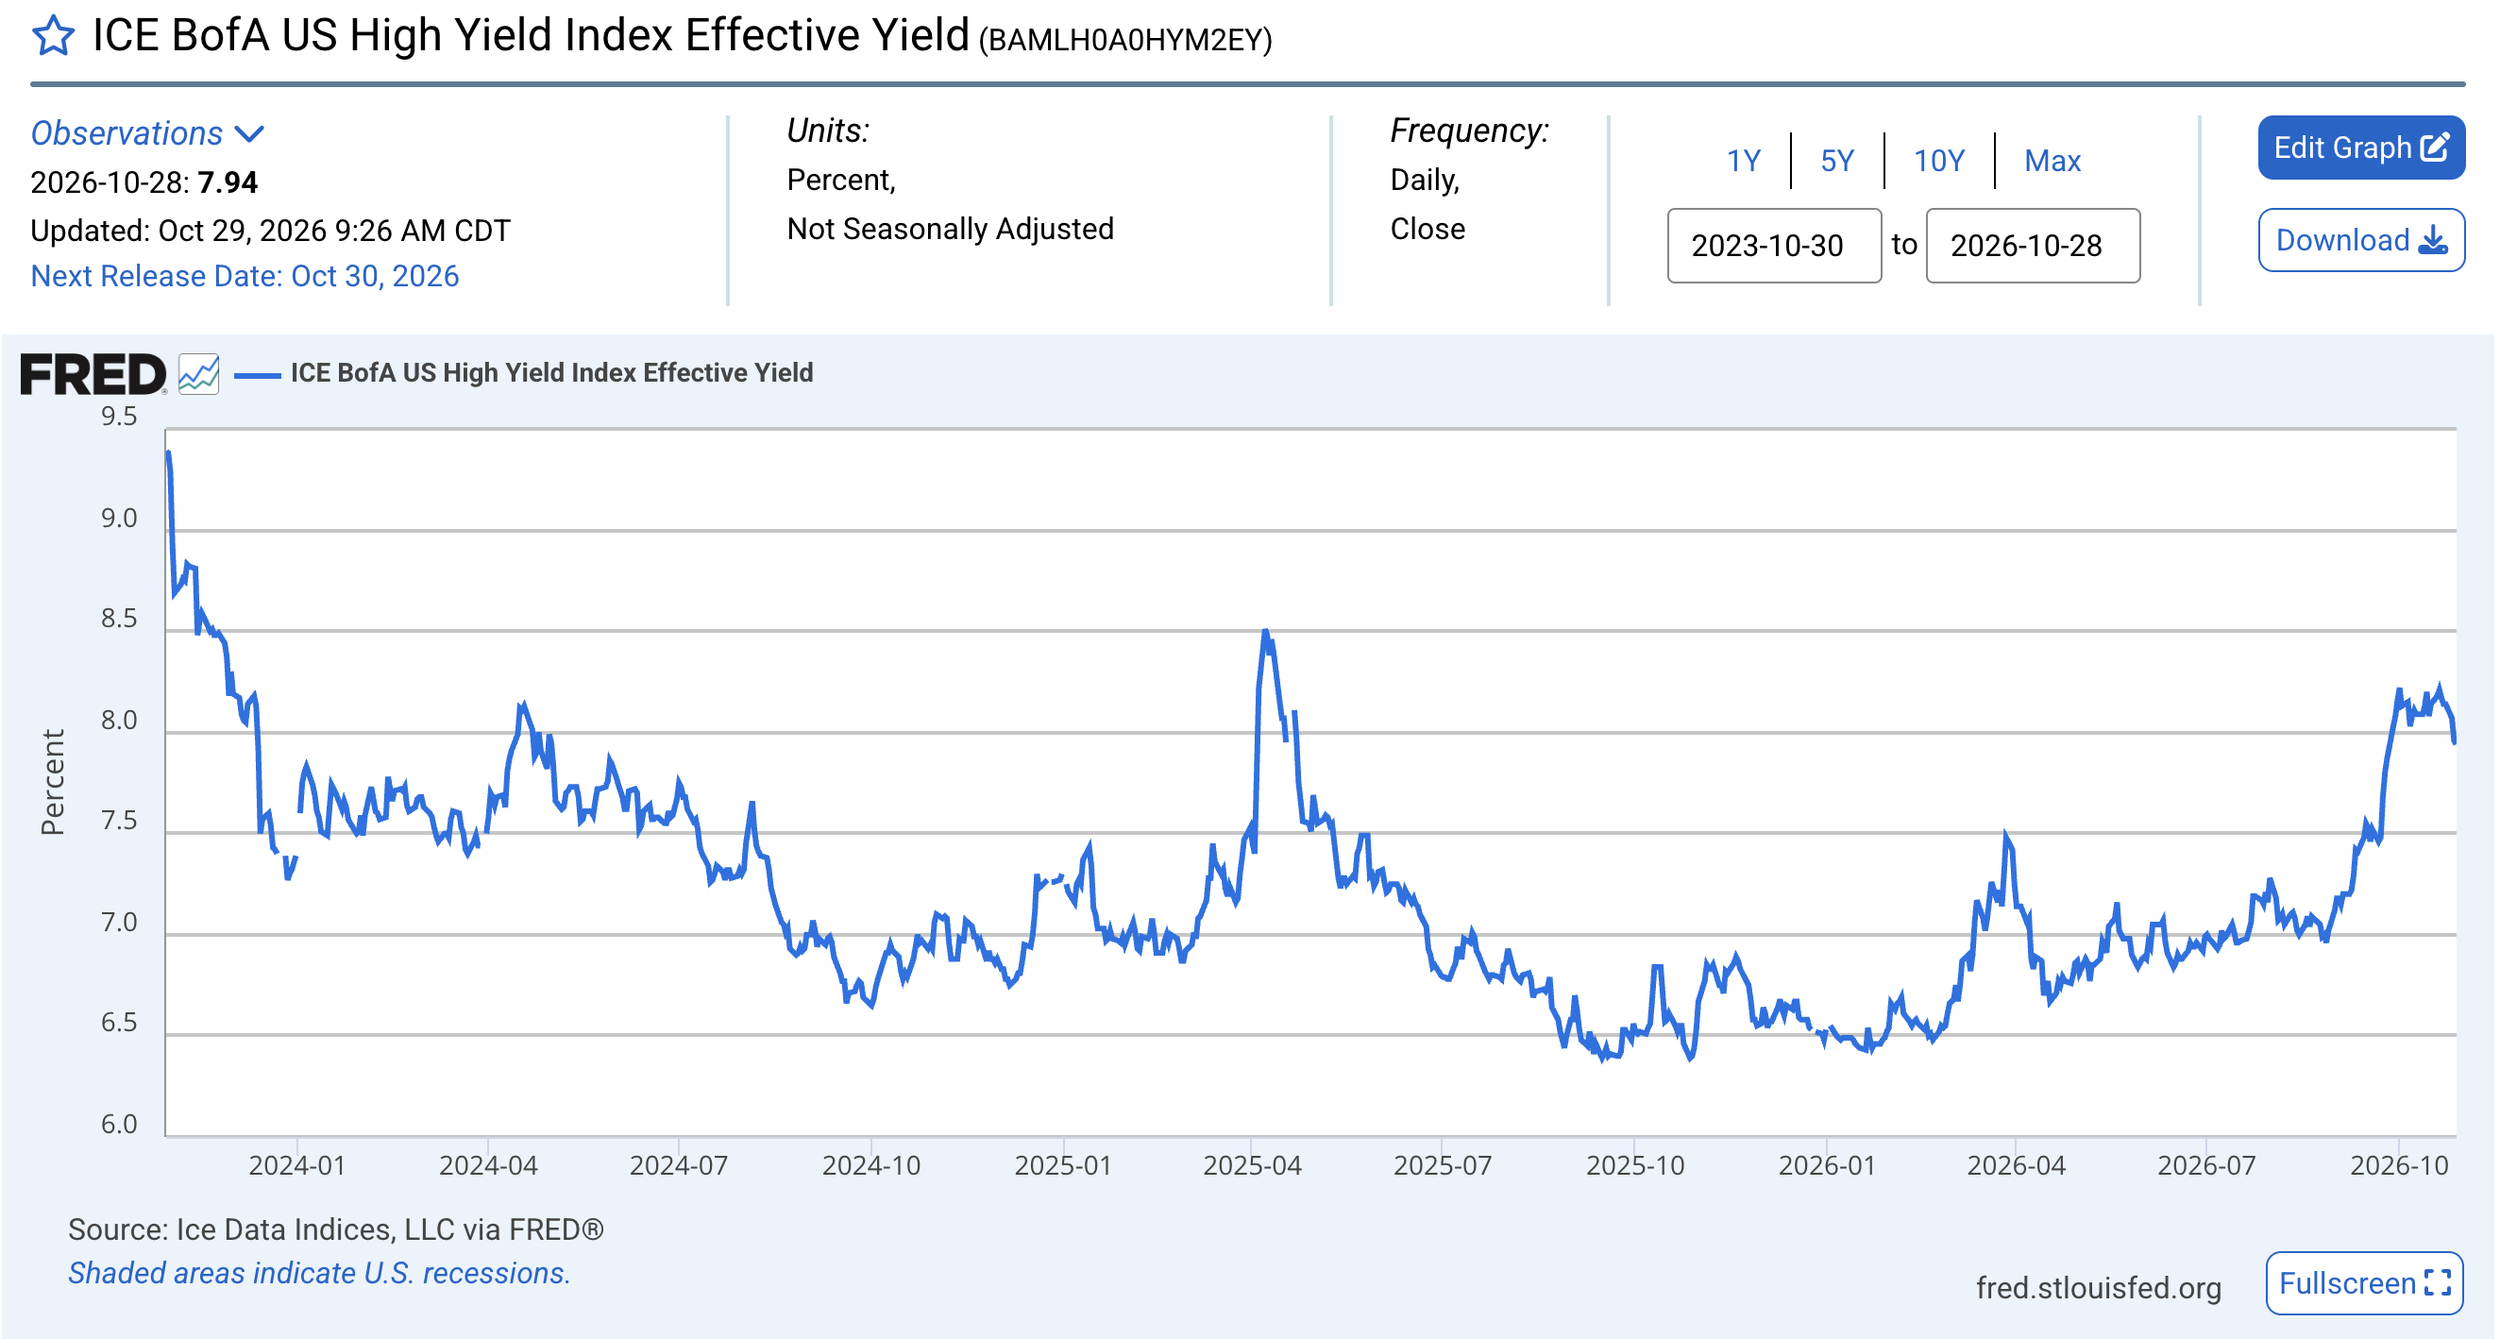
Source: FRED
And here is what is happening in the riskiest junk-bond category, CCC: Yield spreads are above 13%. You would naturally see risk rising first in the weakest companies. This is a significant warning signal.
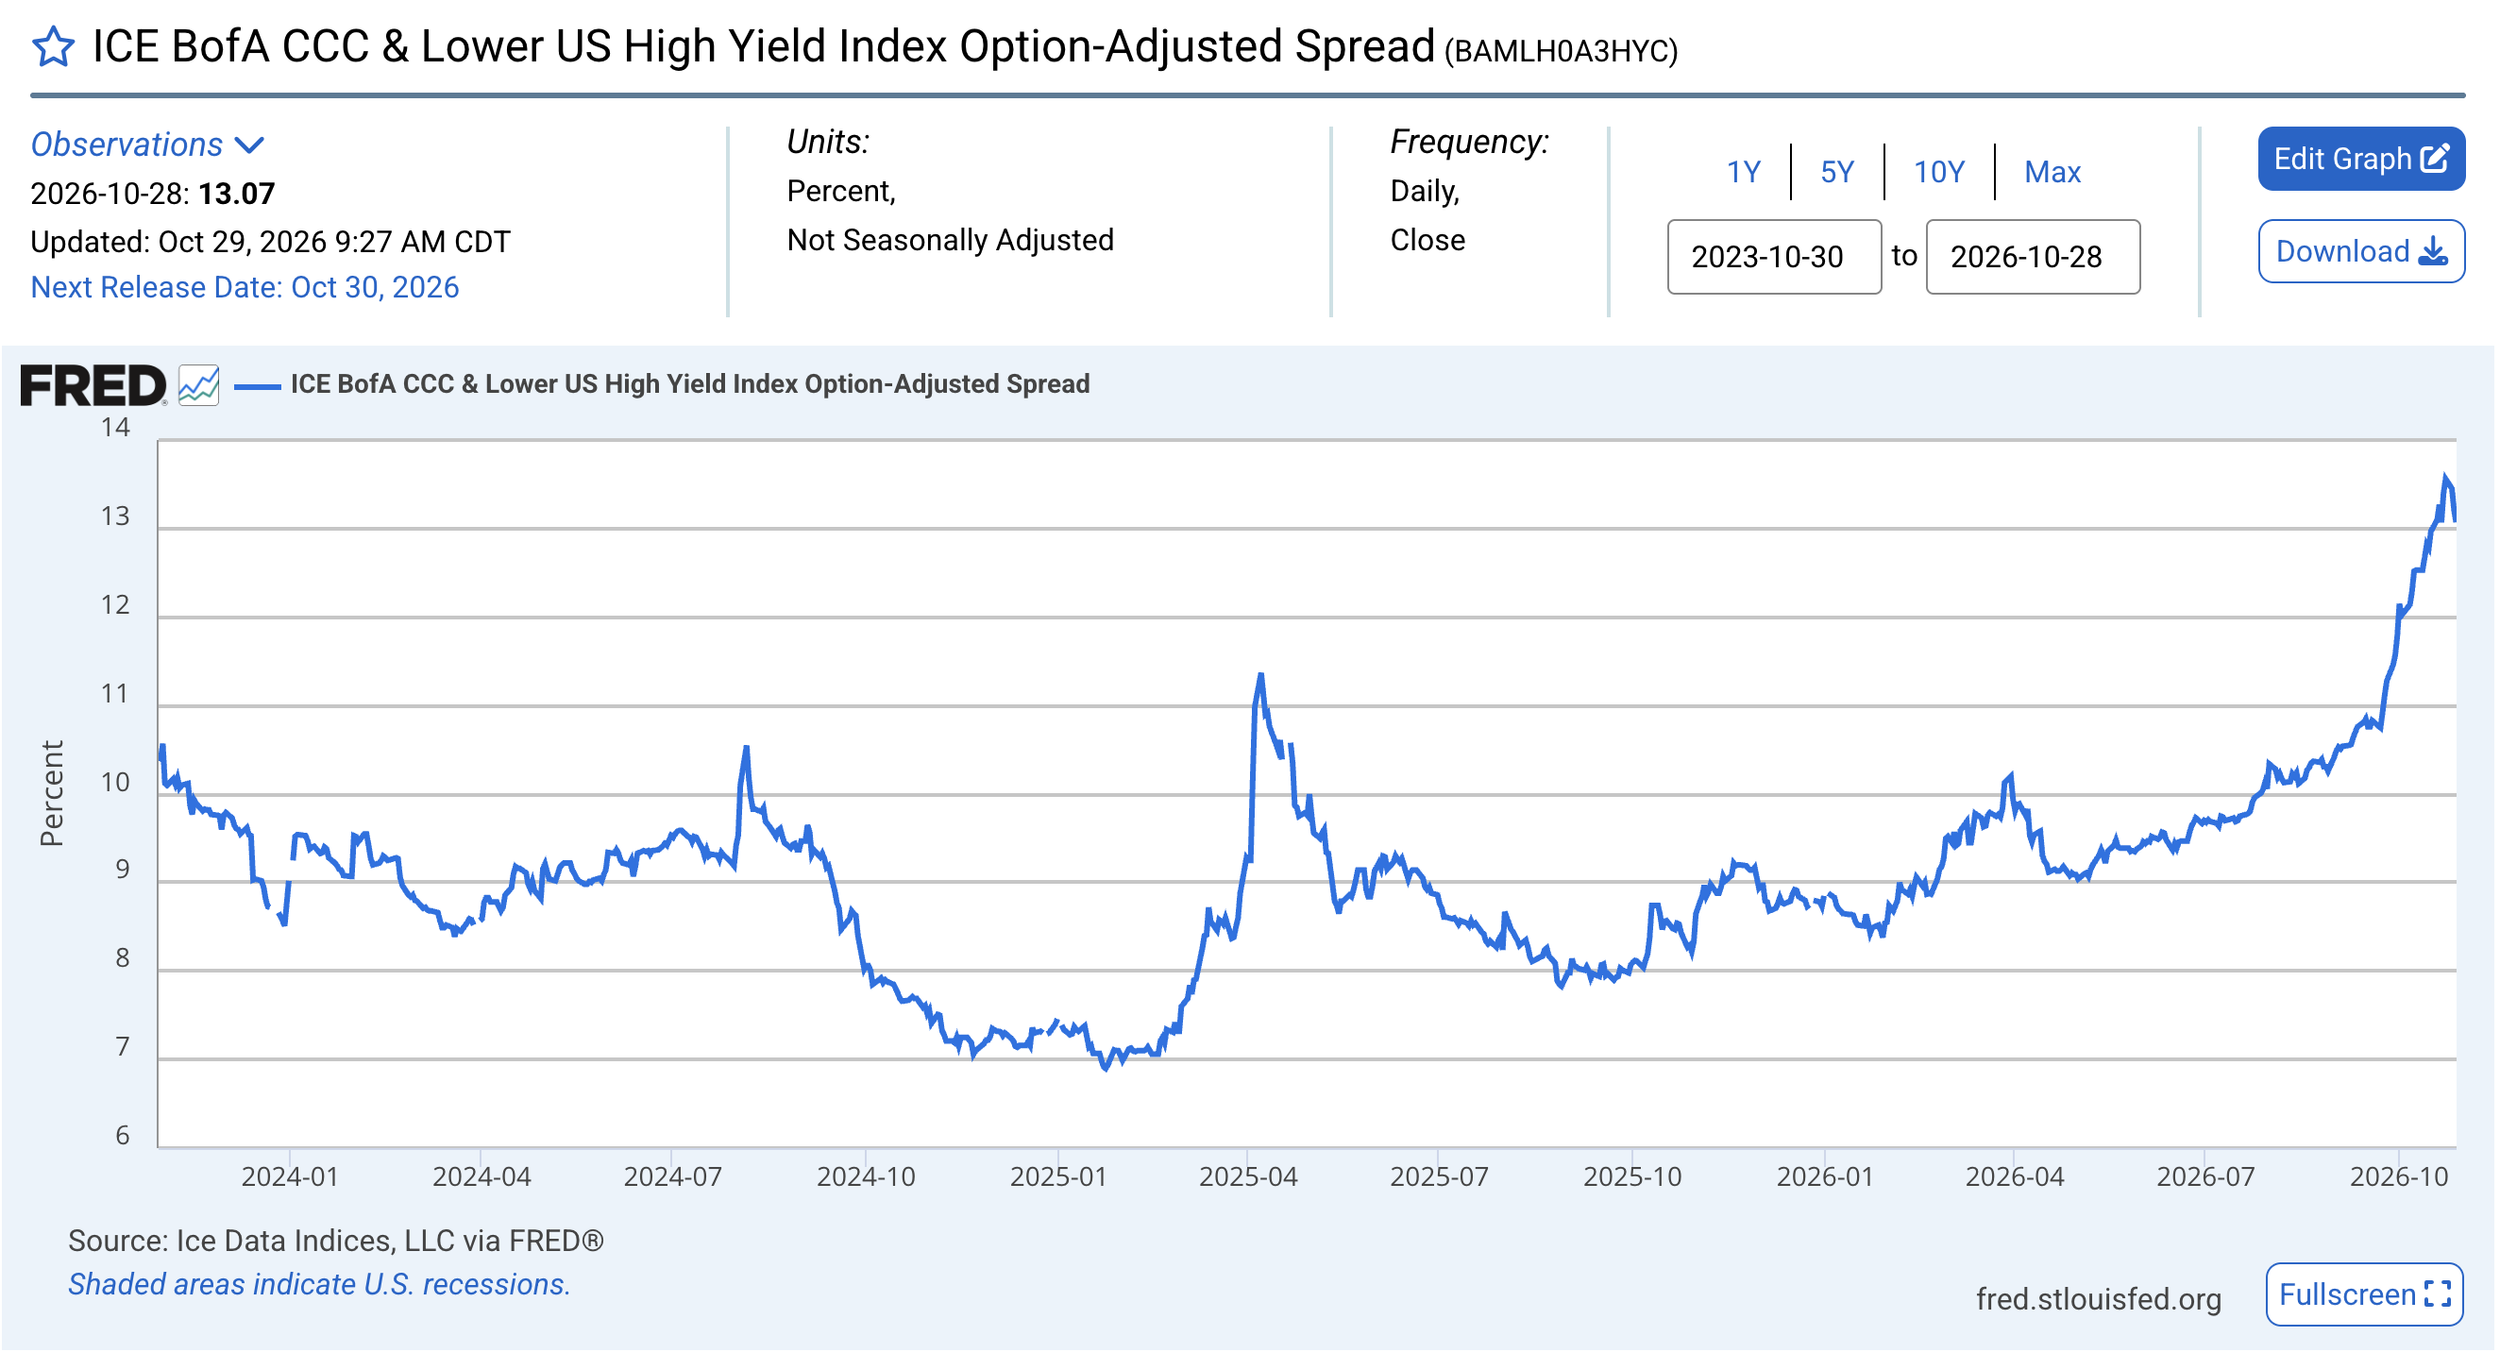
Source: FRED
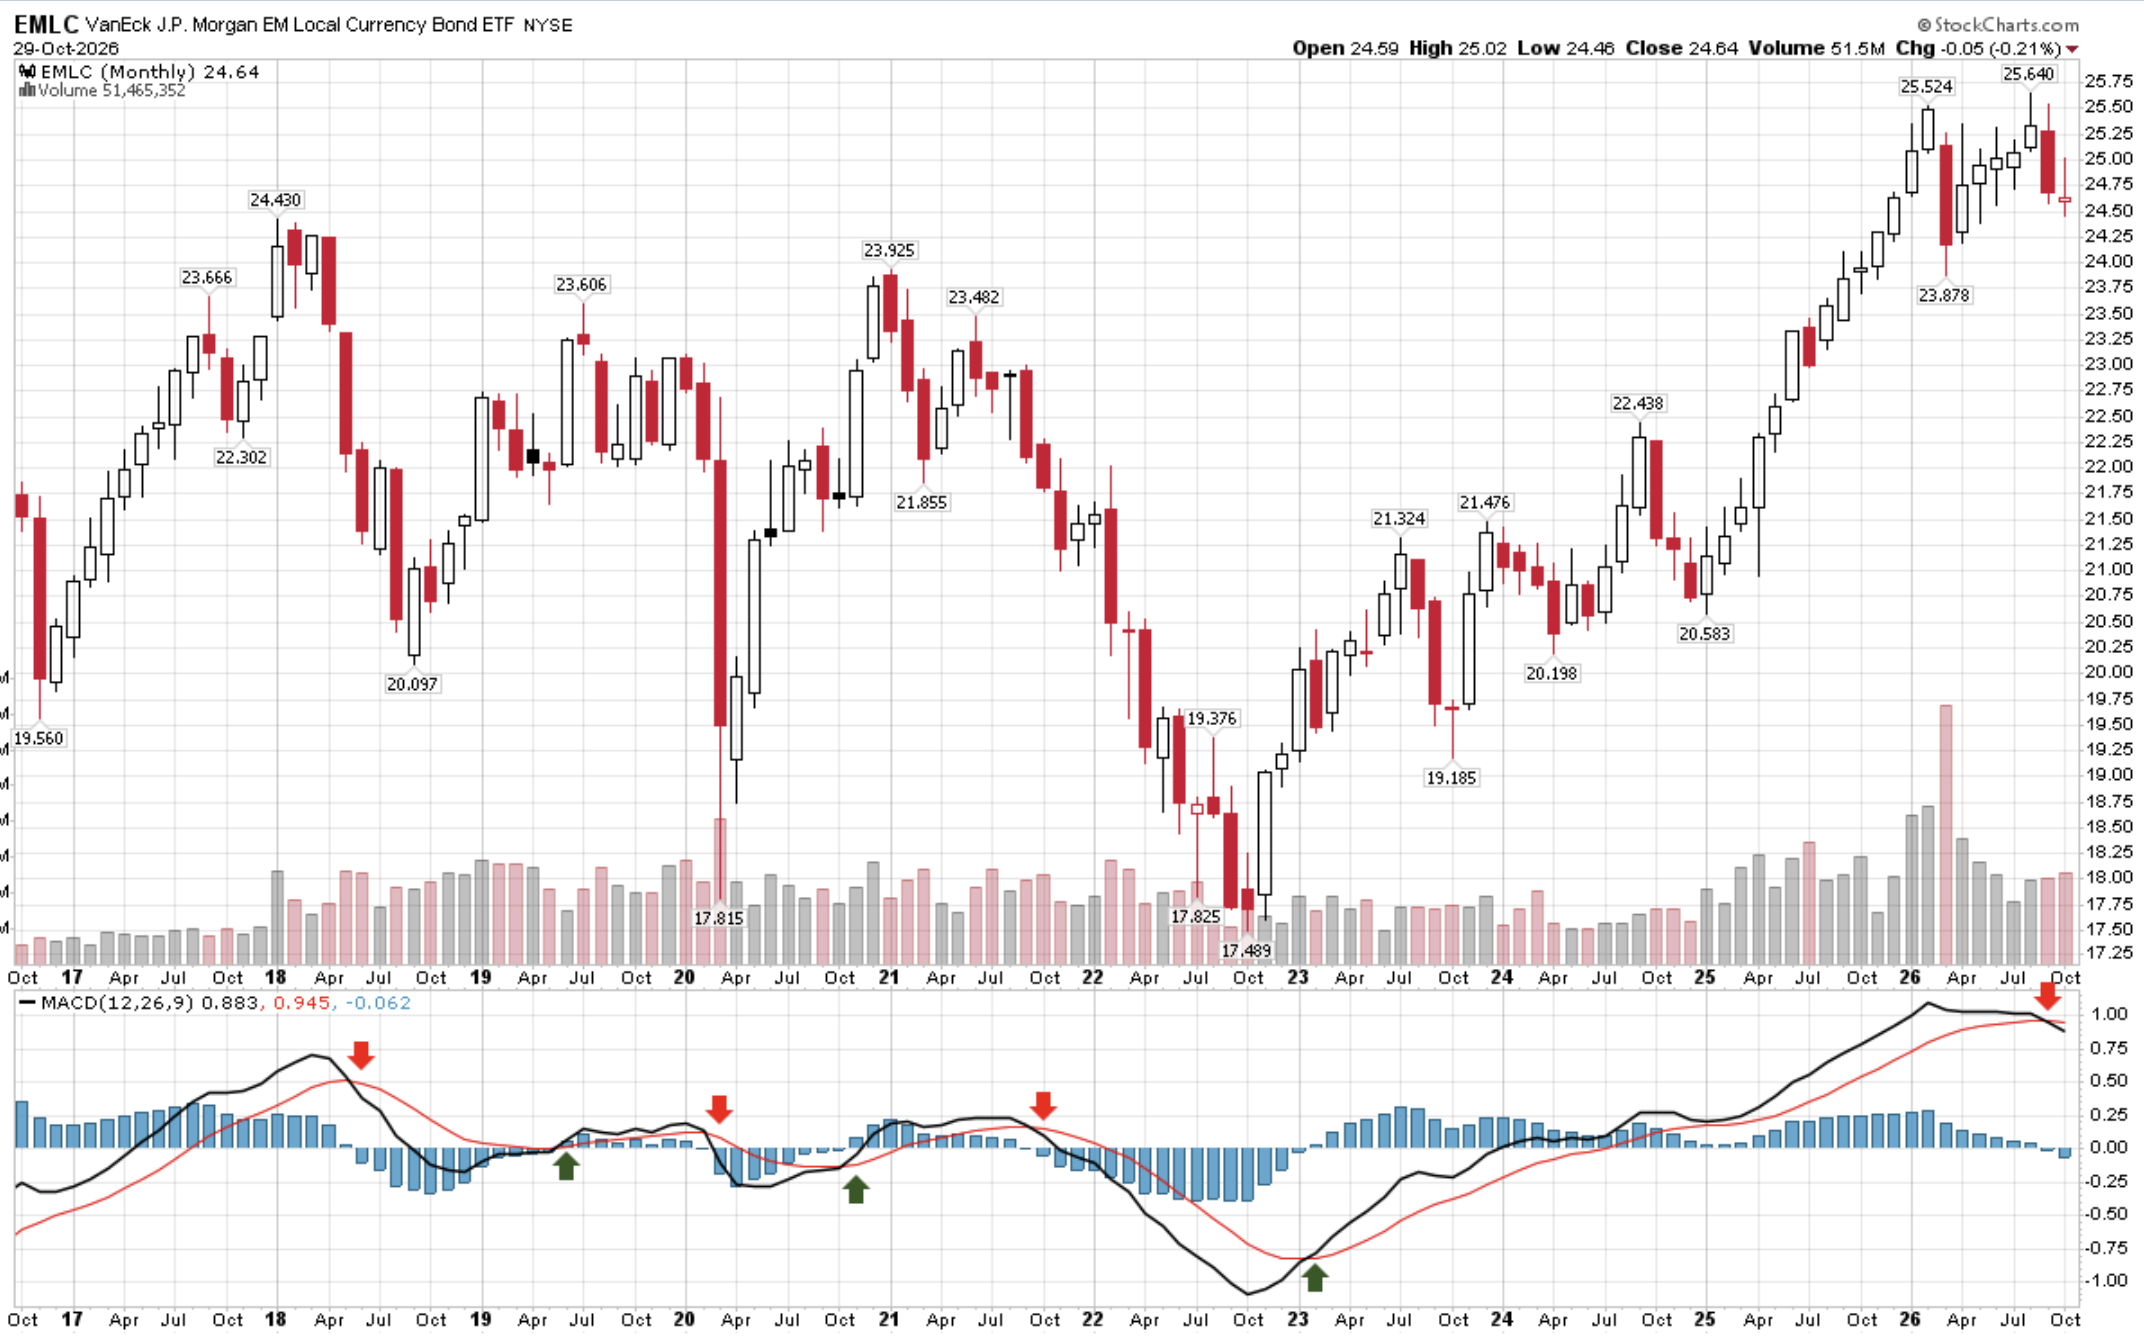
Emerging Market Local Currency Bond ETF - Monthly MACD Bear Trend Signal
Another signal to watch: EM debt, where some of the carry-trade leverage sits (borrow cheaply in yen, invest in higher-yielding EM bonds).
How to read the chart:
Calm and steady is good; a sharp price decline is a warning. Prices down mean yields are up.
The following is the Monthly MACD trend signal: a sell signal (downward price trend). This is the first signal since the buy trend signal in early 2023.
Bottom line: The Monthly MACD trend is down. More sellers than buyers cause prices to decline. The signal is in what is happening to the price. When bond prices decline, yields rise, and that is what we are seeing in the next chart. This is another warning sign of the unwinding of the leveraged yen carry trade.
Source: StockCharts.com, CMG Investment Research
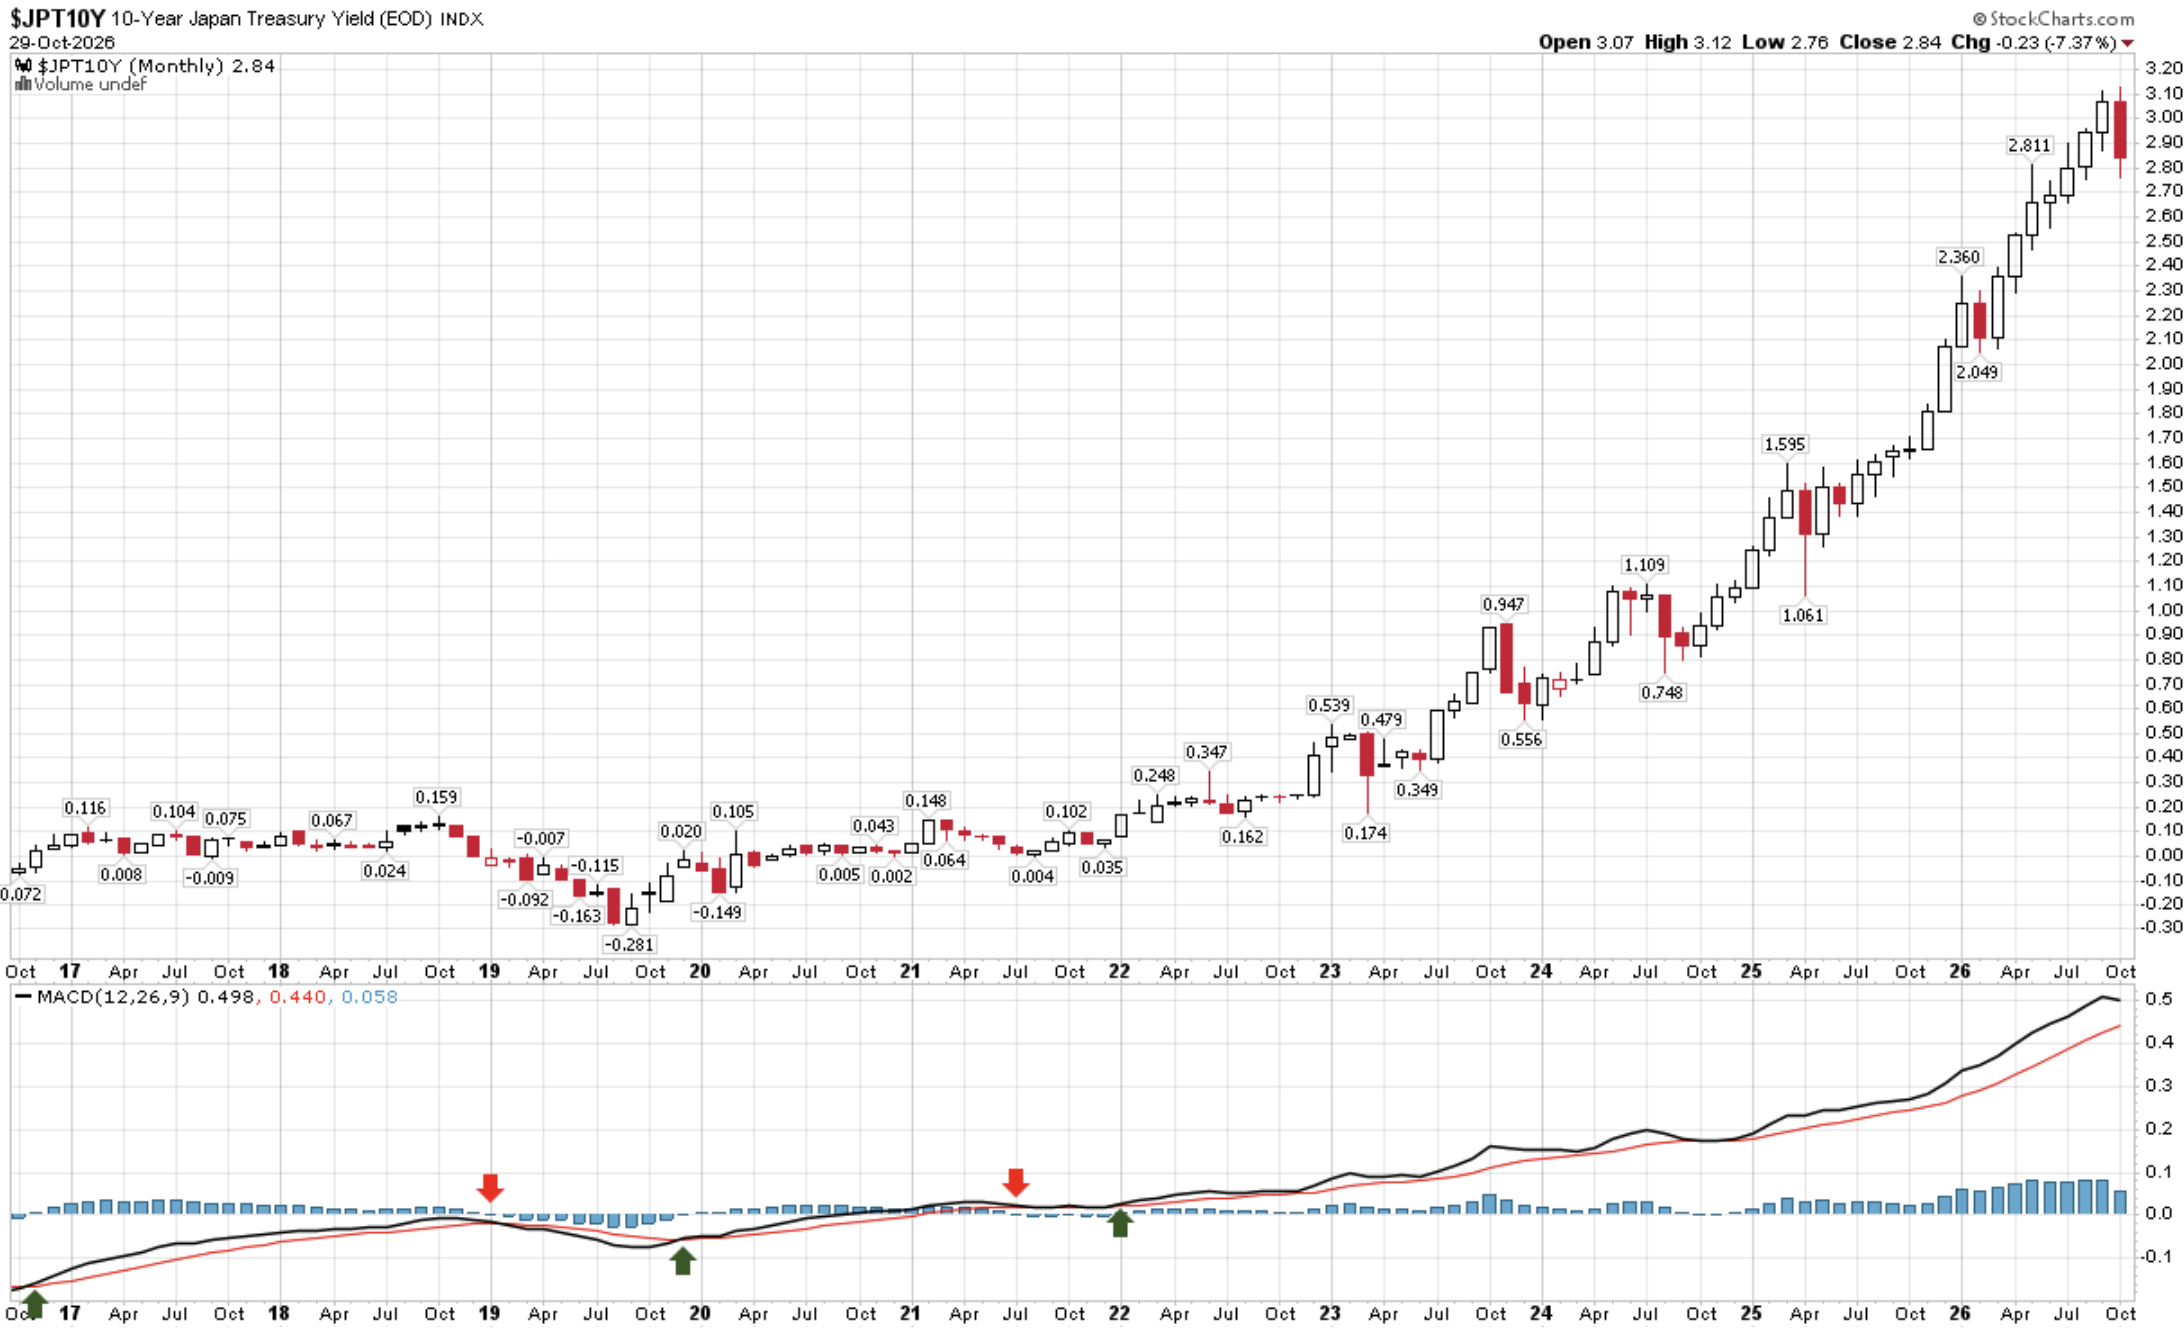
The Japan 10-year JGB yield - Monthly MACD Signaling Higher Yields (Bearish for global liquidity)
The current yield is 2.84%, down from the recent yield high of 3.12% earlier this month.
Higher JGB yields reduce the benefit of the yen carry trade. Lower JGB yields encourage borrowing in yen at low yields and investing elsewhere at higher yields to capture the spread.
The Monthly MACD is signaling higher yields (which is bearish), while the trend over the last few weeks has been lower yields.
Bottom line: There has been a large move higher in Japanese yields over the last few years. This chart is bearish for the carry trade because borrowing costs are higher in yen. Remain on high alert.
Source: StockCharts.com
Opinions are subject to change. Not a recommendation to buy or sell any security. Provided for discussion and educational purposes only.
If you like what you are reading, click on the link and share it with a friend (it’s free).
CLICK HERE TO SUBSCRIBE TO ON MY RADAR
Trade Signals: October 30, 2026 Update
Market Commentary
Subscribers will receive TS tomorrow morning. I wanted to wait until today’s market close to assess any potential market impact following Wednesday’s Fed decision and to review the month-end data.
Trade Signals is free for CMG clients and a paid subscription service for others. Selfishly, I write it for myself each week, and have for years, with the goal of staying disciplined in the markets.
Trade Signals
The Indicators Dashboard - Stocks, Investor Sentiment, Bonds, Commodities, Currencies, and Gold
Valuations and Subsequent 10-year Returns
Supporting Charts with Explanations

TRADE SIGNALS SUBSCRIPTION ACKNOWLEDGEMENT / IMPORTANT DISCLOSURES
About Trade Signals - Trade Signals is a paid subscription service that posts daily, weekly, and monthly market trends (and more). Free for CMG clients. Not a recommendation to buy or sell any security. For discussion purposes only.
The views expressed herein are solely those of Steve Blumenthal as of the date of this report and are subject to change without notice. Please note that the information provided is not recommended for buying or selling any security and is provided for discussion purposes only.
Personal Note: Myopia Hunt Club
Herbert Corey Leeds was born in Boston in 1855. He was quite an athlete. He played baseball and football at Harvard, later sailed on America's Cup yachts, and even found time to write two books on bridge. Somewhere along the way, in middle age, he took up golf at The Country Club in Brookline. Within a couple of years, he was playing to a scratch handicap. Not bad for a late start!
Leeds was also a member of Myopia Hunt Club, a fox-hunting club in Hamilton, Massachusetts, just north of Boston. A fun bit of history: the club got its unusual name from its founders, a group of brothers who were all nearsighted and wore glasses. Hence, Myopia.
By 1896, Leeds had grown tired of the club's nine-hole golf course. He was asked to do something about it. He had no formal training in golf course design and no fancy plans. What he did have was a good eye for the land and a clever idea.
He watched the best golfers play, placing little white chips where their well-struck drives landed. Then he'd put a bunker right there. His thinking was simple: a good golf shot should require more than just hitting the ball well. You had to think your way around the course, too.
And boy, did he make the players think.
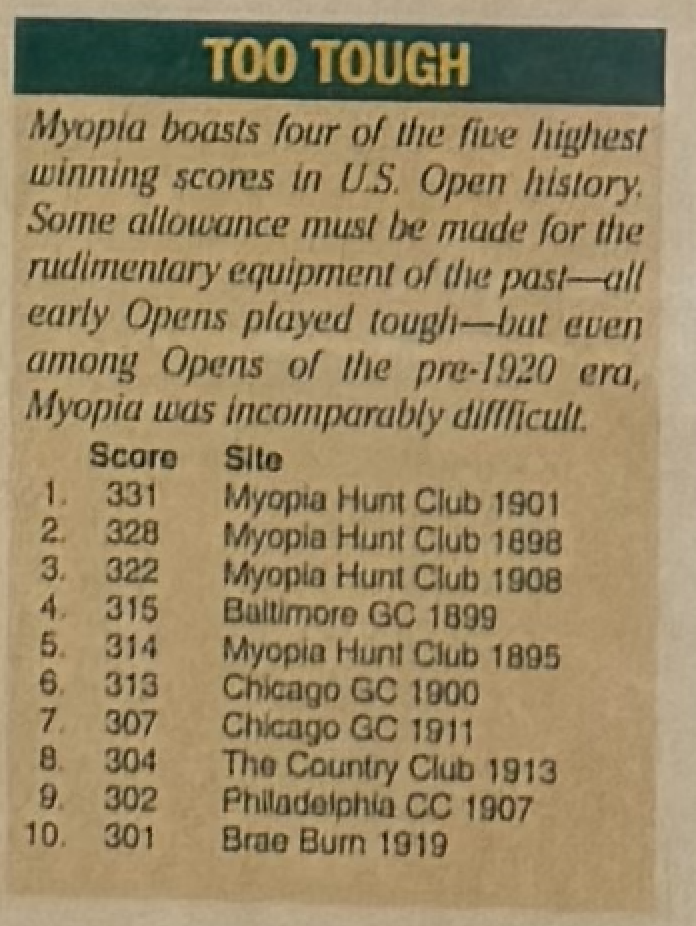
Myopia went on to host four of the first fourteen U.S. Opens, in 1898, 1901, 1905, and 1908. In the 1901 championship, not a single professional broke 80 in any round. Willie Anderson won with a four-round total of 331 strokes. To this day, it remains the highest winning score in U.S. Open history. Imagine that!
Leeds continued caring for the course for roughly 30 years, until his death in 1930. What I find especially interesting is how little he changed the natural landscape. He worked with what the glaciers had left behind: rolling hills, old stone walls, a pond, and open fairways where sheep once grazed.
The result was a golf course that could humble the very best players in the world. And it still can.
Calling Myopia tough is an understatement.
Golf World wrote about Myopia in 1995. While visiting the club, I spotted a photograph hanging in the men's locker room and took a picture of it. I thought you'd enjoy seeing it.
Source: Myopia Hunt Club locker room
Today, Myopia is ranked #54 in America by Golf Digest and #86 in the world by GOLF Magazine. Tom Doak, Stonewall’s architect, called the 4th hole “the best hole of its length in the free world.” I had never heard of Leeds. I left Myopia in awe. I was in Boston this week for the annual Schwab Advisor Conference and to visit several clients. A friend’s invitation took me to Myopia. Late October in New England did the rest. The maples were red, orange, and gold; the fescue had turned copper; horses were stabled by the polo field; hounds were barking in the distance, and there were stunning, long, open views across Leeds’ masterpiece. I’ve been lucky enough to play some special places. This one goes in my top five. A warm thank you to my dear friend Larry C.
Grateful!

Matt, Larry and Steve 12th tee box
I’m finishing this week’s letter on the plane ride home. I meditate often, especially when I get a little offsides. One of my favorites is to close my eyes and picture the fall colors atop the 16th fairway at Stonewall. I will be adding a beautiful fall day at Myopia into my practice. Life is moving way too quickly. Wishing you, too, great fun along your journey!
Ever forward.
With kind regards,
Steve
CLICK HERE TO SUBSCRIBE TO ON MY RADAR - IT’S FREE
You can share this letter on X by clicking here.
You can share this letter on LinkedIn by clicking here.
Subscribe to OMR for free by clicking the photo.
Stephen B. Blumenthal
Founder and CEO
CMG Capital Management Group, Inc.
75 Valley Stream Parkway, Suite 201
Malvern, PA 19355
CMG Customer Relationship Summary (Form CRS)
Metric-Financial, LLC Customer Relationship Summary (Form CRS)

Stephen Blumenthal founded CMG Capital Management Group in 1992 and serves today as its CEO. Steve authors a free weekly e-letter entitled, “On My Radar.” Steve shares his views on macroeconomic research, valuations, portfolio construction, asset allocation and risk management. Author of Forbes Book: On My Radar, Navigating Stock Market Cycles.
Follow Steve on X @SBlumenthalCMG and LinkedIn.
IMPORTANT DISCLOSURE INFORMATION
This document is prepared by CMG Capital Management Group, Inc. (“CMG”) and is circulated for informational and educational purposes only. There is no consideration given to the specific investment needs, objectives, or tolerances of any of the recipients. Additionally, CMG’s actual investment positions may, and often will, vary from its conclusions discussed herein based on any number of factors, such as client investment restrictions, portfolio rebalancing, and transaction costs, among others. Recipients should consult their own advisors, including tax advisors, before making any investment decision. This material is for informational and educational purposes only and is not an offer to sell or the solicitation of an offer to buy the securities or other instruments mentioned. This material does not constitute a personal recommendation or take into account the particular investment objectives, financial situations, or needs of individual investors which are necessary considerations before making any investment decision. Investors should consider whether any advice or recommendation in this research is suitable for their particular circumstances and, where appropriate, seek professional advice, including legal, tax, accounting, investment, or other advice. The views expressed herein are solely those of Steve Blumenthal as of the date of this report and are subject to change without notice.
Investing involves risk.
This letter may contain forward-looking statements relating to the objectives, opportunities, and future performance of the various investment markets, indices, and investments. Forward-looking statements may be identified by the use of such words as; “believe,” anticipate,” “planned,” “potential,” and other similar terms. Examples of forward-looking statements include, but are not limited to, estimates with respect to financial condition, results of operations, and success or lack of success of any particular market, index, investment, or investment strategy. All are subject to various factors, including, but not limited to, general and local economic conditions, changing levels of competition within certain industries and markets, changes in legislation or regulation, Federal Reserve policy, and other economic, competitive, governmental, regulatory, and technological factors affecting markets, indices, investments, investment strategy and portfolio positioning that could cause actual results to differ materially from projected results. Such statements are forward-looking in nature and involve a number of known and unknown risks, uncertainties, and other factors, and accordingly, actual results may differ materially from those reflected or contemplated in such forward-looking statements. Investors are cautioned not to place undue reliance on any forward-looking statements or examples. All statements made herein speak only as of the date that they were made. Investing is inherently risky and all investing involves the potential risk of loss.
Past performance does not guarantee or indicate future results. Different types of investments involve varying degrees of risk, and there can be no assurance that the future performance of any specific investment, investment strategy, or product (including the investments and/or investment strategies recommended or undertaken by CMG), or any non-investment related content, made reference to directly or indirectly in this commentary will be profitable, equal any corresponding indicated historical performance level(s), be suitable for your portfolio or individual situation or prove successful. Due to various factors, including changing market conditions and/or applicable laws, the content may no longer be reflective of current opinions or positions. Moreover, you should not assume that any discussion or information contained in this commentary serves as the receipt of, or as a substitute for, personalized investment advice from CMG. Please remember to contact CMG, in writing, if there are any changes in your personal/financial situation or investment objectives for the purpose of reviewing/evaluating/revising our previous recommendations and/or services, or if you would like to impose, add, or to modify any reasonable restrictions to our investment advisory services. Unless, and until, you notify us, in writing, to the contrary, we shall continue to provide services as we do currently. CMG is neither a law firm, nor a certified public accounting firm, and no portion of the commentary content should be construed as legal or accounting advice.
No portion of the content should be construed as an offer or solicitation for the purchase or sale of any security. References to specific securities, investment programs or funds are for illustrative purposes only and are not intended to be, and should not be interpreted as recommendations to purchase or sell such securities.
This presentation does not discuss, directly or indirectly, the amount of the profits or losses realized or unrealized, by any CMG client from any specific funds or securities. Please note: In the event that CMG references performance results for an actual CMG portfolio, the results are reported net of advisory fees and inclusive of dividends. The performance referenced is that as determined and/or provided directly by the referenced funds and/or publishers, has not been independently verified, and does not reflect the performance of any specific CMG client. CMG clients may have experienced materially different performance based upon various factors during the corresponding time periods. See in links provided citing limitations of hypothetical back-tested information. Past performance cannot predict or guarantee future performance. Not a recommendation to buy or sell. Please talk to your advisor.
Information herein has been obtained from sources believed to be reliable, but we do not warrant its accuracy. This document is general communication and is provided for informational and/or educational purposes only. None of the content should be viewed as a suggestion that you take or refrain from taking any action nor as a recommendation for any specific investment product, strategy, or other such purposes.
In a rising interest rate environment, the value of fixed-income securities generally declines, and conversely, in a falling interest rate environment, the value of fixed-income securities generally increases. High-yield securities may be subject to heightened market, interest rate, or credit risk and should not be purchased solely because of the stated yield. Ratings are measured on a scale that ranges from AAA or Aaa (highest) to D or C (lowest). Investment-grade investments are those rated from highest down to BBB- or Baa3.
NOT FDIC INSURED. MAY LOSE VALUE. NO BANK GUARANTEE.
Certain information contained herein has been obtained from third-party sources believed to be reliable, but we cannot guarantee its accuracy or completeness.
In the event that there has been a change in an individual’s investment objective or financial situation, he/she is encouraged to consult with his/her investment professional.
Written Disclosure Statement. CMG is an SEC-registered investment adviser located in Malvern, Pennsylvania. Stephen B. Blumenthal is CMG’s founder and CEO. Please note: The above views are those of CMG and its CEO, Stephen Blumenthal, and do not reflect those of any sub-advisor that CMG may engage to manage any CMG strategy, or exclusively determines any internal strategy employed by CMG. A copy of CMG’s current written disclosure statement discussing advisory services and fees is available upon request or via CMG’s internet web site at www.cmgwealth.com/disclosures. CMG is committed to protecting your personal information. Click here to review CMG’s privacy policies.
See CMG Disclosures at the bottom of this page.
For more information about NDR, please visit at www.ndr.com.
NDR, Inc. (NDR), d.b.a. Ned Davis Research Group (NDRG), any NDRG affiliates or employees, or any third-party data provider, shall not have any liability for any loss sustained by anyone who has relied on the information contained in any NDRG publication. The data and analysis contained herein are provided "as is." NDRG disclaims any and all express or implied warranties, including, but not limited to, any warranties of merchantability, suitability or fitness for a particular purpose or use. NDRG's past recommendations and model results are not a guarantee of future results. This communication reflects our analysts' opinions as of the date of this communication and will not necessarily be updated as views or information change. All opinions expressed herein are subject to change without notice. NDRG or its affiliated companies or their respective shareholders, directors, officers and/or employees, may have long or short positions in the securities discussed herein and may purchase or sell such securities without notice. For NDRG's important additional disclaimers, refer to www.ndr.com/invest/public/copyright.html. Further distribution prohibited without prior permission. Copyright 2025 © NDR, Inc. All rights reserved.
The opinions are mine. Please know that there are no guarantees the above will prove correct, and that views are subject to change. See essential disclosures further below.