October 23, 2026
By Steve Blumenthal
“We may never know where we’re going, but we’d better have a good idea where we are.”
– Howard Marks, You Can’t Predict. You Can Prepare. (Oaktree memo, 2001)
Grab your coffee and find your favorite chair. This week is about leverage and where we sit in the cycle.
Leverage is the accelerant in every market cycle. On the way up, it feels like genius. On the way down, it forces selling at exactly the wrong time. Today, margin debt sits near a record 4.6% of GDP, investors hold a larger share of their portfolios in stocks than at any time on record, and the current bull market is one of the longest and strongest since 1928. Only two bull markets, the one that ended in 1946 and the great 1990s run that ended in 1998, lasted longer and gained more.
None of that tells us when this cycle ends. It does tell us where we are, and that is where good risk management begins.
You’ll also find a new white paper on tax mitigation strategies, the updated Yen Carry Trade charts, Trade Signals, and a short update in the Personal Note: a big Malvern Prep Friars win and pure joy at the end of a bittersweet day.
On My Radar: Margin Debt In A Late Cycle Bull Market
Margin Debt, Late Cycle and Other Interesting Charts
Tax Mitigation Strategies for High-Net-Worth Investors
The Yen Carry Trade and Key Data Charts
Trade Signals: October 22, 2026
Personal Note: Sunny Days
OMR is for informational and educational purposes only. No consideration is given to your specific investment needs, objectives, or tolerances.
Please see the Important Disclosures at the bottom of this page. Reminder: This is not a recommendation to buy or sell any security. My views may change at any time. The information is for discussion and educational purposes only.
If you like what you are reading, you can subscribe for free.

Margin Debt, Late Cycle and Other Interesting Charts
Margin Debt
Leverage doesn’t start the fire. It decides how hot the fire burns once something does.
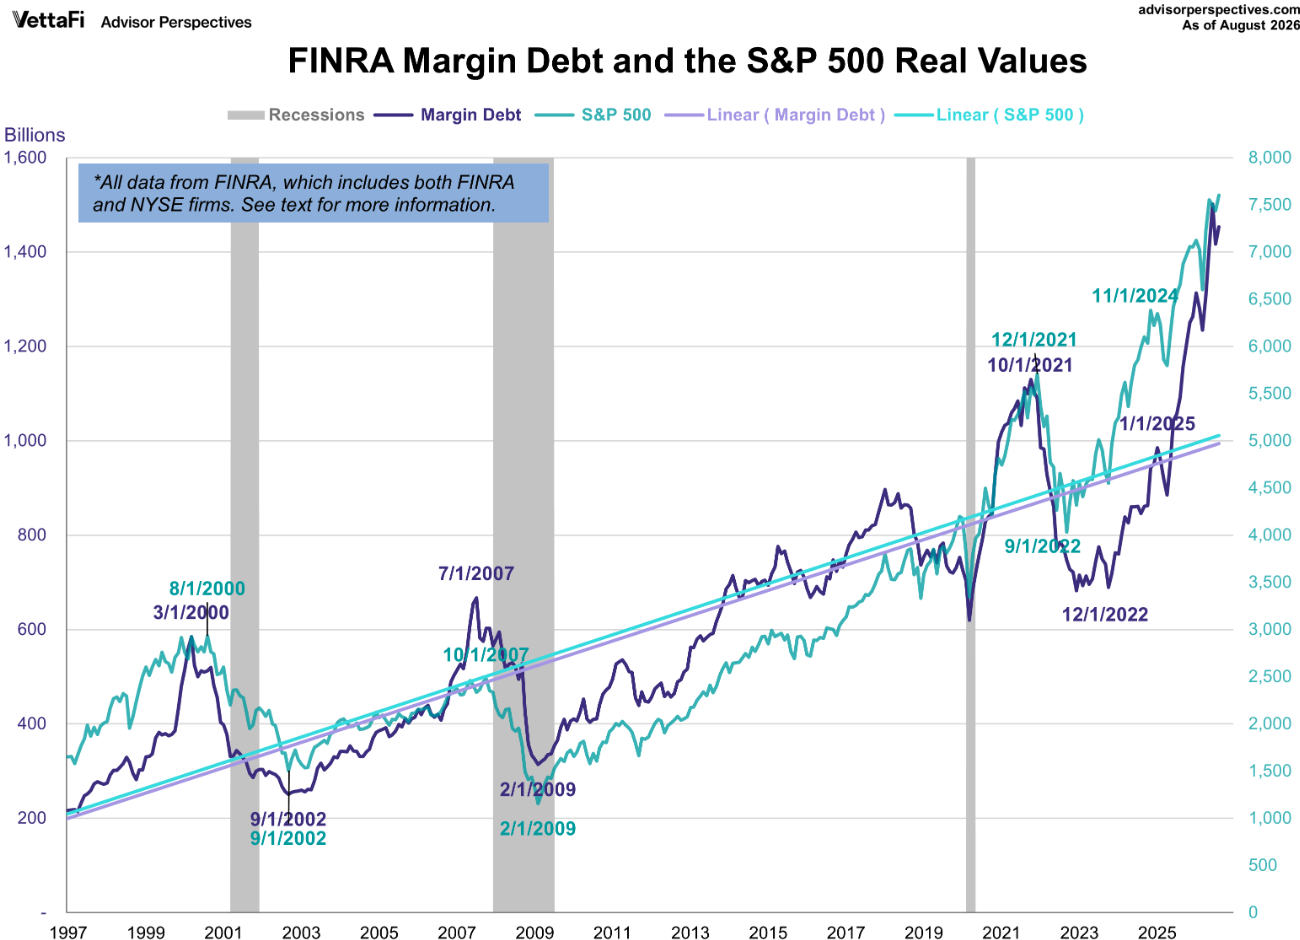
FINRA margin debt hit a record $1.50 trillion in June. Then came something interesting. July saw the largest one-month dollar decline on record (about –$85 billion). Investors shrugged and went right back to borrowing: $1.45 trillion in August and $1.48 trillion in September, up roughly 31% from a year ago.
Back in Rising Tide (OMR July 3), I shared that margin debt stood at $1.42 trillion, or 4.45% of GDP. Today, it sits at roughly 4.6% of GDP, the highest reading on record, dating back to 1997. Relative to the size of the economy that ultimately has to support it, this is the most leveraged the U.S. stock market has ever been.
Source: Advisor Perspectives
In fairness, there is a reasonable counterpoint. Measured against the value of the stocks being borrowed, margin debt is right around its historical average (First Trust puts it at 2.3% of S&P 500 market cap, which is equal to its long-run average). Stock prices have risen about as fast as the borrowing. That’s the bull case, and it isn’t wrong.
Here’s my issue with it. That ratio uses stock prices in the denominator. When prices fall, the ratio jumps at exactly the moment you don’t want it to. The collateral shrinks, the loan doesn’t, and margin calls turn selling into forced selling. Measuring leverage against GDP tells you how big the bet is. Measuring it against market cap tells you how good the bet looks while it’s working. Keep in mind that it is always leverage that blows things up.
One more data point that caught my eye. Schwab reported that its clients owed $187.9 billion in margin loans at the end of September, more than twice the late-2021 high and up about 93% in twelve months. To be fair, a meaningful slice of that (roughly $27 of every $100 Schwab clients borrow against their portfolios) sits in tax-aware long/short strategies, not pure speculation. Still, the direction is clear.
What history tells us: margin debt peaks tend to arrive at or a few months ahead of market peaks. March 2000 was nearly coincident. July 2007 came three months before the October 2007 top. October 2021 came about two and a half months before the January 2022 top. It is not a precise timing tool. What matters most is the rate of change. When year-over-year growth rolls over and turns negative, deleveraging begins to feed on itself. A June record followed by a record one-month drop is worth keeping on the radar. We’ll see. Sources: FINRA, thetrading.tools, First Trust, Charles Schwab, Stock Titan
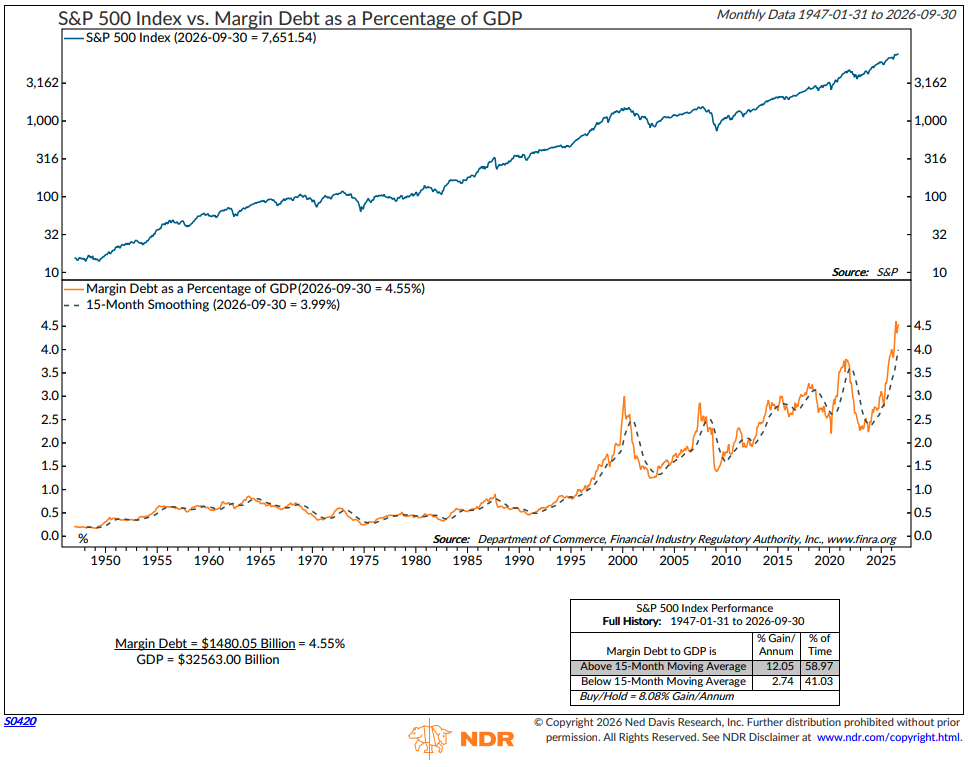
Chart: NDR Margin Debt vs 15-Month Moving Average
Performance is better when Margin Debt (orange line) is above its 15-month moving average. Generally, risk remains on until the dotted line is breached. Frankly, I’d prefer a shorter moving average line (more sensitive to a turn lower), but this can help from a long-term trend perspective.
Source: NDR, Department of Commerce, FINRA
Late Cycle - A History of Bull Markets: S&P 500 (1928–Present) - One of the strongest and longest bull markets on record
Back in OMR: Look Up, I wrote about the “four o’s”: overvalued, overconcentrated, overowned, and overleveraged. The charts that follow, courtesy of my friends at Ned Davis Research, check most of the boxes. Together, they tell us where we are in the cycle. No one can know when it stops. As Marks said, “We may never know where we’re going, but we’d better have a good idea where we are.”
Source: Ned Davis Research, S&P Dow Jones Indices
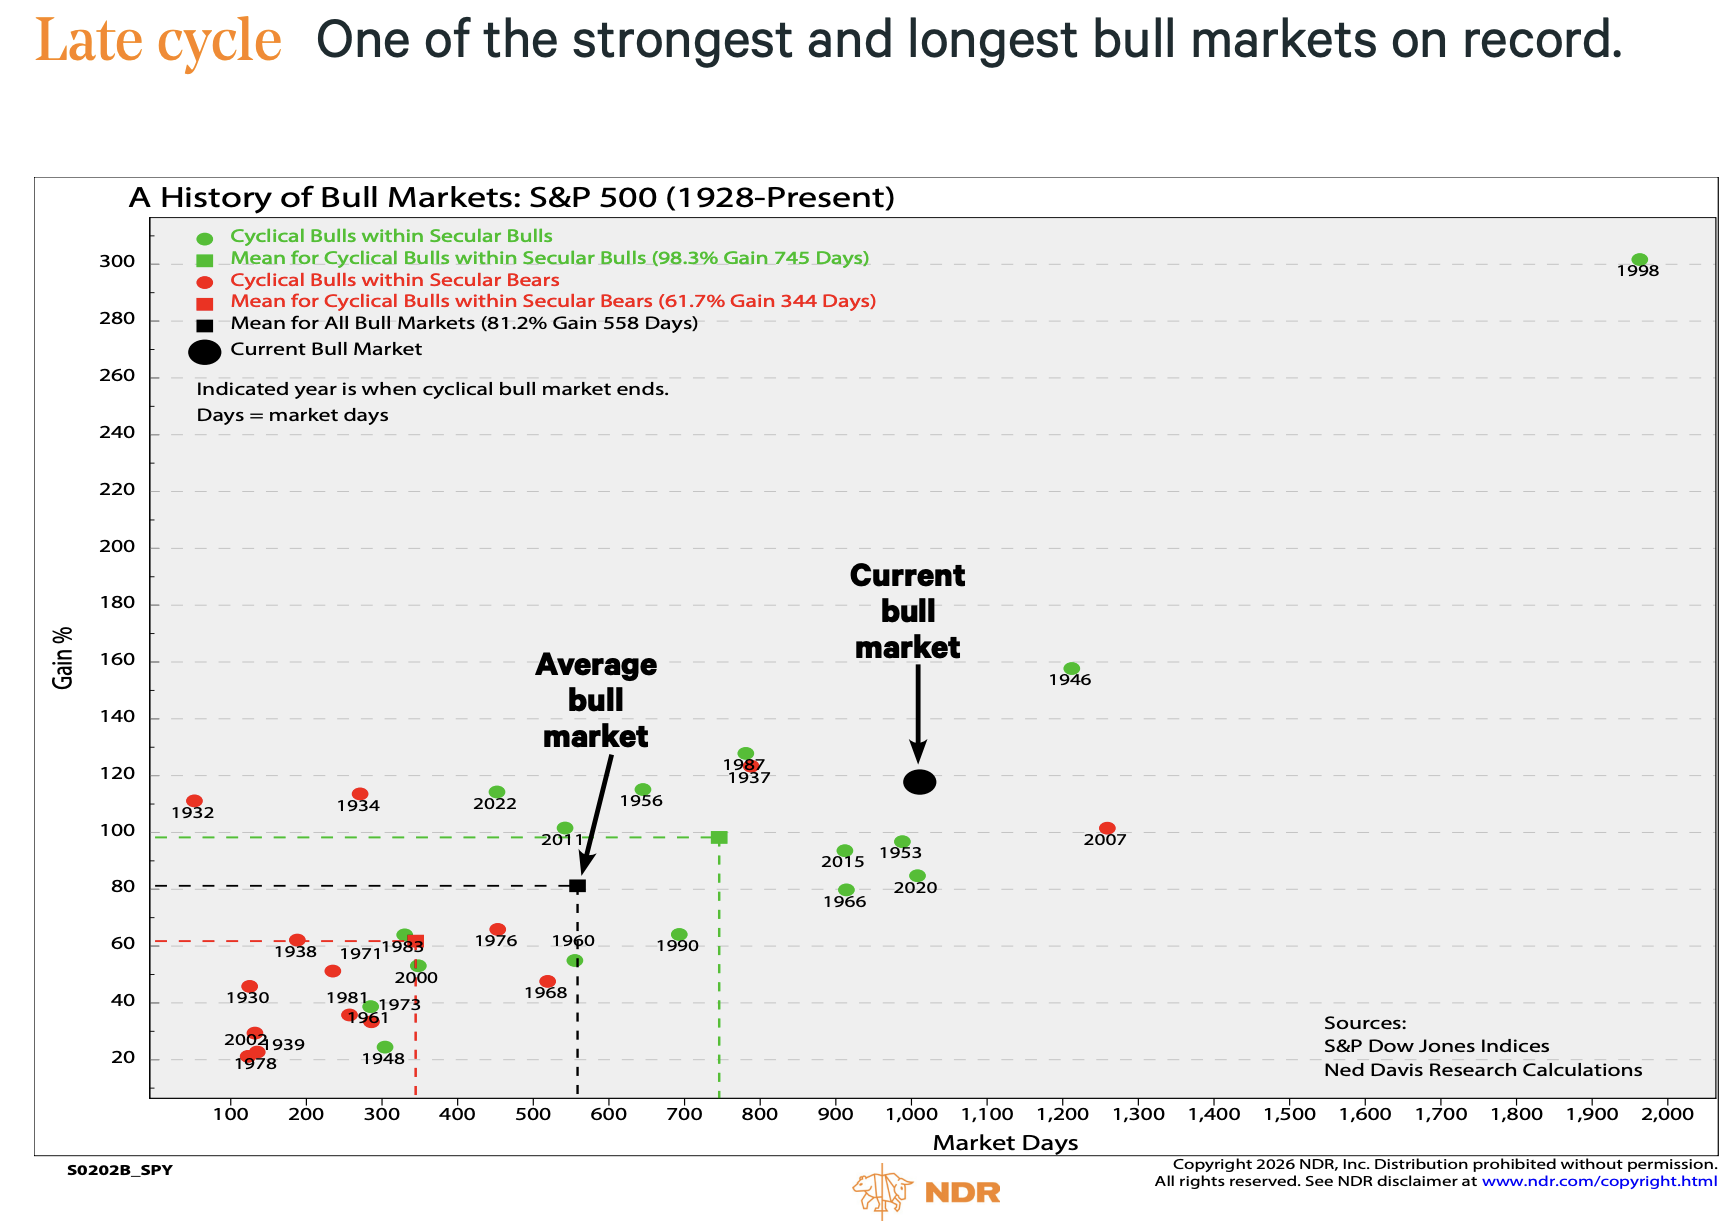
Each dot is a cyclical bull market in the S&P 500 since 1928. Across the bottom is how long it lasted (in market days). Up the side is how much it gained. The year shown is when the bull market ended.
The average bull market gained 81% over 558 market days. Bull markets that occur inside longer secular bull markets have done better, averaging 98% over 745 days. The current bull market, dated from the October 2022 low, is roughly 1,010 market days old and up about 118%.
Only two bull markets since 1928 were both longer and stronger: the run that ended in 1946 and the great 1990s run that ended in 1998. That’s rare company.
Bull markets don’t die of old age. They die from excess, from Fed tightening, or from recession. But age tells us we are much closer to the end of the story than the beginning, and the next few charts suggest the excess part is already here.
Average Equity Allocation vs. Subsequent 10-Year S&P 500 Total Return
Source: Ned Davis Research, Federal Reserve Board, S&P Dow Jones Indices; concept courtesy of Philosophical Economics
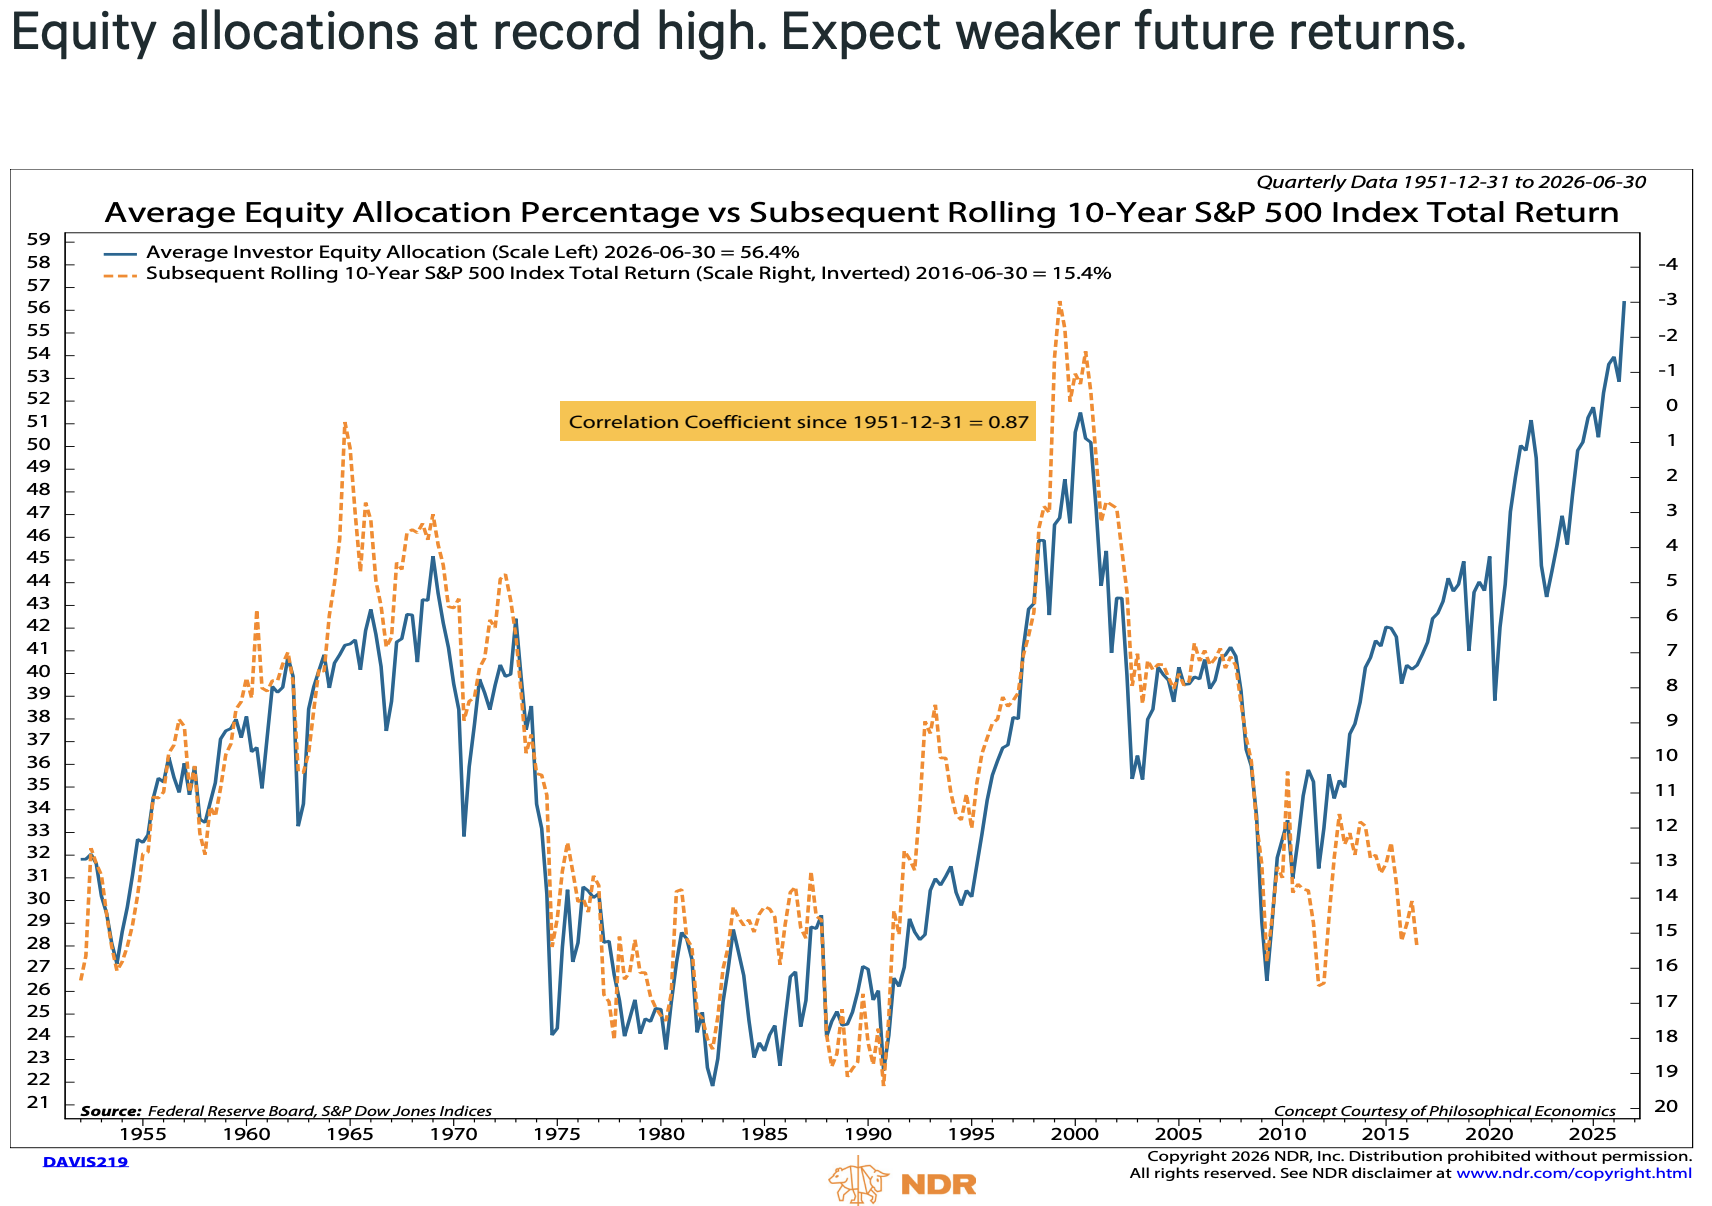
This may be the single most important chart in this week’s letter. The blue line shows how much of the average investor’s portfolio is in stocks (versus bonds and cash). The orange dotted line shows the S&P 500’s total return over the following ten years, plotted upside down so the two lines move together.
The relationship has been remarkably tight, with a correlation of 0.87 since 1951. When investors owned very little stock (the early 1980s, around 22% to 25%), the next ten years delivered annual returns in the high teens. When investors were “all in” at the 2000 peak (about 51%), the next ten years delivered roughly –1% to –3% per year.
Today’s reading is 56.4%, a new record, above the 2000 peak. The logic is simple: when everyone already owns stocks, who is left to buy? Taken at face value, this chart suggests low-single-digit, or even negative, annualized returns over the next decade. That is consistent with the roughly +2% to –2% decade return baseline I’ve shared with you before.
Now the humble part. Look closely at the right side of the chart. Since about 2010, actual returns have run well ahead of what this model implied. In mid-2016, the model suggested something like 7% per year; investors got 15.4%. Buybacks, the rise of 401(k) and index investing, and the dominance of a handful of highly profitable mega-cap companies may have changed the relationship. One also has to consider the massive amount of government spending that has helped sustain the economy and avoid recession. Or perhaps the bill may simply be coming due later. I don’t think the signal is broken. I think it’s telling us to keep expectations low and risk management high.
Other Interesting Charts
NDR – S&P 500 vs. Percent of Stocks Above 200-Day Moving Averages
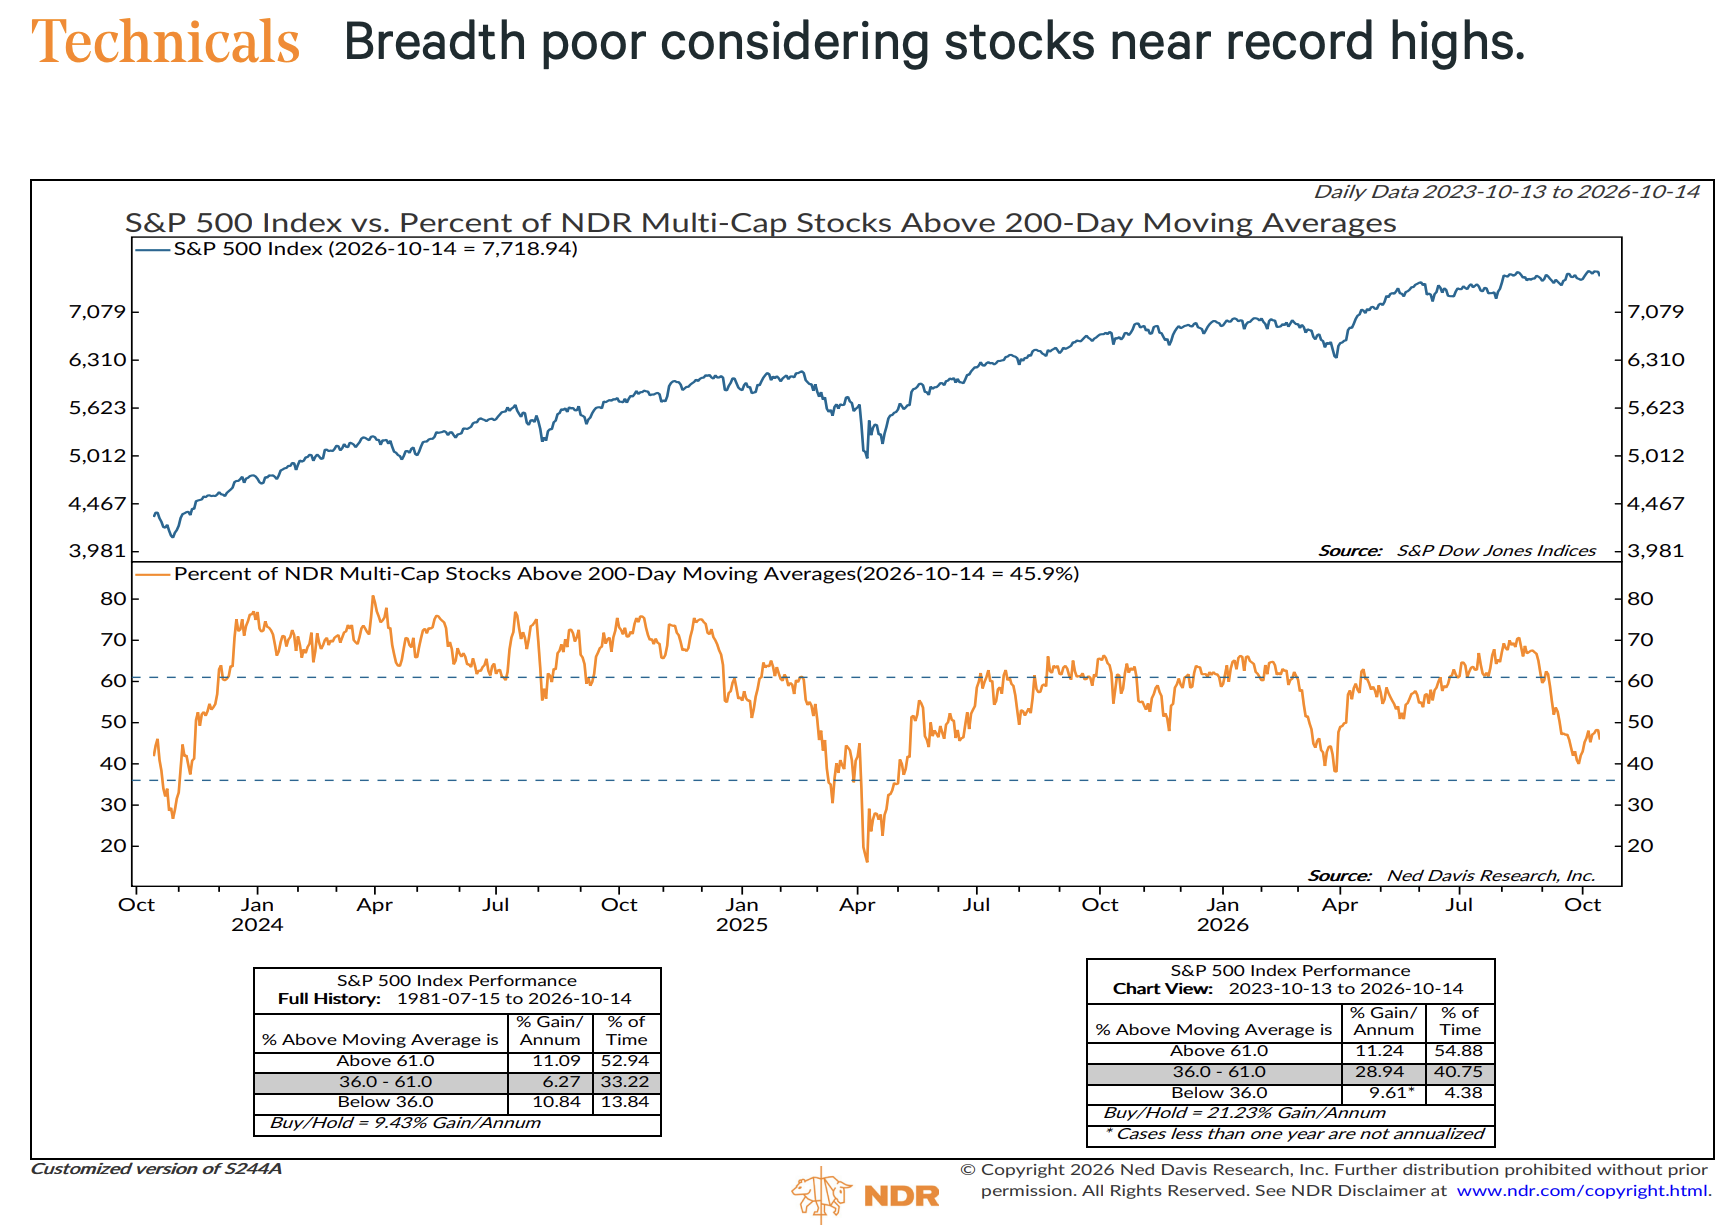
Source: Ned Davis Research, S&P Dow Jones Indices
The S&P 500 closed at 7,719 on October 14, a stone’s throw from its record. Yet only 45.9% of stocks are trading above their 200-day moving average, down from about 70% in August. The generals are leading the charge, but fewer of the troops are following.
The table at the bottom left is the key. Since 1981, when more than 61% of stocks are above their 200-day average, the S&P 500 has gained about 11% per year. When fewer than 36% are (a washout, which often marks a buying opportunity), returns have also been strong. But in the mushy middle zone where we are today, returns have averaged just 6.3% per year, below the 9.4% buy-and-hold return. Not a sell signal, but a yellow light. I’m not sure about you, but I love how NDR quantifies their research.
CHART: NDR – Select S&P 500 Sector Weights
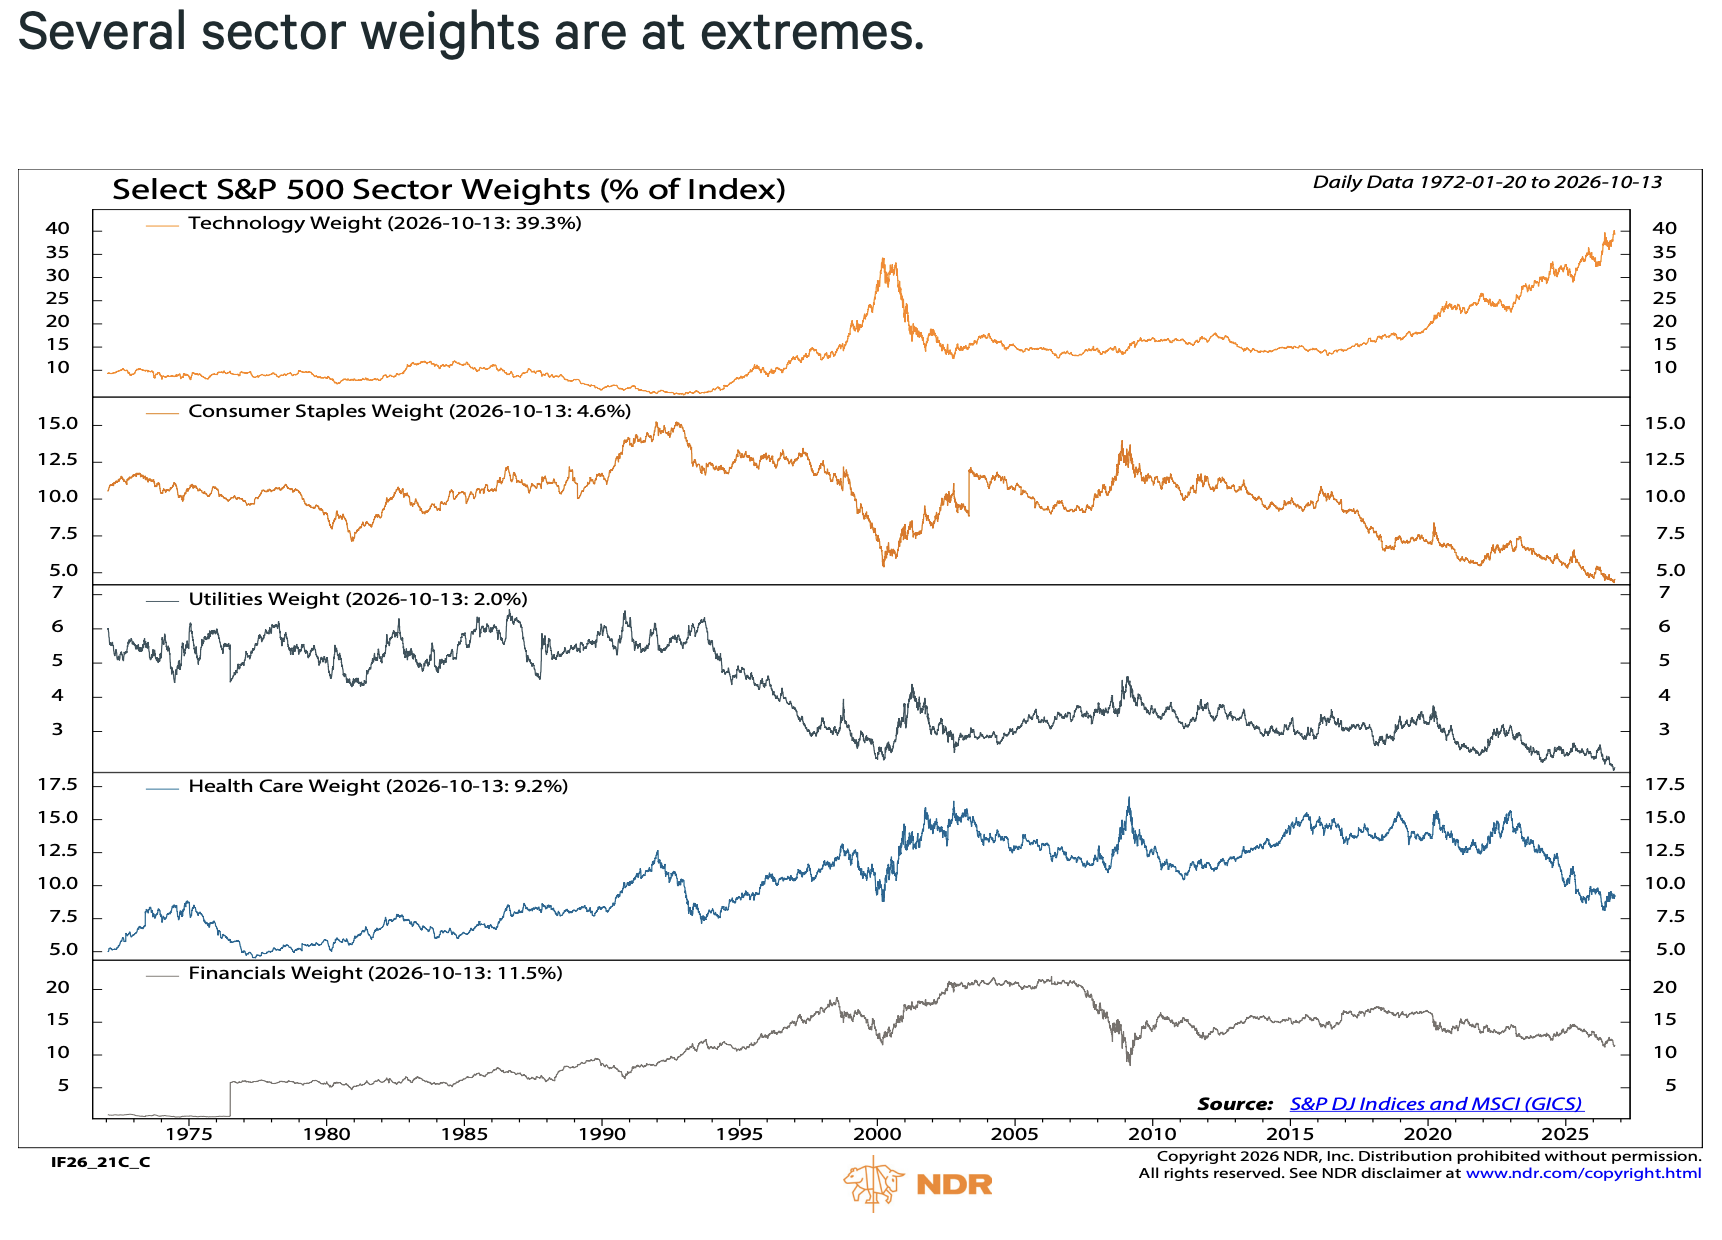
Source: Ned Davis Research, S&P Dow Jones Indices and MSCI (GICS)
This is the “overconcentrated” chart. Technology now makes up a record 39.3% of the S&P 500, above the 2000 dot-com peak of about 34%. And here’s the part I think most people miss: that 39.3% doesn’t include Alphabet or Meta (reclassified to Communication Services in 2018) or Amazon (Consumer Discretionary). The real exposure to the AI and big-tech trade is meaningfully higher. If you own an S&P 500 index fund, you own a tech fund with some other stuff attached.
Look at the other end. Consumer Staples (4.6%) and Utilities (2.0%) are at record low weights. Health Care (9.2%) is at its lowest since the mid-1990s, and Financials (11.5%) at their lowest since 2009. Utilities at a record low weight is especially interesting, given how much of the AI story depends on electricity.
Earlier this year, I showed how quality and value were unloved at the 2000 peak and went on to outperform over the following decade. Extremes in sector weights don’t reverse on schedule, but they do eventually reverse. This is where diversification earns its keep.
CHART: NDR – S&P 500 Around First Fed Rate Hikes vs. Speed of Hikes
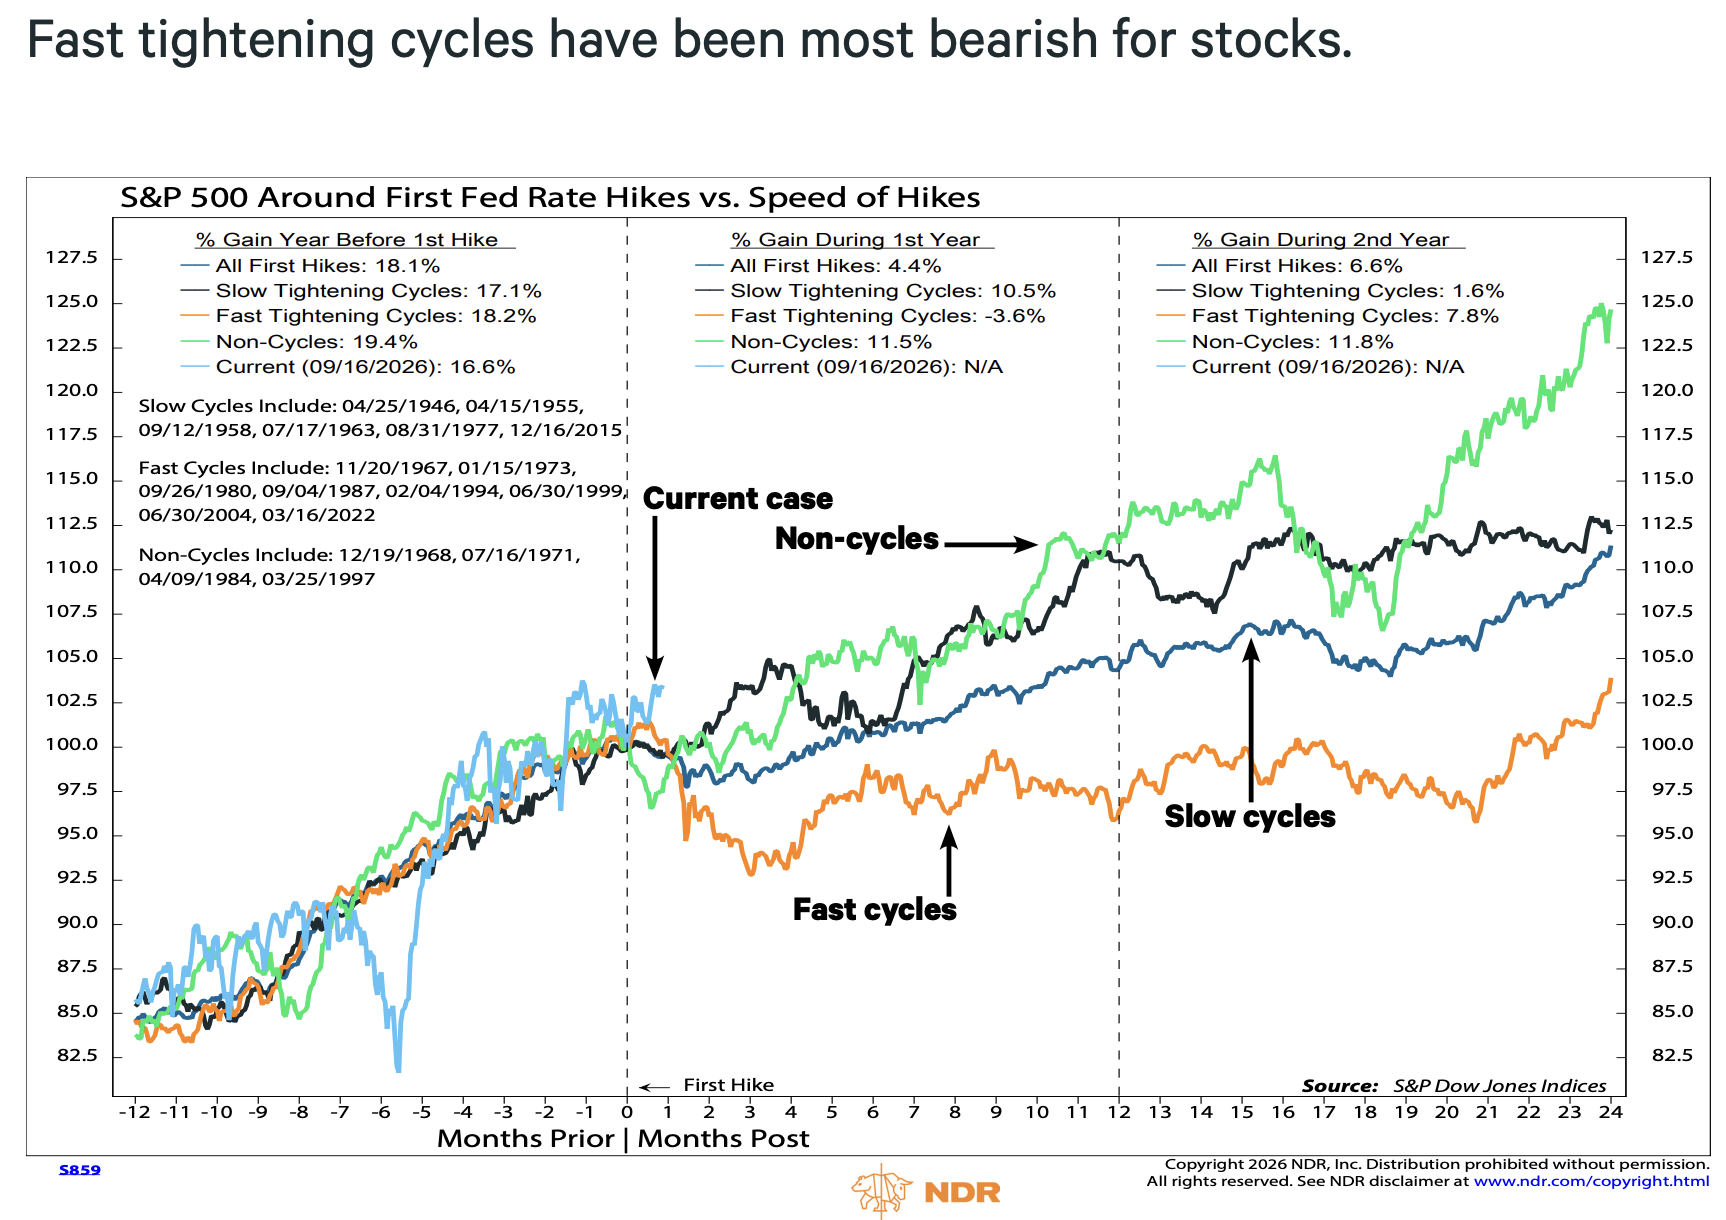
Source: Ned Davis Research, S&P Dow Jones Indices
Fast is bad. Slow is ok.
On September 16, the Fed raised rates by a quarter point to 3.75%–4.00%, its first hike since 2023, by a unanimous 12–0 vote. Most officials projected at least one more increase by year-end. The next meetings are October 27–28 (next week) and December 8–9.
This is why I find the chart interesting: NDR studied how the S&P 500 performed around every first rate hike since 1946. The year leading into this year was strong (up ~ 16.6%, close to the 18.1% historical average). Source data: NDR.
What happens next has depended almost entirely on the pace of the hikes:
Slow tightening cycles (e.g., 1955, 1963, 2015): +10.5% in the first year.
Fast tightening cycles (e.g., 1973, 1987, 1994, 2022): –3.6% in the first year.
So far, the current case (the light blue line) is holding up well. The question is whether this becomes a one-and-done or two-and-done cycle, or something faster. We’ll learn meeting by meeting. Lights on: Next week matters.
CHART: NDR – DJIA Real Performance vs. Presidential and Congressional Combinations
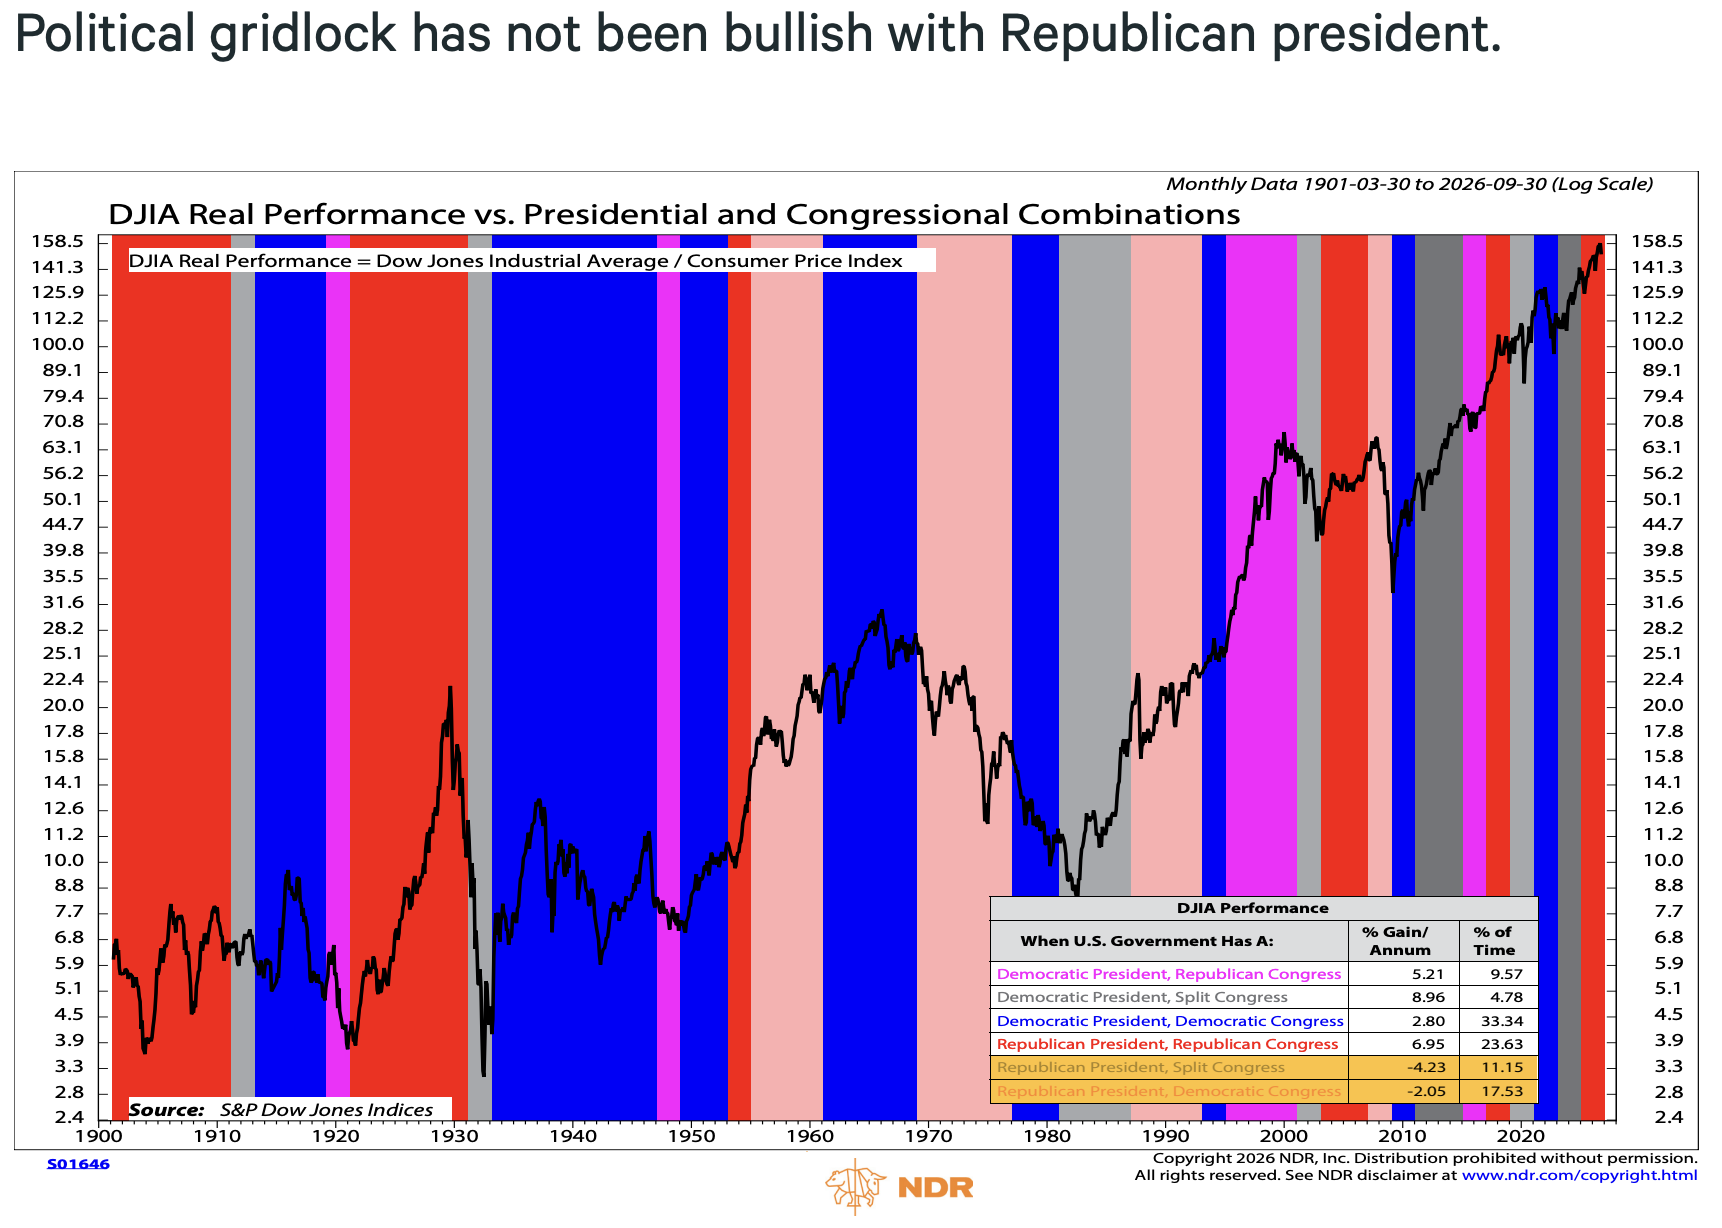
Source: Ned Davis Research, S&P Dow Jones Indices
With the midterm elections on November 3, the chart above runs counter to the conventional wisdom that “gridlock is good for markets.” Since 1901, adjusting for inflation, the Dow has performed as follows under a Republican president. Source NDR:
Republican Congress: +6.95% per year
Split Congress: –4.23% per year
Democratic Congress: –2.05% per year
By contrast, gridlock under a Democratic president (split Congress) has been the best combination at +8.96% per year.
A word of caution. These are small samples, and a few periods carry a lot of weight (the early 1930s and the inflationary 1970s). In my experience, the Fed, earnings, and valuations matter far more than who holds the gavel. Still, if the House changes hands, history says don’t assume gridlock is a tailwind. Please don’t shoot the messenger.
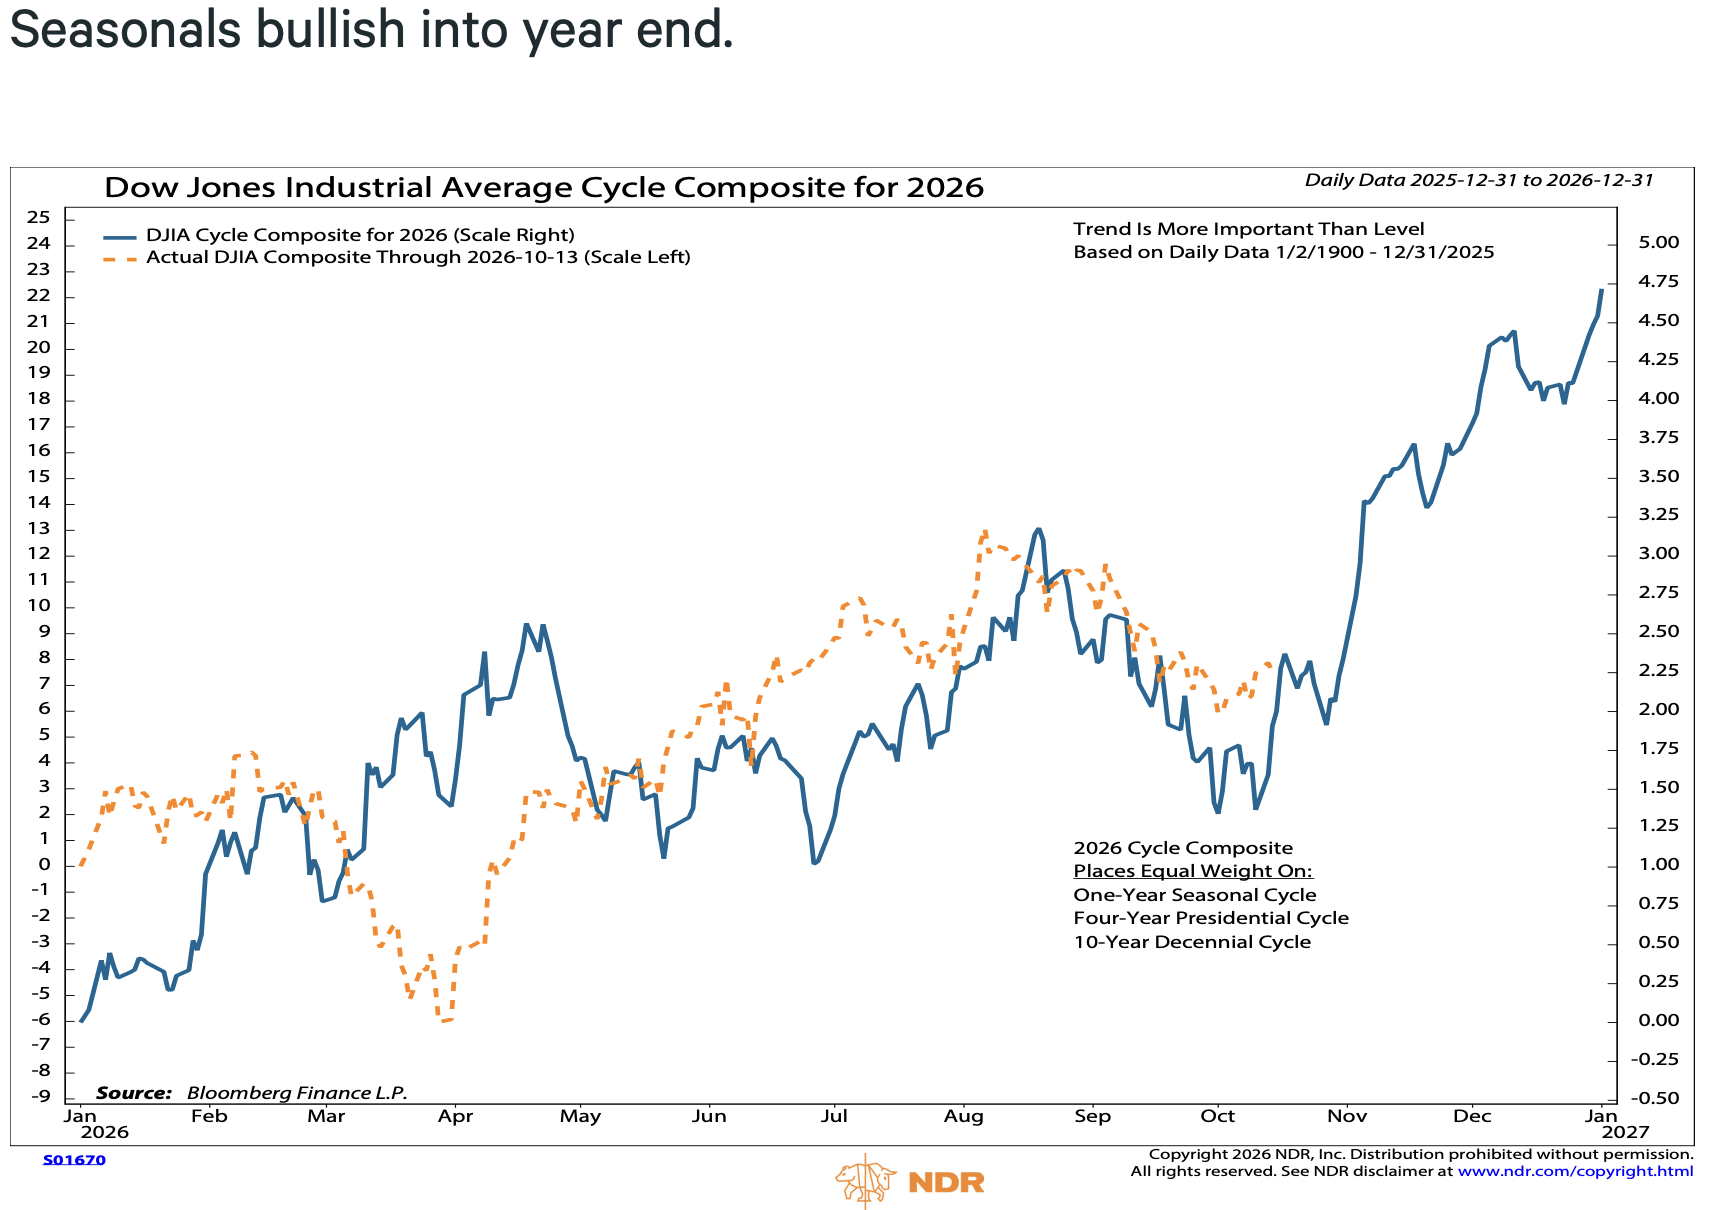
CHART: NDR – Dow Jones Industrial Average Cycle Composite for 2026
Source: Ned Davis Research, Bloomberg Finance L.P.
Now for the good news. NDR’s cycle composite blends three historical patterns: the one-year seasonal cycle, the four-year presidential cycle, and the ten-year decennial cycle. The solid blue line is what history suggests for 2026. The dotted orange line is what the Dow actually did through October 13 this year. Since August, the two have tracked each other closely.
The composite points higher from late October through year-end. The fourth quarter of a midterm year has historically been one of the strongest stretches of the four-year cycle. NDR reminds us that the trend matters more than the level.
Bottom line
Two things can be true at the same time. In the short run, seasonals are supportive, and the trend remains up. In the long run, the late-cycle checklist is nearly full: record leverage relative to the economy, record stock ownership, surging new supply, record concentration, thinning breadth, and a Fed that has just started tightening.
This is not a call to sell everything. Late-cycle markets can run longer and further than anyone expects. It is a call to manage risk: rebalance what has run, know your exit plan before you need it, and own some of what nobody else wants.
Opinions are subject to change. Not a recommendation to buy or sell any security. Provided for discussion and educational purposes only. Past performance is not indicative of future results.
Tax Mitigation Strategies for High-Net-Worth Investors
The U.S. tax code offers more than rules and restrictions. It also provides opportunities for investors to preserve wealth through strategic investment and tax planning.
If you find this of interest, in CMG’s newly updated white paper, Tax Mitigation Strategies for High-Net-Worth Investors, we explore how tax incentives designed to encourage investment in areas such as energy, small businesses, real estate, opportunity zones, equipment, and charitable giving can play a role in a broader wealth management strategy.
The paper offers a fresh perspective on moving beyond traditional tax preparation toward proactive planning, with a focus on wealth retention and long-term after-tax returns. Understanding these opportunities can be an important part of a comprehensive financial strategy. If you are interested in learning more, I invite you to complete a brief form to receive your copy and learn more about these tax mitigation opportunities. Please know your privacy is extremely important to us. Your information will not be shared. Click here or on the picture box that follows.
The Yen Carry Trade and Key Data Charts
I’m going to continue updating the charts in this section each week due to the critical importance of the Yen Carry Trade and the leverage currently in the markets.
Interest rates are the cost of money. Everything macro is tied to the cost of money. The match that lights the fuse to the global leverage problem is rising rates. We should all be on high alert.
Tracking the potential unwinding of the yen carry trade, here is the bottom line:
Across each of the key risk assets, we are seeing red flags. Signs risk is unwinding. Risk of a disruptive event is high.
Since we are at a critical point in terms of rising yields at a time of extreme system-wide leverage (the Yen Carry Trade, Government Debt, global developed market debt, and US margin debt), I’m going to update the following charts each week going forward as we may be near a critical inflection point.
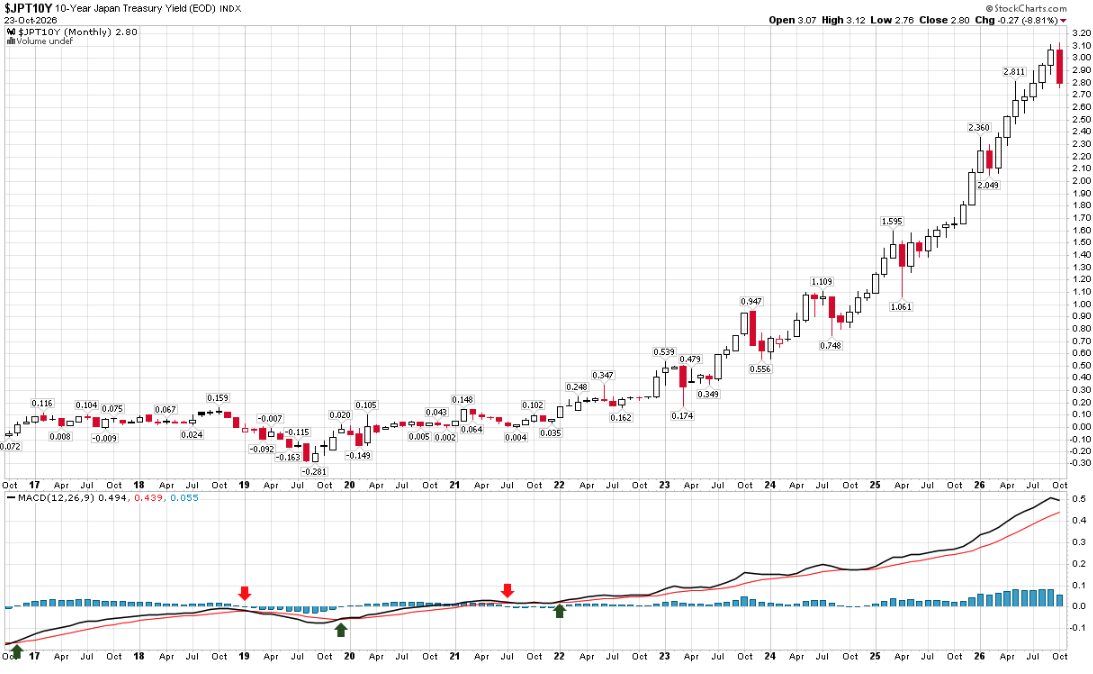
When viewing the MACD signals, keep the following in mind. For example, the Monthly MACD signals the dominant trend over the next 8 to 20 months from the signal date. Note: nothing is perfect in investing. The idea here is to understand what price activity (actual buyers and sellers) indicates.
The Daily (short-term) MACD Trend: ~ 8 days to 20 days
The Weekly (intermediate-term) MACD Trend: ~ 8 weeks to 20 weeks
The Monthly (long-term) MACD Trend: ~ 8 months to 20 months
Updated charts with brief notes follow:
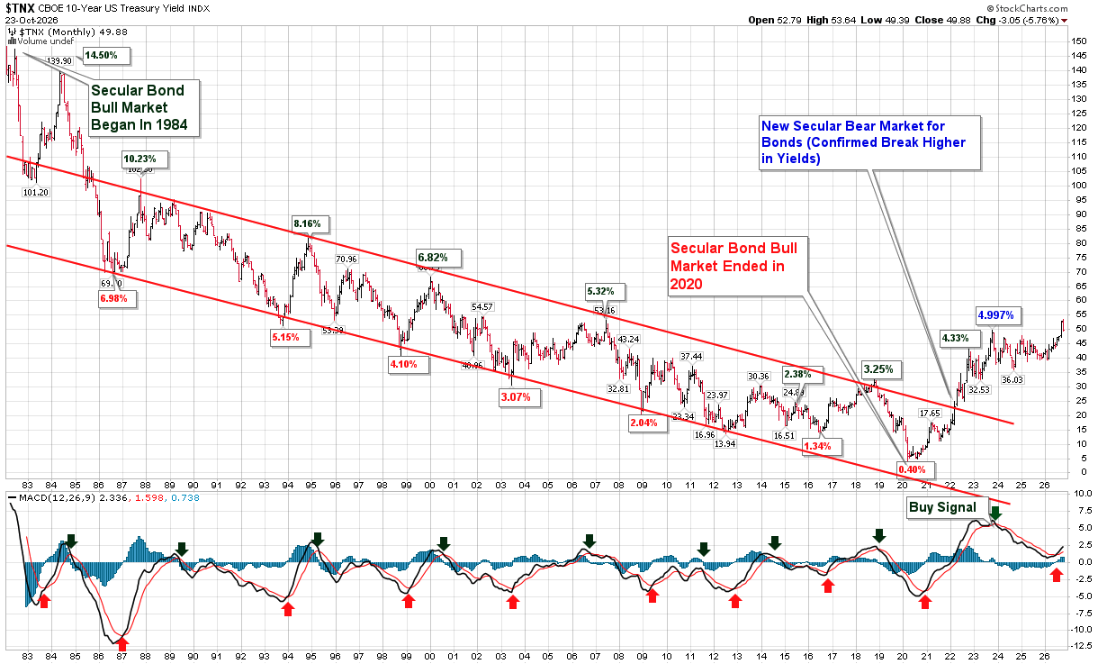
The 10-year Treasury - Monthly MACD
After peaking at 5.36% last week, the yield is at 4.99% at the time of this writing.
Source: StockCharts.com, CMG annotations (arrows)
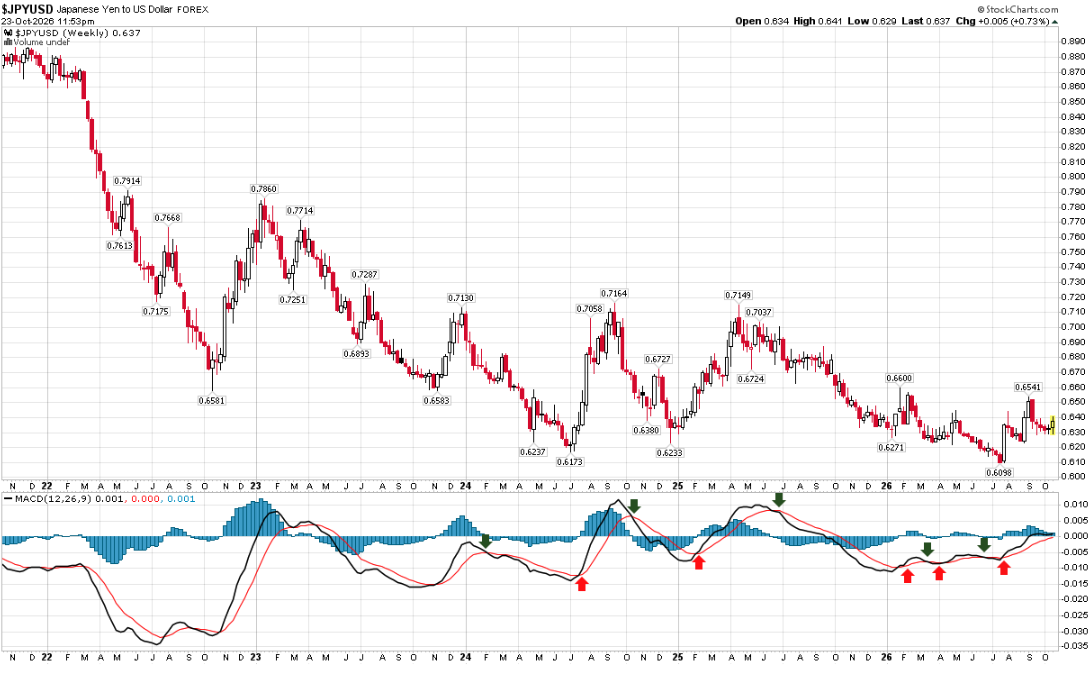
The Yen: Slight move higher this week
The Bank of Japan needs the yen to be higher to fight off inflation.
They would prefer not to raise their interest rates, which would increase the interest costs they pay on their debt and risk unwinding the leveraged yen carry trade (borrowing near 0% and investing in higher-yielding assets elsewhere).
When the borrow-for-free spread goes away, the leverage likely unwinds. That’s what risks forced selling across the system.
The current trend, as measured by the weekly MACD, points to a higher yen. A rising yen is bearish for global liquidty. A declining yen is bullish.
The Weekly MACD trend indicator is signaling a rising yen, and the rising price is bearish for global liquidity.
Source: StockCharts.com, CMG annotations
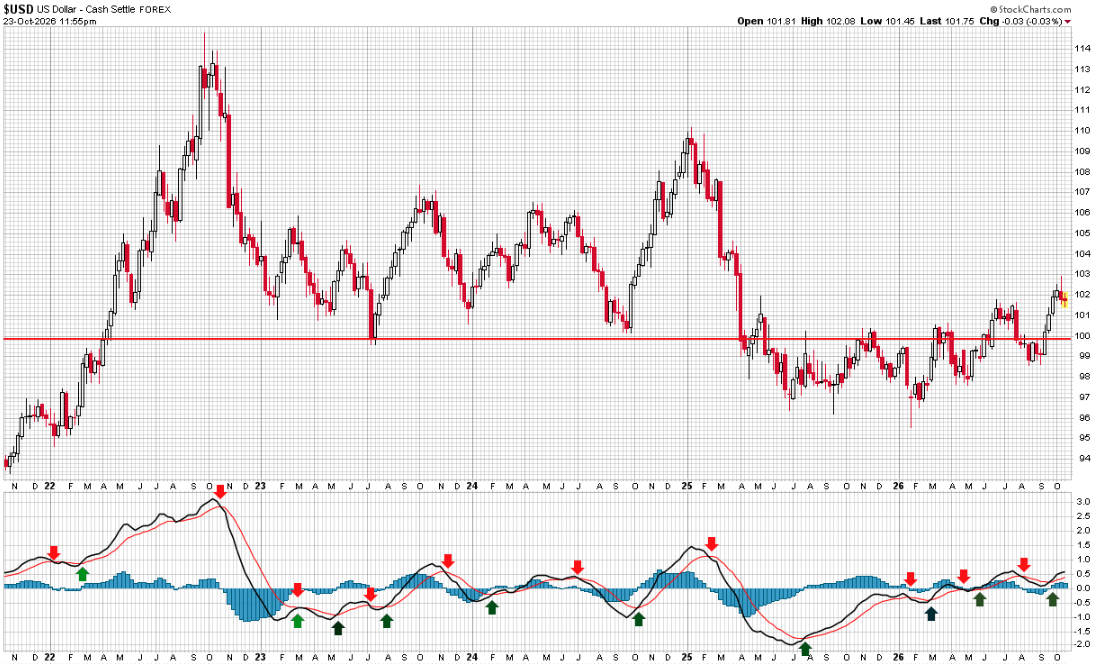
The Dollar: Lower Since Last Week, but Weekly MACD Price Trend is Up
Note the sharp price move higher over the last three weeks.
The Weekly MACD trend signal is pointing to a higher dollar.
Remember, we are looking at the yen vs. the dollar. So, a rising dollar relative to the yen is bullish for global liquidity. Lower risk of unwinding the yen carry trade.
Source: StockCharts.com, CMG Investment Research
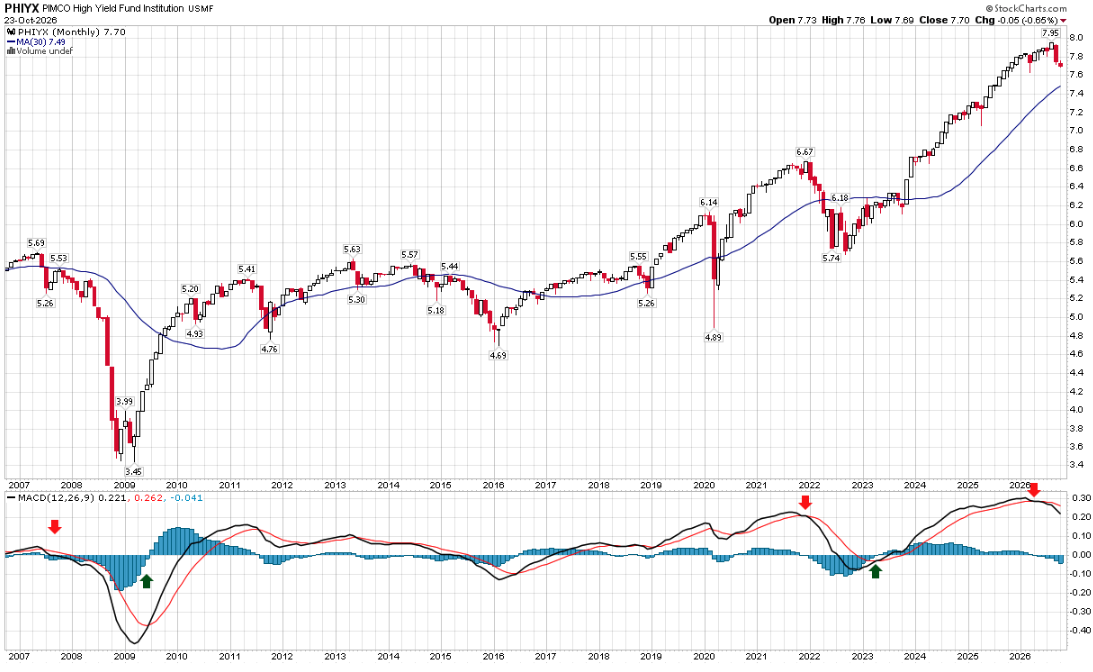
High-yield bonds - Monthly MACD Bear Trend Signal
Next is the “canary in the coal mine” indicator I’ve been using since 1992.
The long-term monthly MACD price trend remains bearish (the monthly MACD is the dominant long-term trend; the weekly is the intermediate-term trend).
The HY market tends to lead the equity market, which in turn leads the economy.
Bottom line: flashing yellow. Risk is increasing.
Source: StockCharts.com, CMG arrows
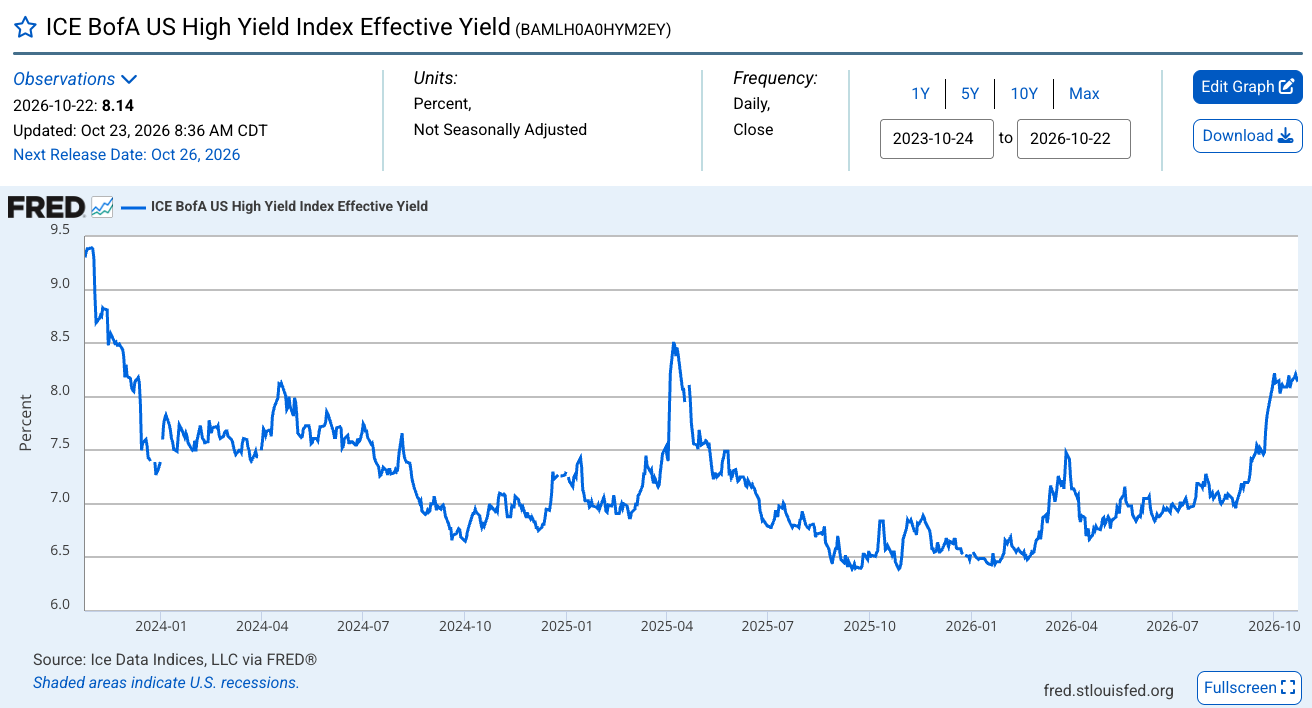
High-yield bond yields are higher. When prices decline, yields rise. Rising HY yields are a concern.
Source: FRED
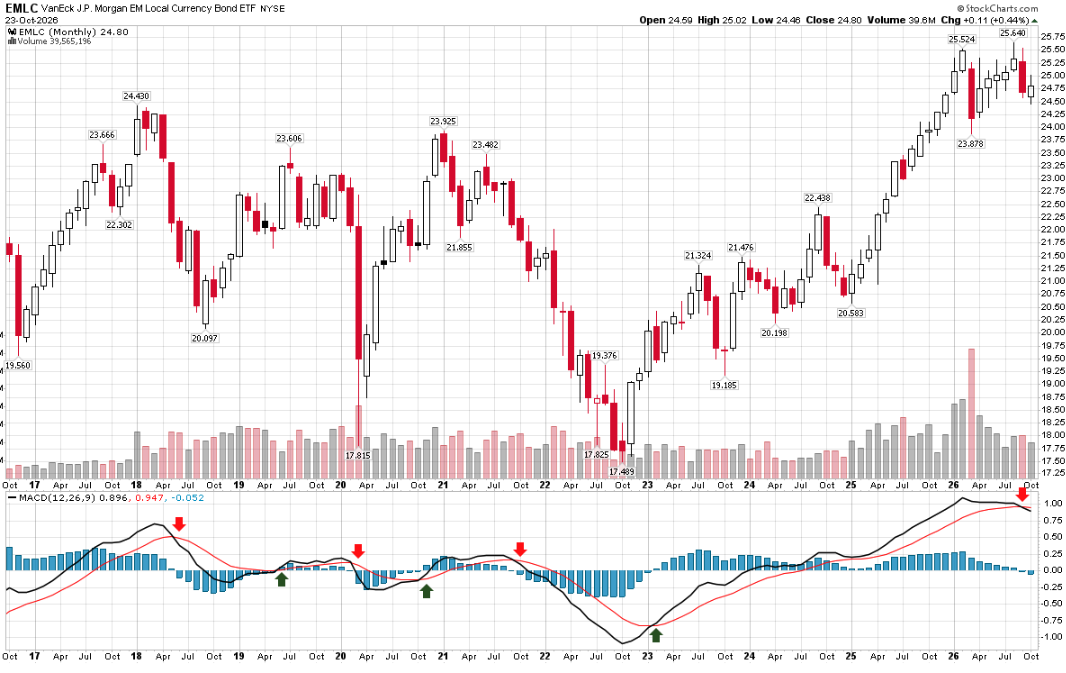
Emerging Market Local Currency Bond ETF - Monthly MACD Bear Trend Signal
Another signal to watch: EM debt, where some of the carry-trade leverage sits (borrow cheaply in yen, invest in higher-yielding EM bonds).
How to read the chart:
Calm and steady is good; a sharp price decline is a warning. Prices down mean yields are up.
The following is the Monthly MACD trend signal: a sell signal (downward price trend). This is the first signal since the buy trend signal in early 2023.
Bottom line: The Monthly MACD trend is down. This is another warning sign of the unwinding of the leveraged yen carry trade.
Source: StockCharts.com, CMG Investment Research
The Japan 10-year JGB yield - Monthly MACD Signaling Higher Yields (Bearish for global liquidity)
The current yield is 2.80%, down from the recent yield high of 3.12% earlier this month.
Higher JGB yields reduce the benefit of the yen carry trade.
Lower JGB yields are better, as they encourage borrowing at low yields and investing elsewhere at higher yields to capture the spread.
The Monthly MACD is signaling higher yields (bearish), while the trend over the last few weeks has been lower yields.
Bottom line: There has been a large move higher in Japanese yields over the last few years. Some counter-move lower is expected (red bar chart far upper right), but overall, this chart is flashing a yellow warning light.
Source: StockCharts.com
Opinions are subject to change. Not a recommendation to buy or sell any security. Provided for discussion and educational purposes only.
If you like what you are reading, click on the link and share it with a friend (it’s free).
CLICK HERE TO SUBSCRIBE TO ON MY RADAR
Trade Signals: October 22, 2026 Update
Market Commentary
Three things that mattered this week:
1. AI spending worries hit the leaders again. Meta fell about 7% after raising its AI spending forecast again and outlining new financing plans. Chip stocks dropped 6.7% in a single day, and the Nasdaq fell 2.6%, its worst day since June. Source: The Market Breakdown, citing Reuters.
Why it matters: A handful of AI names carry the S&P 500. When investors start asking what all that spending will return, and what it costs to finance, the index feels it more than the average stock does.
2. The rate-hike scare faded this week. The 10-year was near 5.36% last week. It closed below 5% on Thursday for the first time since late September. Futures now put the odds of a hike at next week’s Fed meeting (October 27–28) at about 7%, down from 28% a week ago. Source: Pomegra. Jobless claims fell to 194,000, the fewest in three months. Source: Yahoo Finance, StockCharts.com.
Why it matters: Lower yields take some pressure off stocks and borrowers. But one big day doesn’t make a trend, and inflation is still running well above the Fed’s target. I’m watching to see if this decline to the 5% area is a test of the recent breakout. Technically speaking, a test was expected.
Big picture: I see continued government deficits and money printing to support it. A move to above 6% remains a real risk.
3. Oil is back above $110. Brent crude jumped about 4% on Thursday to roughly $113, its highest level since May, on Middle East supply worries, including reported Houthi attacks on Saudi targets. Source: Reuters, via The Market Breakdown.
Why it matters: Expensive energy fuels inflation and slows growth. That is a hard mix for the Fed.
What did the signals say this week? Click through if you are a subscriber.
Trade Signals is free for CMG clients and a paid subscription service for others. Selfishly, I write it for myself each week, and have for years, with the goal of staying disciplined in the markets.
Trade Signals
The Indicators Dashboard - Stocks, Investor Sentiment, Bonds, Commodities, Currencies, and Gold
Valuations and Subsequent 10-year Returns
Supporting Charts with Explanations

TRADE SIGNALS SUBSCRIPTION ACKNOWLEDGEMENT / IMPORTANT DISCLOSURES
About Trade Signals - Trade Signals is a paid subscription service that posts daily, weekly, and monthly market trends (and more). Free for CMG clients. Not a recommendation to buy or sell any security. For discussion purposes only.
The views expressed herein are solely those of Steve Blumenthal as of the date of this report and are subject to change without notice. Please note that the information provided is not recommended for buying or selling any security and is provided for discussion purposes only.
Personal Note: Sunny Days
We said goodbye to our Aunt Sunny this week. She was 88 and cherished her grandnieces and grandnephews. A stroke forced her to retire from teaching kindergarten at 58, and she spent the next 30 years dealing with what it left her. I never once heard her complain.
She was smart, kind, and generous with her thoughts. She was a teacher who never stopped teaching. I’ll miss her quick wit and that smile. And if she pushed a few buttons, she’d always flash a fun twinkle in her eyes. Her name fit her perfectly.
Sunny’s celebration-of-life service ended mid-afternoon. I said goodbye to family and friends, and I raced over to Malvern Prep for the Friars’ home game against first-place Episcopal Academy. Tied at one apiece at half-time, Coach Sue’s Friars went on to win 3–1.
Two entirely different celebrations. One to honor and say goodbye; one to celebrate an important win together. There were no clouds in the sky on this beautiful, crisp fall day - Sunny days, indeed.
Post-game, the boys cranked up the music in the locker room and started dancing. It was pure joy. We should all have moments when we feel this happy.

2026 Malvern Prep Friars’
At dinner, Susan and I talked about the game, who shined, who led, who grew. We poured a glass (ok two) of a Pine & Brown cab and paired it with mushroom pizza… and oh boy, did it taste good. A happy day.
Sorry for the delay in the post. I’ll be rereading with you Saturday morning with coffee in hand.
Boston is up next - Wednesday/Thursday at the Schwab Conference. Florida follows in early November. And only two regular season soccer games to go.
Best of luck to your young ones on the fields this weekend.
Wishing you a joy-filled weekend!
Kind regards,
Steve
CLICK HERE TO SUBSCRIBE TO ON MY RADAR - IT’S FREE
You can share this letter on X by clicking here.
You can share this letter on LinkedIn by clicking here.
Subscribe to OMR for free by clicking the photo.
Stephen B. Blumenthal
Founder and CEO
CMG Capital Management Group, Inc.
75 Valley Stream Parkway, Suite 201
Malvern, PA 19355
CMG Customer Relationship Summary (Form CRS)
Metric-Financial, LLC Customer Relationship Summary (Form CRS)

Stephen Blumenthal founded CMG Capital Management Group in 1992 and serves today as its CEO. Steve authors a free weekly e-letter entitled, “On My Radar.” Steve shares his views on macroeconomic research, valuations, portfolio construction, asset allocation and risk management. Author of Forbes Book: On My Radar, Navigating Stock Market Cycles.
Follow Steve on X @SBlumenthalCMG and LinkedIn.
IMPORTANT DISCLOSURE INFORMATION
This document is prepared by CMG Capital Management Group, Inc. (“CMG”) and is circulated for informational and educational purposes only. There is no consideration given to the specific investment needs, objectives, or tolerances of any of the recipients. Additionally, CMG’s actual investment positions may, and often will, vary from its conclusions discussed herein based on any number of factors, such as client investment restrictions, portfolio rebalancing, and transaction costs, among others. Recipients should consult their own advisors, including tax advisors, before making any investment decision. This material is for informational and educational purposes only and is not an offer to sell or the solicitation of an offer to buy the securities or other instruments mentioned. This material does not constitute a personal recommendation or take into account the particular investment objectives, financial situations, or needs of individual investors which are necessary considerations before making any investment decision. Investors should consider whether any advice or recommendation in this research is suitable for their particular circumstances and, where appropriate, seek professional advice, including legal, tax, accounting, investment, or other advice. The views expressed herein are solely those of Steve Blumenthal as of the date of this report and are subject to change without notice.
Investing involves risk.
This letter may contain forward-looking statements relating to the objectives, opportunities, and future performance of the various investment markets, indices, and investments. Forward-looking statements may be identified by the use of such words as; “believe,” anticipate,” “planned,” “potential,” and other similar terms. Examples of forward-looking statements include, but are not limited to, estimates with respect to financial condition, results of operations, and success or lack of success of any particular market, index, investment, or investment strategy. All are subject to various factors, including, but not limited to, general and local economic conditions, changing levels of competition within certain industries and markets, changes in legislation or regulation, Federal Reserve policy, and other economic, competitive, governmental, regulatory, and technological factors affecting markets, indices, investments, investment strategy and portfolio positioning that could cause actual results to differ materially from projected results. Such statements are forward-looking in nature and involve a number of known and unknown risks, uncertainties, and other factors, and accordingly, actual results may differ materially from those reflected or contemplated in such forward-looking statements. Investors are cautioned not to place undue reliance on any forward-looking statements or examples. All statements made herein speak only as of the date that they were made. Investing is inherently risky and all investing involves the potential risk of loss.
Past performance does not guarantee or indicate future results. Different types of investments involve varying degrees of risk, and there can be no assurance that the future performance of any specific investment, investment strategy, or product (including the investments and/or investment strategies recommended or undertaken by CMG), or any non-investment related content, made reference to directly or indirectly in this commentary will be profitable, equal any corresponding indicated historical performance level(s), be suitable for your portfolio or individual situation or prove successful. Due to various factors, including changing market conditions and/or applicable laws, the content may no longer be reflective of current opinions or positions. Moreover, you should not assume that any discussion or information contained in this commentary serves as the receipt of, or as a substitute for, personalized investment advice from CMG. Please remember to contact CMG, in writing, if there are any changes in your personal/financial situation or investment objectives for the purpose of reviewing/evaluating/revising our previous recommendations and/or services, or if you would like to impose, add, or to modify any reasonable restrictions to our investment advisory services. Unless, and until, you notify us, in writing, to the contrary, we shall continue to provide services as we do currently. CMG is neither a law firm, nor a certified public accounting firm, and no portion of the commentary content should be construed as legal or accounting advice.
No portion of the content should be construed as an offer or solicitation for the purchase or sale of any security. References to specific securities, investment programs or funds are for illustrative purposes only and are not intended to be, and should not be interpreted as recommendations to purchase or sell such securities.
This presentation does not discuss, directly or indirectly, the amount of the profits or losses realized or unrealized, by any CMG client from any specific funds or securities. Please note: In the event that CMG references performance results for an actual CMG portfolio, the results are reported net of advisory fees and inclusive of dividends. The performance referenced is that as determined and/or provided directly by the referenced funds and/or publishers, has not been independently verified, and does not reflect the performance of any specific CMG client. CMG clients may have experienced materially different performance based upon various factors during the corresponding time periods. See in links provided citing limitations of hypothetical back-tested information. Past performance cannot predict or guarantee future performance. Not a recommendation to buy or sell. Please talk to your advisor.
Information herein has been obtained from sources believed to be reliable, but we do not warrant its accuracy. This document is general communication and is provided for informational and/or educational purposes only. None of the content should be viewed as a suggestion that you take or refrain from taking any action nor as a recommendation for any specific investment product, strategy, or other such purposes.
In a rising interest rate environment, the value of fixed-income securities generally declines, and conversely, in a falling interest rate environment, the value of fixed-income securities generally increases. High-yield securities may be subject to heightened market, interest rate, or credit risk and should not be purchased solely because of the stated yield. Ratings are measured on a scale that ranges from AAA or Aaa (highest) to D or C (lowest). Investment-grade investments are those rated from highest down to BBB- or Baa3.
NOT FDIC INSURED. MAY LOSE VALUE. NO BANK GUARANTEE.
Certain information contained herein has been obtained from third-party sources believed to be reliable, but we cannot guarantee its accuracy or completeness.
In the event that there has been a change in an individual’s investment objective or financial situation, he/she is encouraged to consult with his/her investment professional.
Written Disclosure Statement. CMG is an SEC-registered investment adviser located in Malvern, Pennsylvania. Stephen B. Blumenthal is CMG’s founder and CEO. Please note: The above views are those of CMG and its CEO, Stephen Blumenthal, and do not reflect those of any sub-advisor that CMG may engage to manage any CMG strategy, or exclusively determines any internal strategy employed by CMG. A copy of CMG’s current written disclosure statement discussing advisory services and fees is available upon request or via CMG’s internet web site at www.cmgwealth.com/disclosures. CMG is committed to protecting your personal information. Click here to review CMG’s privacy policies.
See CMG Disclosures at the bottom of this page.
For more information about NDR, please visit at www.ndr.com.
NDR, Inc. (NDR), d.b.a. Ned Davis Research Group (NDRG), any NDRG affiliates or employees, or any third-party data provider, shall not have any liability for any loss sustained by anyone who has relied on the information contained in any NDRG publication. The data and analysis contained herein are provided "as is." NDRG disclaims any and all express or implied warranties, including, but not limited to, any warranties of merchantability, suitability or fitness for a particular purpose or use. NDRG's past recommendations and model results are not a guarantee of future results. This communication reflects our analysts' opinions as of the date of this communication and will not necessarily be updated as views or information change. All opinions expressed herein are subject to change without notice. NDRG or its affiliated companies or their respective shareholders, directors, officers and/or employees, may have long or short positions in the securities discussed herein and may purchase or sell such securities without notice. For NDRG's important additional disclaimers, refer to www.ndr.com/invest/public/copyright.html. Further distribution prohibited without prior permission. Copyright 2025 © NDR, Inc. All rights reserved.
The opinions are mine. Please know that there are no guarantees the above will prove correct, and that views are subject to change. See essential disclosures further below.