October 16, 2026
By Steve Blumenthal
“All great technology changes produce bubbles… pricking is the converting of wealth into money.”
– Ray Dalio (Bloomberg, June 2026)
I’m sure you remember the story about the canary in the coal mine. For most of the last century, coal miners carried a small yellow bird down into the shafts. The idea is credited to John Scott Haldane, a Scottish physiologist. Canaries breathe faster than we do and are far more sensitive to carbon monoxide. When the bird stopped singing, the miners knew they had a few precious minutes to get out before the bad air got to them. British mines didn’t fully retire the canary until 1986.
I thought about that canary a lot this week. Two things happened that I believe matter for the big picture. First, inflation came in hot again, and it’s hotter beneath the surface than the headline suggests. Second, CoreWeave, one of the poster children of the AI build-out, had one of its worst days as a public company, and its bonds slid into distressed territory. Neither event, on its own, tells us that the mine is collapsing. But both are birds that have gone quiet.
Grab your coffee and find your favorite chair. This week, we’ll take a look at two canaries that have stopped singing. Feel free to skim the inflation section (unless you want to nerd out). You already feel the pain at the pump and grocery store. The CoreWeave section is the one I most want you to read. CoreWeave reminds me so much of the Bear Stearns mortgage hedge funds that blew up in 2007 (canary). The AI industry is throwing trillions of dollars (mostly debt-financed) into data center build-out, and it just feels to me like we are creating too much excess capacity. CoreWeave bond yields have blown out, now yielding north of 15%. The bondholders are sending a message. They are the first to act. Equities tend to follow. You’ll also find the updated equity market valuation charts and what they suggest about returns over the next ten years. Read a section, stop, reheat, and power on.
On My Radar: The Canary in the Data Center
Inflation: CPI Was Hot. PPI Was Hotter.
CoreWeave: The First Real Crack in the AI Bubble
Equity Markets and Valuations
The Yen Carry Trade and Key Data Charts
Trade Signals: October 15, 2026
Personal Note: Homecoming, Boston and Florida
OMR is for informational and educational purposes only. No consideration is given to your specific investment needs, objectives, or tolerances.
Please see the Important Disclosures at the bottom of this page. Reminder: This is not a recommendation to buy or sell any security. My views may change at any time. The information is for discussion and educational purposes only.
If you like what you are reading, you can subscribe for free.

Inflation: CPI Was Hot. PPI Was Hotter.
Wednesday’s CPI made the headlines. Consumer prices rose 0.6% in September and 3.7% over the past year, up from 3.4% in August and above the 3.6% economists expected. Gasoline did much of the heavy lifting. It was up 9.1% in the month and 34.2% from a year ago, accounting for more than half of the monthly increase. Core CPI, which excludes food and energy, rose 0.3% and is up 2.6% year over year.
Thursday’s Producer Price Index (PPI) is the number I want you to focus on. PPI measures what businesses pay. It’s the cost side of the economy before it shows up at the checkout counter.
Headline PPI jumped 1.3% in September. That’s more than double the 0.6% forecast and the largest one-month increase since March 2022, right after Russia’s invasion of Ukraine sent energy and food prices soaring. August was revised up to 0.5%.
Over the past year, PPI is up 6.3%. That’s the fastest pace since December 2022 and well above the 5.4% consensus.
Core PPI (excluding food and energy) rose 0.7% versus the 0.3% forecast. Measured excluding food, energy, and trade services, it’s up 5.0% over the past year. Source provided below.
Put simply, producer inflation is running about 2.5 percentage points above consumer inflation, on both the headline and core measures. I’ll say something I don’t think it gets enough attention: CPI doesn't tell the full story. Businesses are absorbing cost increases they haven’t yet passed along, and in many cases they can’t. H/t to my friend Peter Boockvar.
Inflation is sounding extra sticky to me.
Where is the immediate inflation coming from? Energy, first and foremost, and, of course, deficit spending and the ongoing money printing to finance it. Energy prices rose 10.8% in the month, and gasoline prices rose 20.3%. Diesel rose 21.0% and is now up roughly 115% from a year ago, having climbed nearly 50% in August and September combined.
Diesel is in everything! It moves food from the farm, lumber to the job site, and goods to the shelf. When diesel doubles, everything that rides in a truck costs more.
Truck freight prices jumped 3.8% in September and are up a striking 19.3% over the past 12 months. Final demand goods prices rose 2.6%, the largest increase since the series began in 2009. Sources below.
It isn’t only energy. Stripping energy out, PPI still rose 0.7% in the month and 4.7% over the year. And the pipeline is full. Crude petroleum rose 28.3%, and unprocessed intermediate goods rose 8.4%. Those costs take months to work through supply chains, even if oil prices settle down. Sources below.
This is the part that concerns me most: businesses are eating the cost. Gasoline prices rose 20.3%, yet fuel retailers' margins fell 30.3%. More revenue, less profit. Builders' energy costs jumped 18.5% while the prices they charge stayed flat. And roughly 71% of September's retail sales gain came from gas stations. Paying more for gas doesn't mean the consumer is strong. Sources: BLS — Producer Price Index, September 2026 (October 15 release), BLS - CPI, September 2026, CBS, TradingKey.
Bottom line: This is a supply shock running into a late-cycle economy. The Fed raised rates in September for the first time since 2023, to 3.75%–4.00%, and signaled another hike may come this year. Perhaps as early as this month, given this week’s CPI and PPI prints.
The Fed can cool demand. It can’t reopen shipping lanes or add refining capacity. This looks more like the energy shocks of the 1970s and the 2007 oil squeeze than an economy running hot. My concern is that inflation eventually comes down not because things have gotten better, but because businesses cut production, investment, and jobs. It’s something we have to keep our eye on. In a word, recession.
Here’s a big twist. With inflation this hot, you’d expect bond yields to rise. The 10-year Treasury touched 5.33% prior to the CPI report. Then it reversed. On Thursday, it fell roughly 10 basis points, its biggest one-day drop since August 2025, to about 5.09%, where it sits as I write. TD Securities’ Prashant Newnaha called the rally “highly counter-intuitive.” I think the explanation is a flight to safety. Source
Technically, I expected a return to the 5% level to test the important breakout above 5%. That has now occurred. My betting mind believes we hold above 5%, and my fundamental mind believes we are on our way to 6%. We’ll see.
Let’s now turn to the second canary, CoreWeave. You may need a second coffee for this one.
CoreWeave: The First Real Crack in the AI Bubble?
If you haven’t followed it, CoreWeave is part of a group of companies sometimes called “neoclouds.” It buys Nvidia chips by the warehouse-load and rents out the computing power to AI companies. Think of it as a landlord in the AI boom that built its buildings largely with borrowed money.
Here’s how the past week unfolded:
October 8: A report showed OpenAI’s annualized revenue reached about $50 billion at the end of September, some $20 billion below figures discussed only weeks earlier. The Nasdaq fell 1.4%, the semiconductor index dropped 3.4%, and the DRAM index fell 5.1%. Treasury yields fell as money moved into bonds.
Wednesday, October 14: CoreWeave shares fell more than 15%, the steepest one-day decline in the company’s history (per @GlobalMktObserv). Its bonds due 2032 fell below 80 cents on the dollar, yielding about 15%.
Thursday, October 15: The shares slid again in early trading. Yields on CoreWeave’s 2031 bonds rose above 16%, and the credit default swap market priced in roughly a 63% chance of default within five years, up from about 30% a year ago. Rival neoclouds Nebius, Applied Digital and Iren fell 3% to 5%.
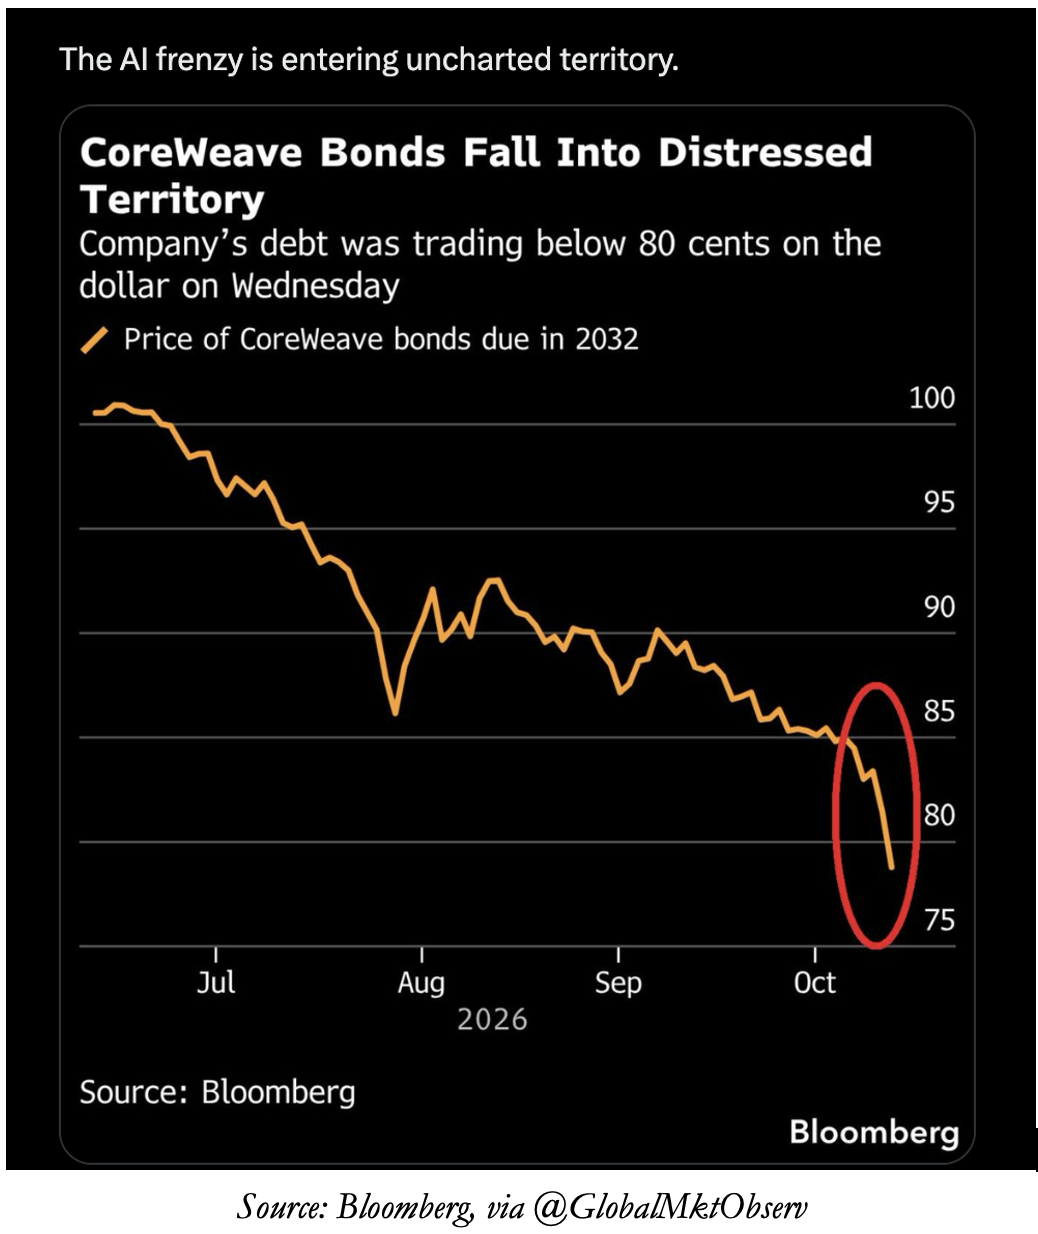
Now look at the math. CoreWeave carries roughly $50 billion in debt. It has guided to $35–$39 billion of capital spending this year, against expected revenue of about $13 billion and an expected loss of around $2.1 billion. That means it’s spending roughly three dollars for every dollar it brings in, and borrowing much of the difference when the risk-free rate is above 5%. Its CEO told employees in a memo that markets can sometimes “misunderstand and act irrationally.” Maybe. But Gartner’s Will Sommer put the bigger question plainly: “our research indicates enterprise and consumer AI revenue will be insufficient to support profitable returns” on planned AI spending.
Let me be fair here. AI is real, and so is the productivity it will bring. But bubbles almost always form around something real. Railroads were real. The internet was real. The question is never whether the technology works. It’s whether the price paid, and the debt used to pay it, can be earned back.
That’s why the Dalio quote at the top caught my attention. Speaking in Singapore on October 7, he said we’re in the part of the cycle “approaching” the point where the AI bubble bursts, and he explained why: “everybody says ‘I’m worth a billion dollars’ but ok, try to spend that.” To spend it, you have to sell, and that’s when bubbles pop. Look at what the CoreWeave bond market is doing. Lenders want cash, not promises. That’s wealth being converted into money.
Paul Tudor Jones added to the chorus on CNBC on Tuesday. He said “2027 is going to be really, really challenging for the stock market,” and pointed to a wave of new stock supply from IPOs (SpaceX is done, and OpenAI and Anthropic are expected) as “the most negative flow picture for the U.S. stock market that we’ve had, say, since 2002.” He compared today to 1999, yet he still sees room for a rally into year-end. More on PTJ below.
Regular readers know I’ve been on this theme for a while: the “four o’s” of overvalued, overconcentrated, overowned, and overleveraged (see Look Up, June 2026), and record margin debt (see Rising Tide, July 3, 2026). CoreWeave is the overleveraged “o” showing up in real time in the credit market, where problems usually surface first.
Bottom line: I’m not calling the top. When Bear Stearns' two mortgage hedge funds blew up in the summer of 2007, the stock market didn't peak until that October. The canary died months before the miners felt it. Ray Dalio says we're approaching the point where the bubble pops. Paul Tudor Jones was on CNBC this week, and he believes 2027 is the year. Howard Marks is telling us there are too few winning tickets in the fish bowl.
This week, two canaries stopped chirping: hot producer prices and CoreWeave's bonds. What I'm watching next:
Credit spreads across AI infrastructure and the hyperscalers’ spending plans when they report earnings over the next few weeks, and
whether the 10-year keeps acting as a safe haven or moves higher again chasing inflation.
Good friend CJ Brown, a hedge fund money manager/credit specialist, sent me a note yesterday. With his permission, I am sharing his LinkedIn post with you. Put your geek goggles on - he’s super smart.
In his post, CJ reflects back on his days at Bear Stearns, where he had a front-row seat to the 2007/08 canary that first chirped, then died. I believe the credit guys are always one step ahead of the equity guys.
CJ does some comparative analysis and concludes, “Sometimes the most interesting insights about equities come from watching the bond market.” The bond market suggests CoreWeave’s share price should be materially lower.
You can find his full post by clicking on the image:
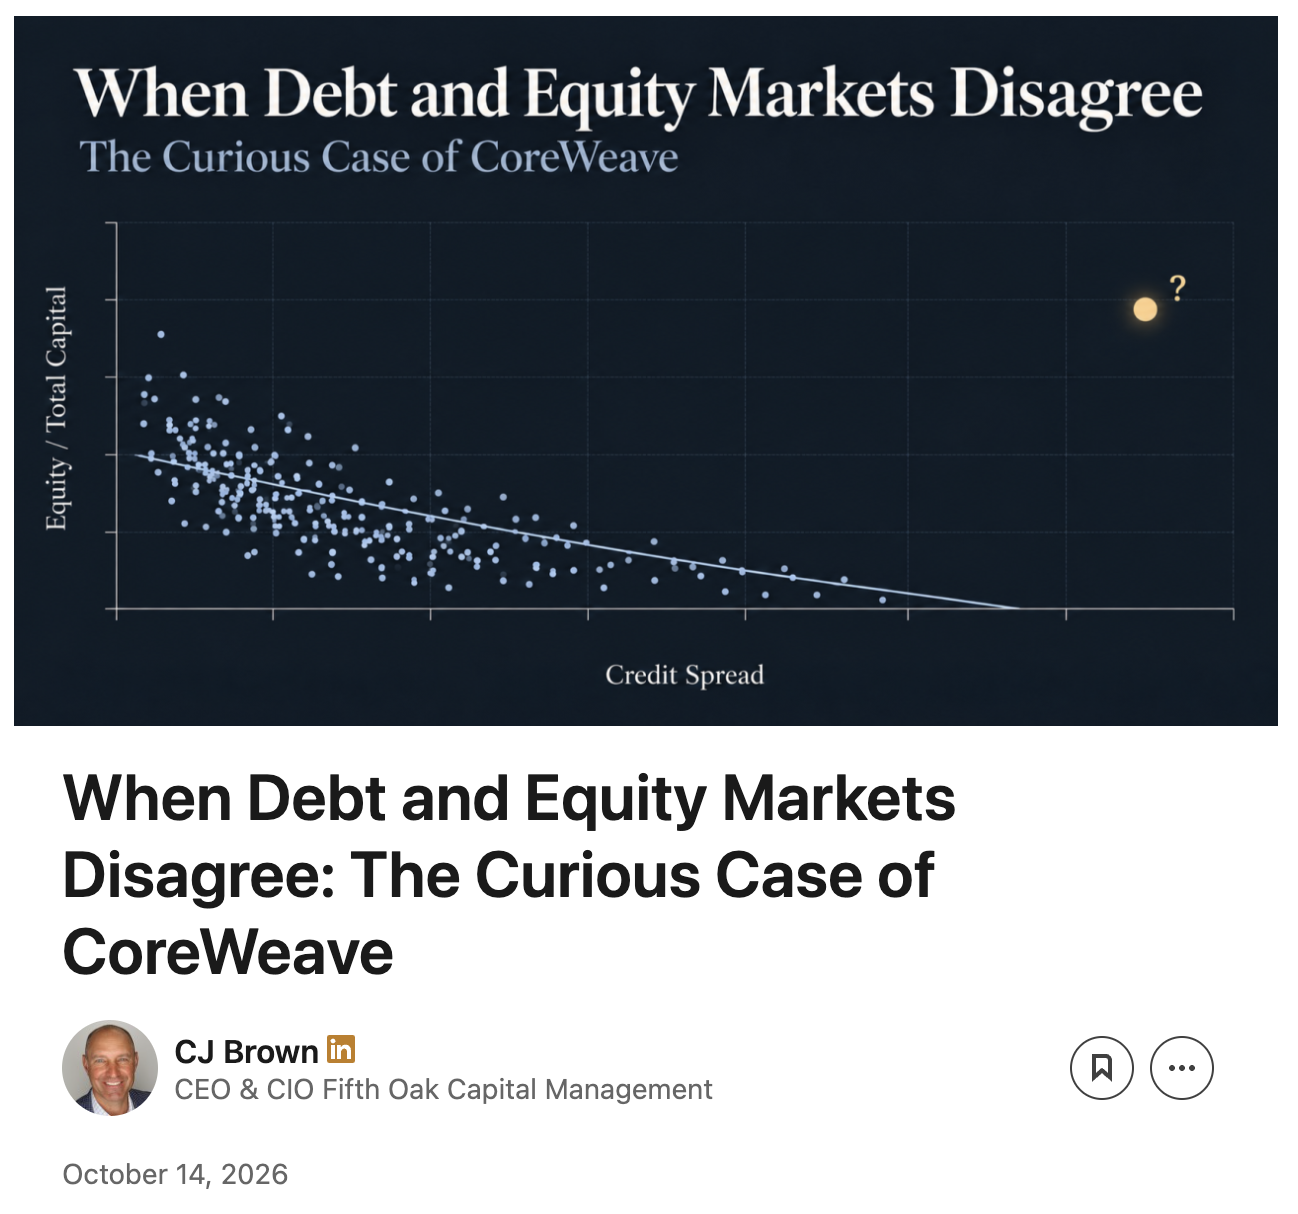
Source: LinkedIn, CJ Brown
Late afternoon today, I received the following from CJ: “This is the tricky part, though. NVDA owns 10.29% of the company and has a tremendous incentive to keep one of its biggest customers succeeding. I think they are about 5%-7% of NVDA's revenues. So, it will be hard to see the company fail with such a strong backer. It just seems like bondholders are valuing the company in a downside scenario because they don't get as much upside but could get a goose egg in a downside scenario. The equity values it as a tremendously valuable option, with backing from NVDA.” That makes a lot of sense to me.
Who said investing was easy?
Hot inflation, 5+% yields, and a debt-funded boom are an unpleasant mix. Keep that seat belt buckled!
Opinions are subject to change. Not a recommendation to buy or sell any security. Provided for discussion and educational purposes only. Past performance is not indicative of future results.
Equity Markets and Valuations
First, a few posts to set the footing on the extent of the current decline - various sectors:
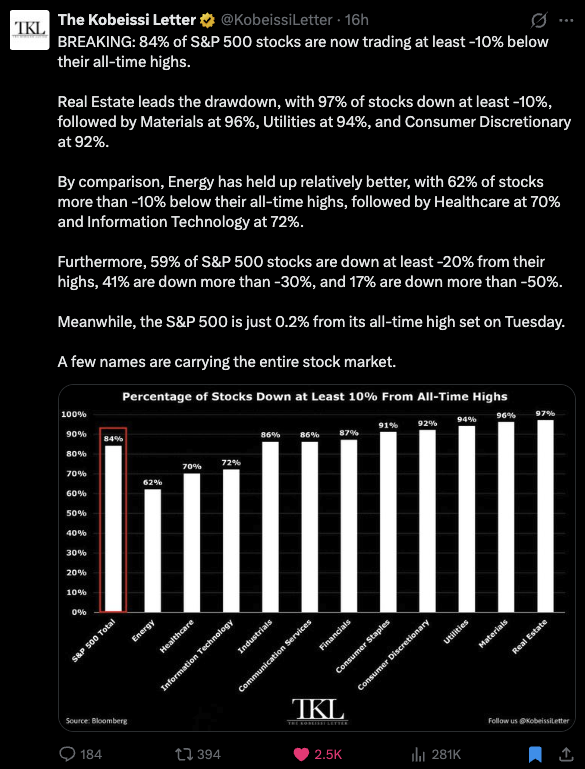
Source: @KobeissiLetter, Bloomberg
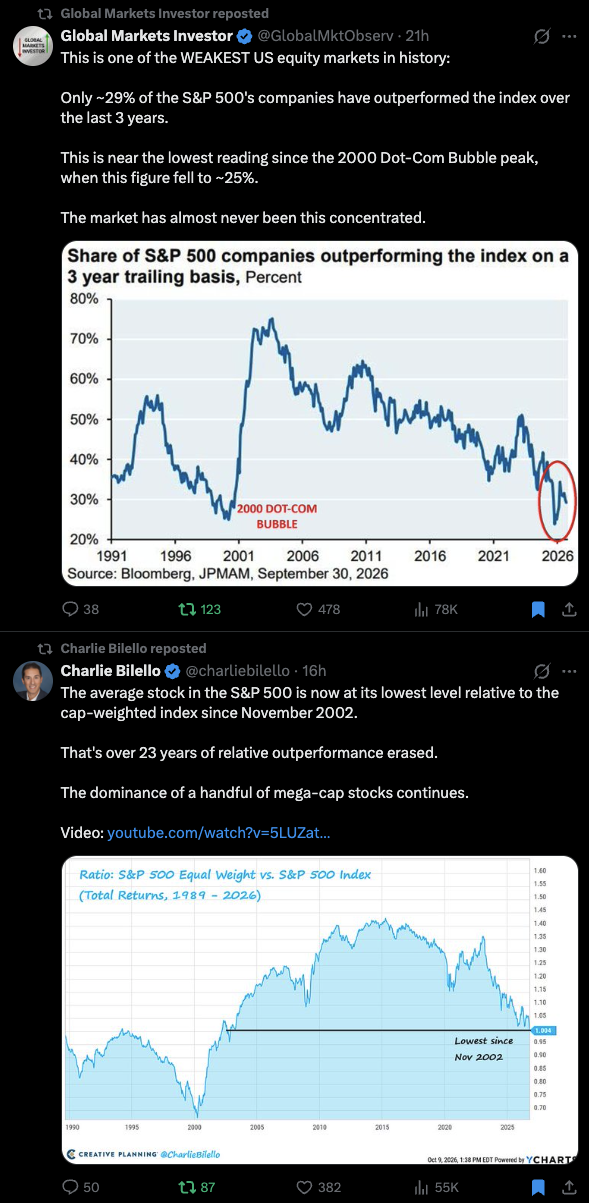
Sources: @GlobalMktObserv, @charliebilello
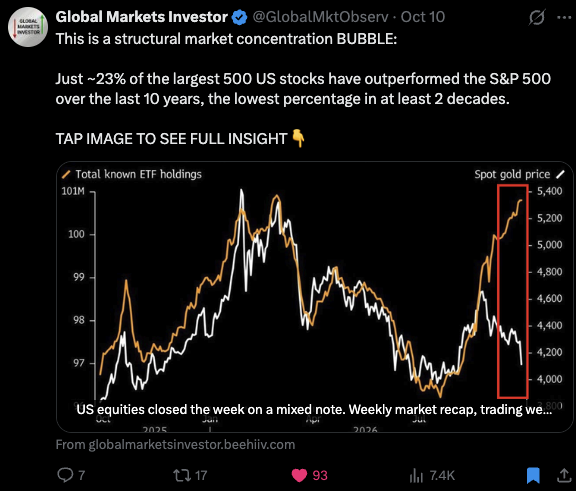
@GlobalMktObserv
Next are a few of my favorite valuation charts:
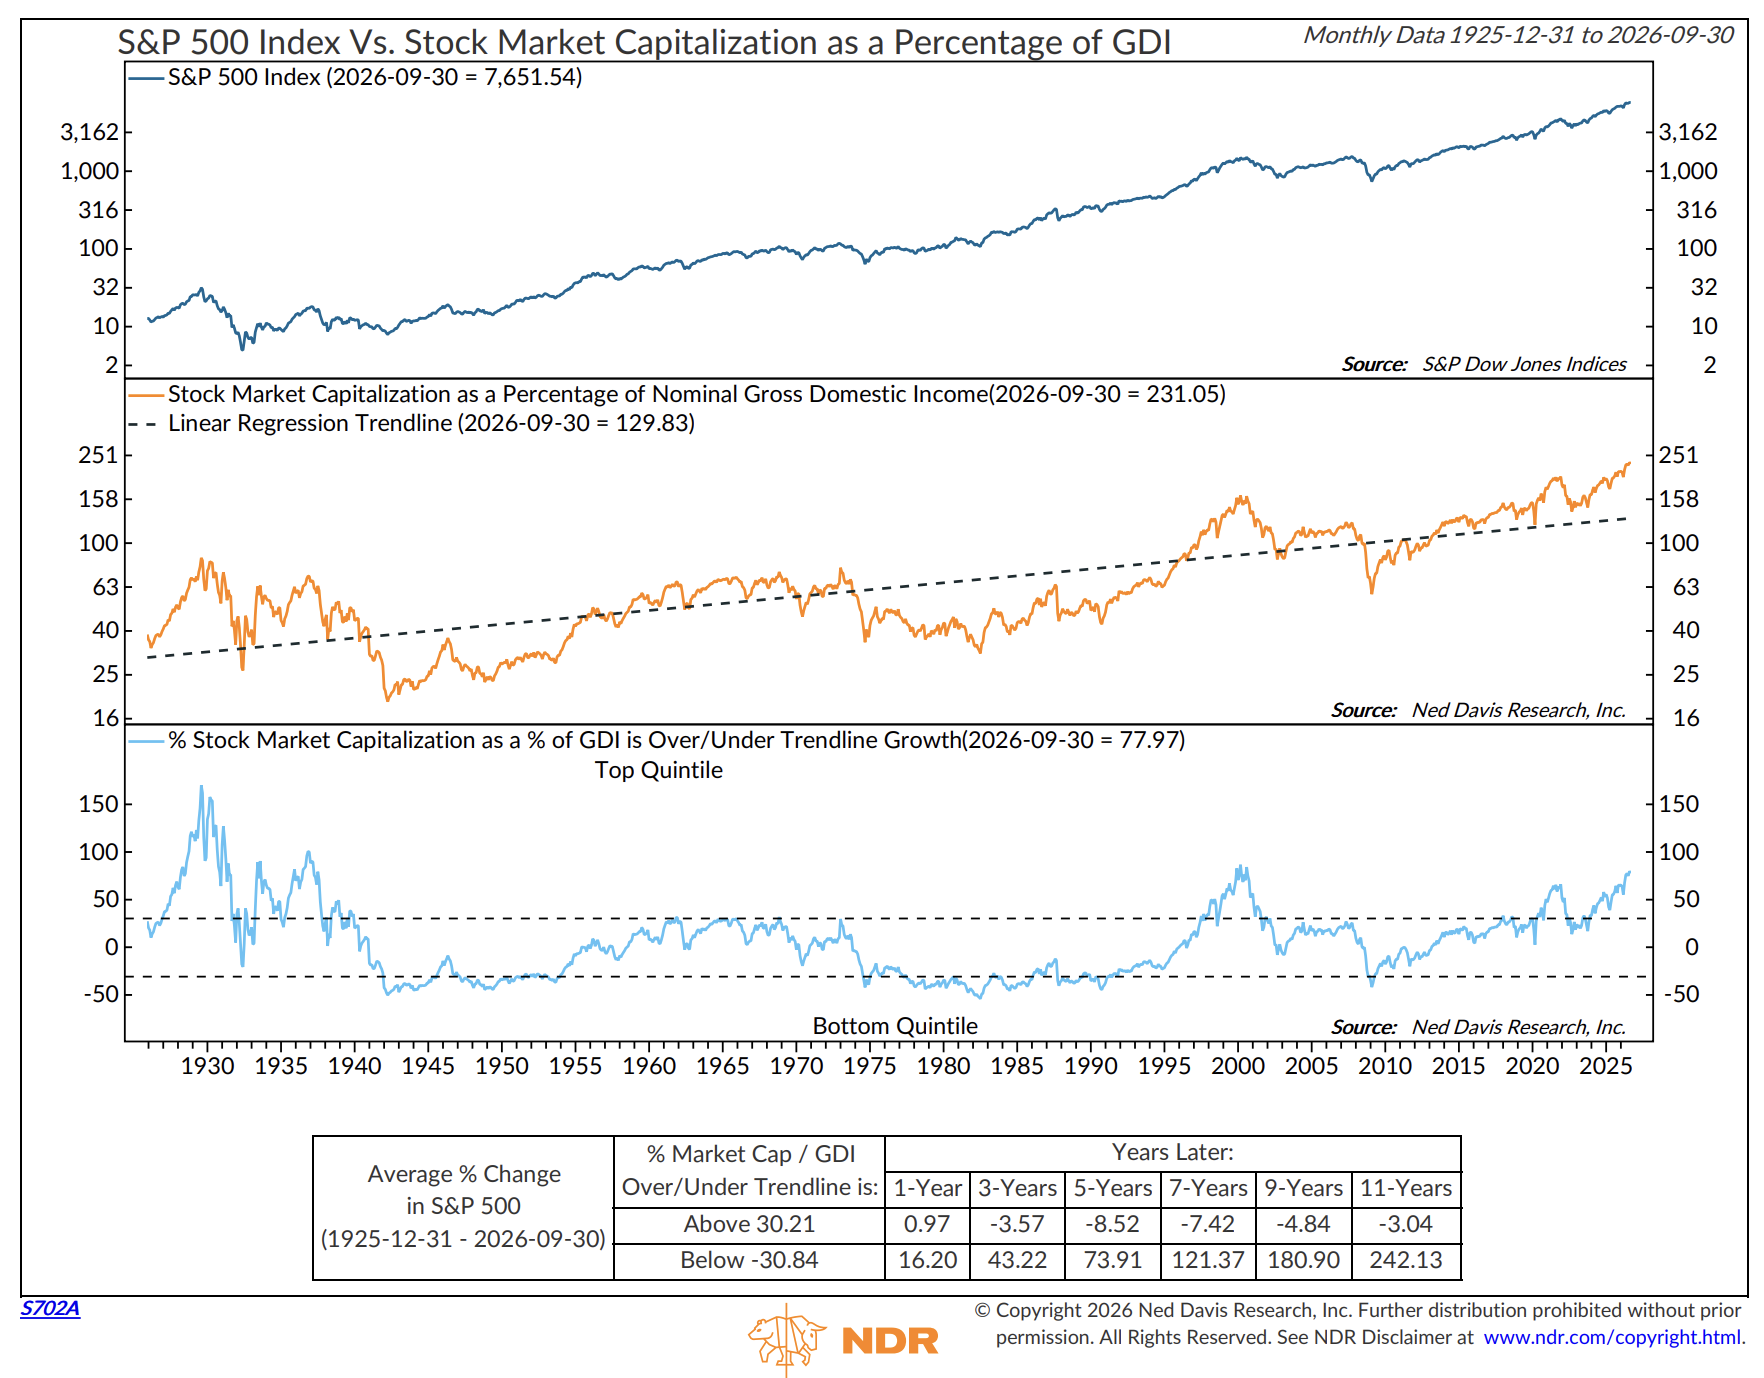
1) Stock Market Capitalization as a Percentage of Gross Domestic Income
This chart compares the total value of U.S. stocks to the income generated by the U.S. economy. Simply put, it helps us determine whether stocks are expensive or inexpensive relative to the size of the economy. Historically, major market peaks have occurred when stocks were in the overvalued zone, while major market bottoms have occurred when stocks were in the undervalued zone. The dashed lines identify these extremes, and the table at the bottom shows how stocks have performed in the years that followed. From NDR, “We use this chart as a valuable long-term perspective on valuations and market risk.”
Here’s how to read the chart:
The orange line plots the monthly data going back to 1925.
The light blue line in the lower section plots just how far the orange line is from its long-term dotted trend line. You can see that the blue line is as overvalued as it was in 2021, 2000, and all the way back to the 1930s. Only 1928 was more overvalued.
NDR ranks each month-end data point and sorts the numbers into 10 buckets that go from Top Quintile (most overvalued readings) to Bottom Quintile (best bargains).
Lastly, look at the data box at the very bottom. Note the returns in the subsequent 1-, 3-, 5-, 7-, 9-, and 11-year periods. In short, expect flat to negative returns over the coming 11 years.
Not only is the S&P 500 Index in the top quintile, but its current level is also among the highest in history.
Bottom line: hedge what you must hold, raise cash, and remain patient. We are looking to strike when the orange line drops below the dotted line.
Source: NDR
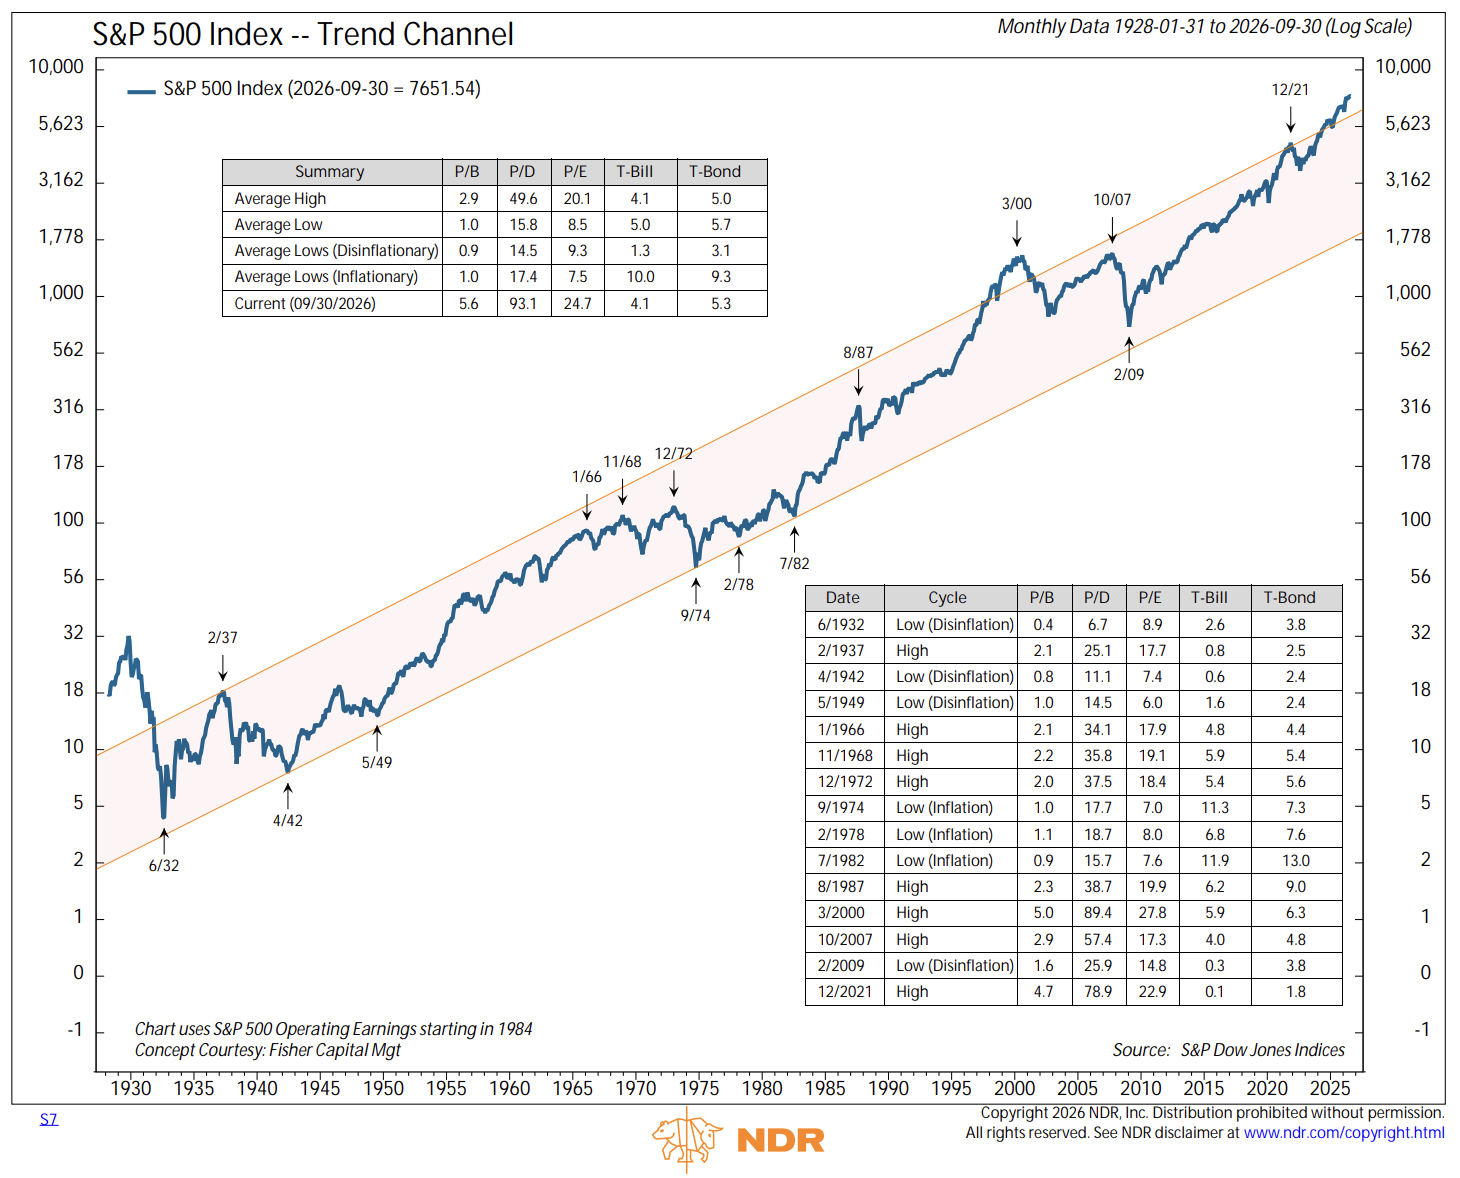
2) S&P 500 - Trend Channel
Here’s how to read the chart:
I really like this one, which I shared with you previously, because it compares three popular valuation metrics (Price to Book, Price to Dividend, and Price to Earnings) against past market cycle highs and lows.
The “Current (9/30/2026) data is in the last row of the upper left data box.
Compare the “Current” vs. the average high, low, and average lows (disinflationary) and average lows (inflationary) periods.
Bottom line: the current P/B, P/D, and P/E readings are crazy high.
For even more fun, compare the “Current” to the actual readings recorded at all prior market cycle highs and lows (bottom-right data box).
Source: NDR
Put your geek goggles back on your shelf. Let’s call it a day. I hope this helps you think about risk and reward. Nothing is ever certain.
I’ll close with a comment about being prepared. Market corrections in the 20% range are normal, and I’d argue healthy. Market crashes result from the accumulation of excess leverage. It is why I’m so obsessively focused on the Yen Carry Trade, margin debt, and hedge fund debt.
Crashes have nothing to do with whether a stock is fairly valued. It has everything to do with forced selling and margin calls. Would-be buyers would back away and let the market clear. They happen once or twice a generation. You and I will both be scared out of our minds - that will be our buy trigger!
Not saying it is going to happen, but it sure makes sense to me to have a buy list and some available cash so as to act.
Opinions are subject to change. Not a recommendation to buy or sell any security. Provided for discussion and educational purposes only.
The Yen Carry Trade and Key Data Charts
I’m going to keep updating this section each week due to the critical importance of the Yen Carry Trade and the leverage that currently sits in the markets.
Interest rates are the cost of money. Everything macro is tied to the cost of money. The match that lights the fuse to the global leverage problem is rising rates. We should all be on high alert.
Tracking the potential unwinding of the yen carry trade, here is the bottom line:
Across each of the key risk assets, we are seeing red flags. Signs risk is unwinding. Risk of a disruptive event is high.
Since we are at a critical point in terms of rising yields at a time of extreme system-wide leverage (the Yen Carry Trade, Government Debt, global developed market debt, and US margin debt), I’m going to update the following charts each week going forward as we may be near a critical inflection point.
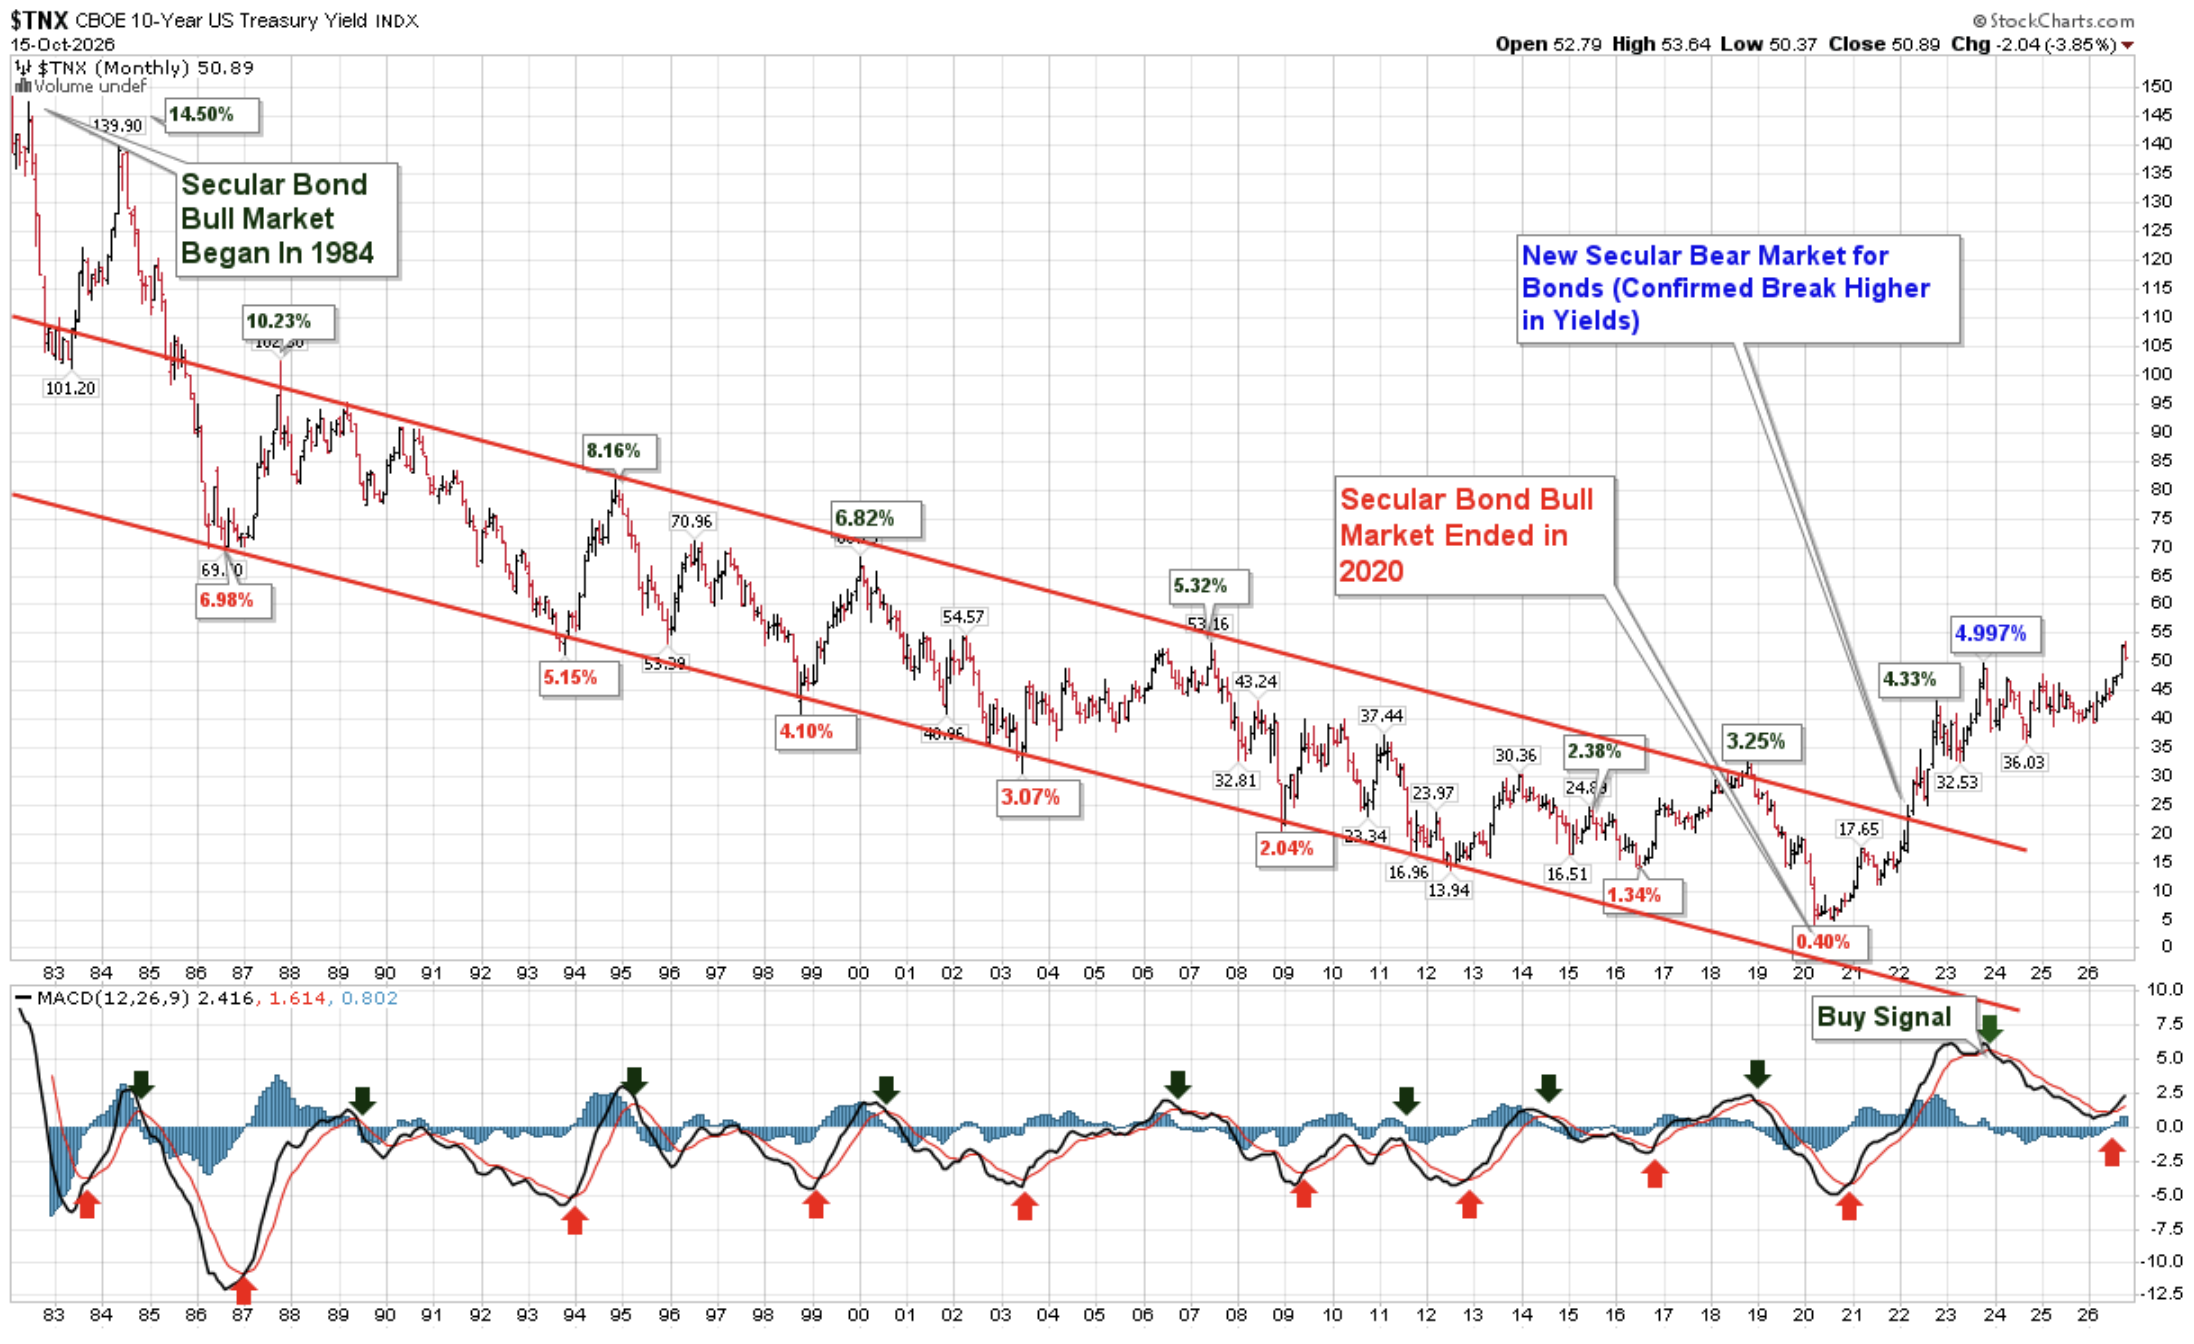
When viewing the MACD signals, keep the following in mind. For example, the Monthly MACD signals the dominant trend over the next 8 to 20 months from the signal date. Note: nothing is perfect in investing. The idea here is to understand what price activity (actual buyers and sellers) indicates.
The Daily (short-term) MACD Trend: ~ 8 days to 20 days
The Weekly (intermediate-term) MACD Trend: ~ 8 weeks to 20 weeks
The Monthly (long-term) MACD Trend: ~ 8 months to 20 months
Updated charts with brief notes follow:
The 10-year Treasury - Monthly MACD
After peaking at 5.36% last week, the yield is at 5.09% at the time of this writing.
Source: StockCharts.com, CMG annotations (arrows)
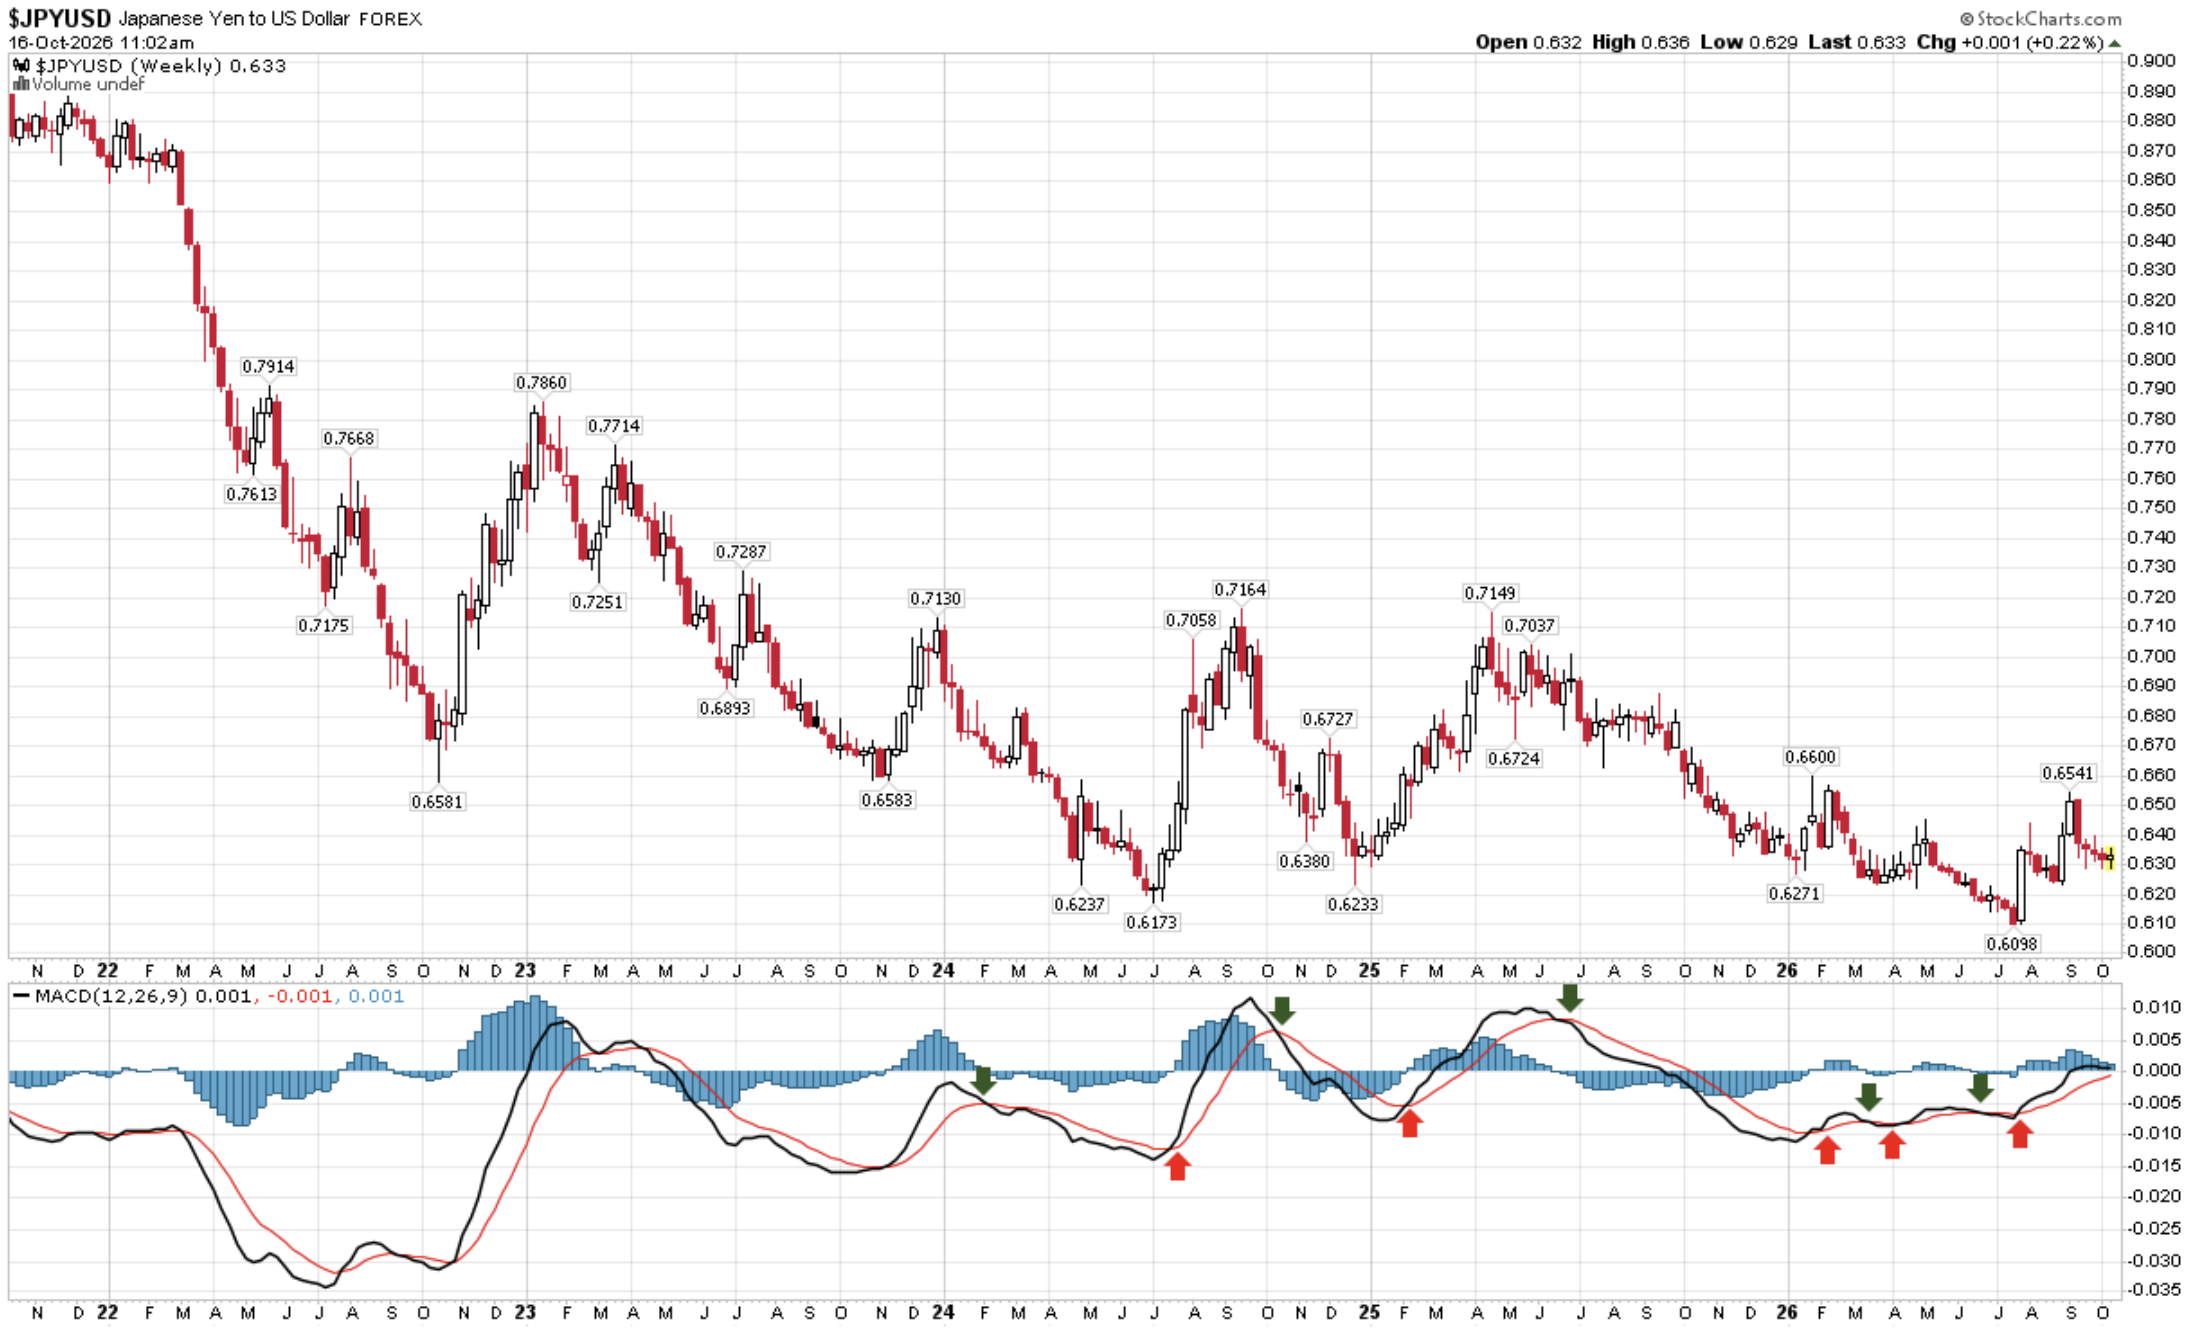
The Yen: No Significant Move Since Last Week
The Bank of Japan needs the yen to be higher to fight off inflation.
They would prefer not to raise their interest rates, which would increase the interest costs they pay on their debt and risk unwinding the leveraged yen carry trade (borrowing near 0% and investing in higher-yielding assets elsewhere).
When the borrow-for-free spread goes away, the leverage likely unwinds. That’s what risks forced selling across the system.
The current trend, as measured by the weekly MACD, points to a higher yen.
The recent intervention to push the yen higher appears to be stalling.
Each bar equals the price activity for one week. A lower yen vs. the dollar means higher inflation for Japanese citizens.
The risk to US interest rates is that the Japanese sell their large US Treasury holdings and repatriate the proceeds (sell US bonds, sell dollars, buy yen; they need the yen higher).
Source: StockCharts.com, CMG annotations
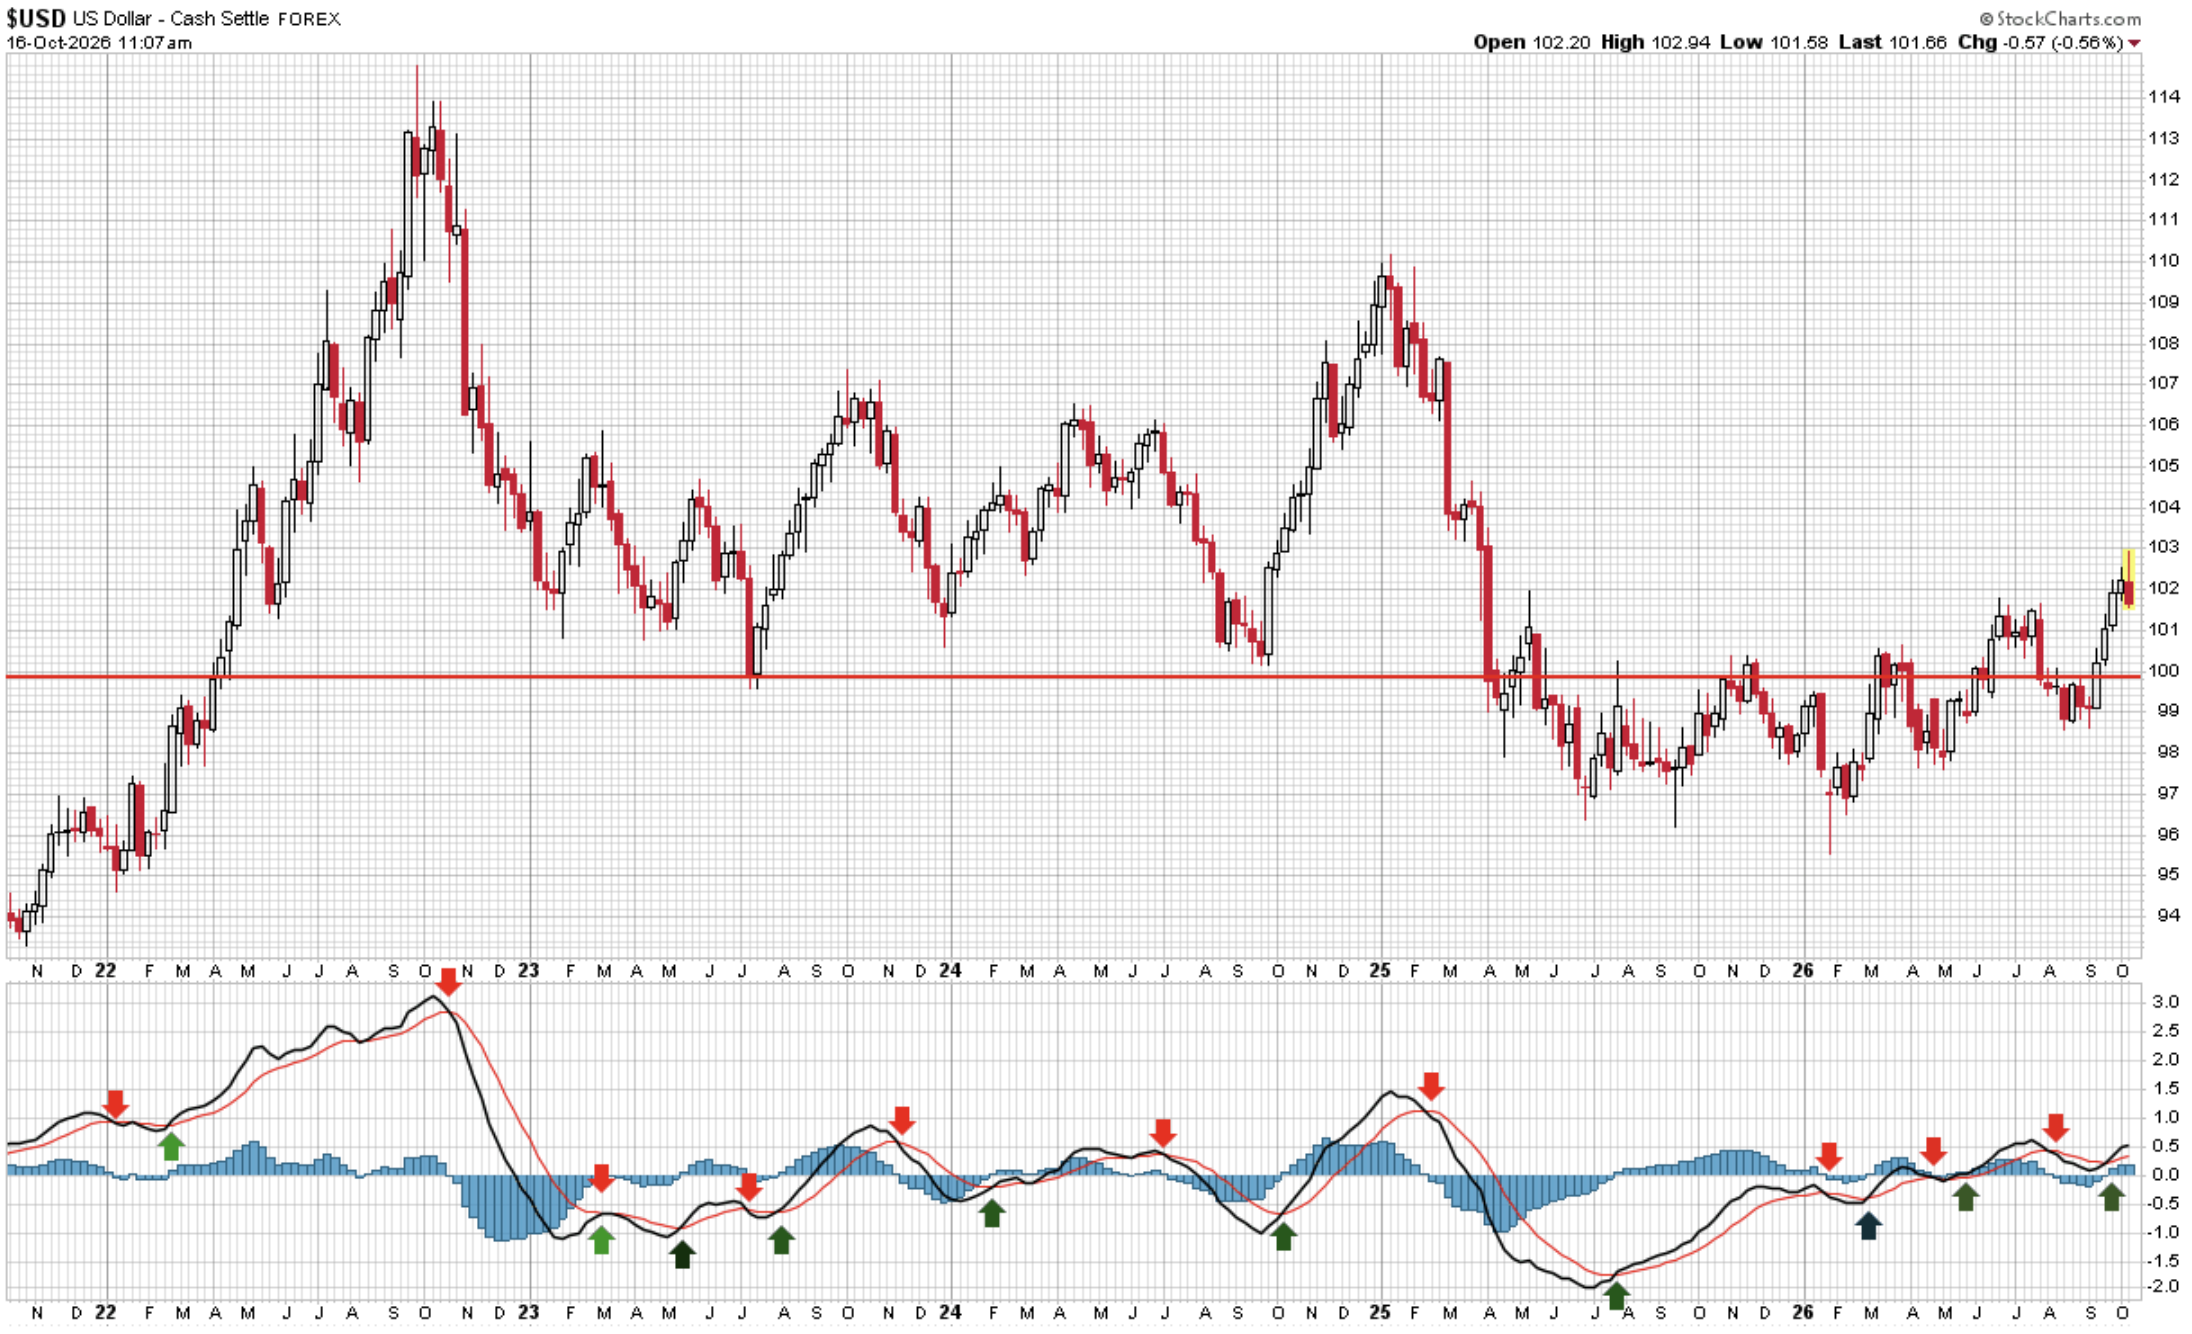
The Dollar: Lower Since Last Week, but Weekly MACD Price Trend is Up
Note the sharp price move higher over the last three weeks.
The Weekly MACD trend signal is pointing to a higher dollar.
Source: StockCharts.com, CMG Investment Research
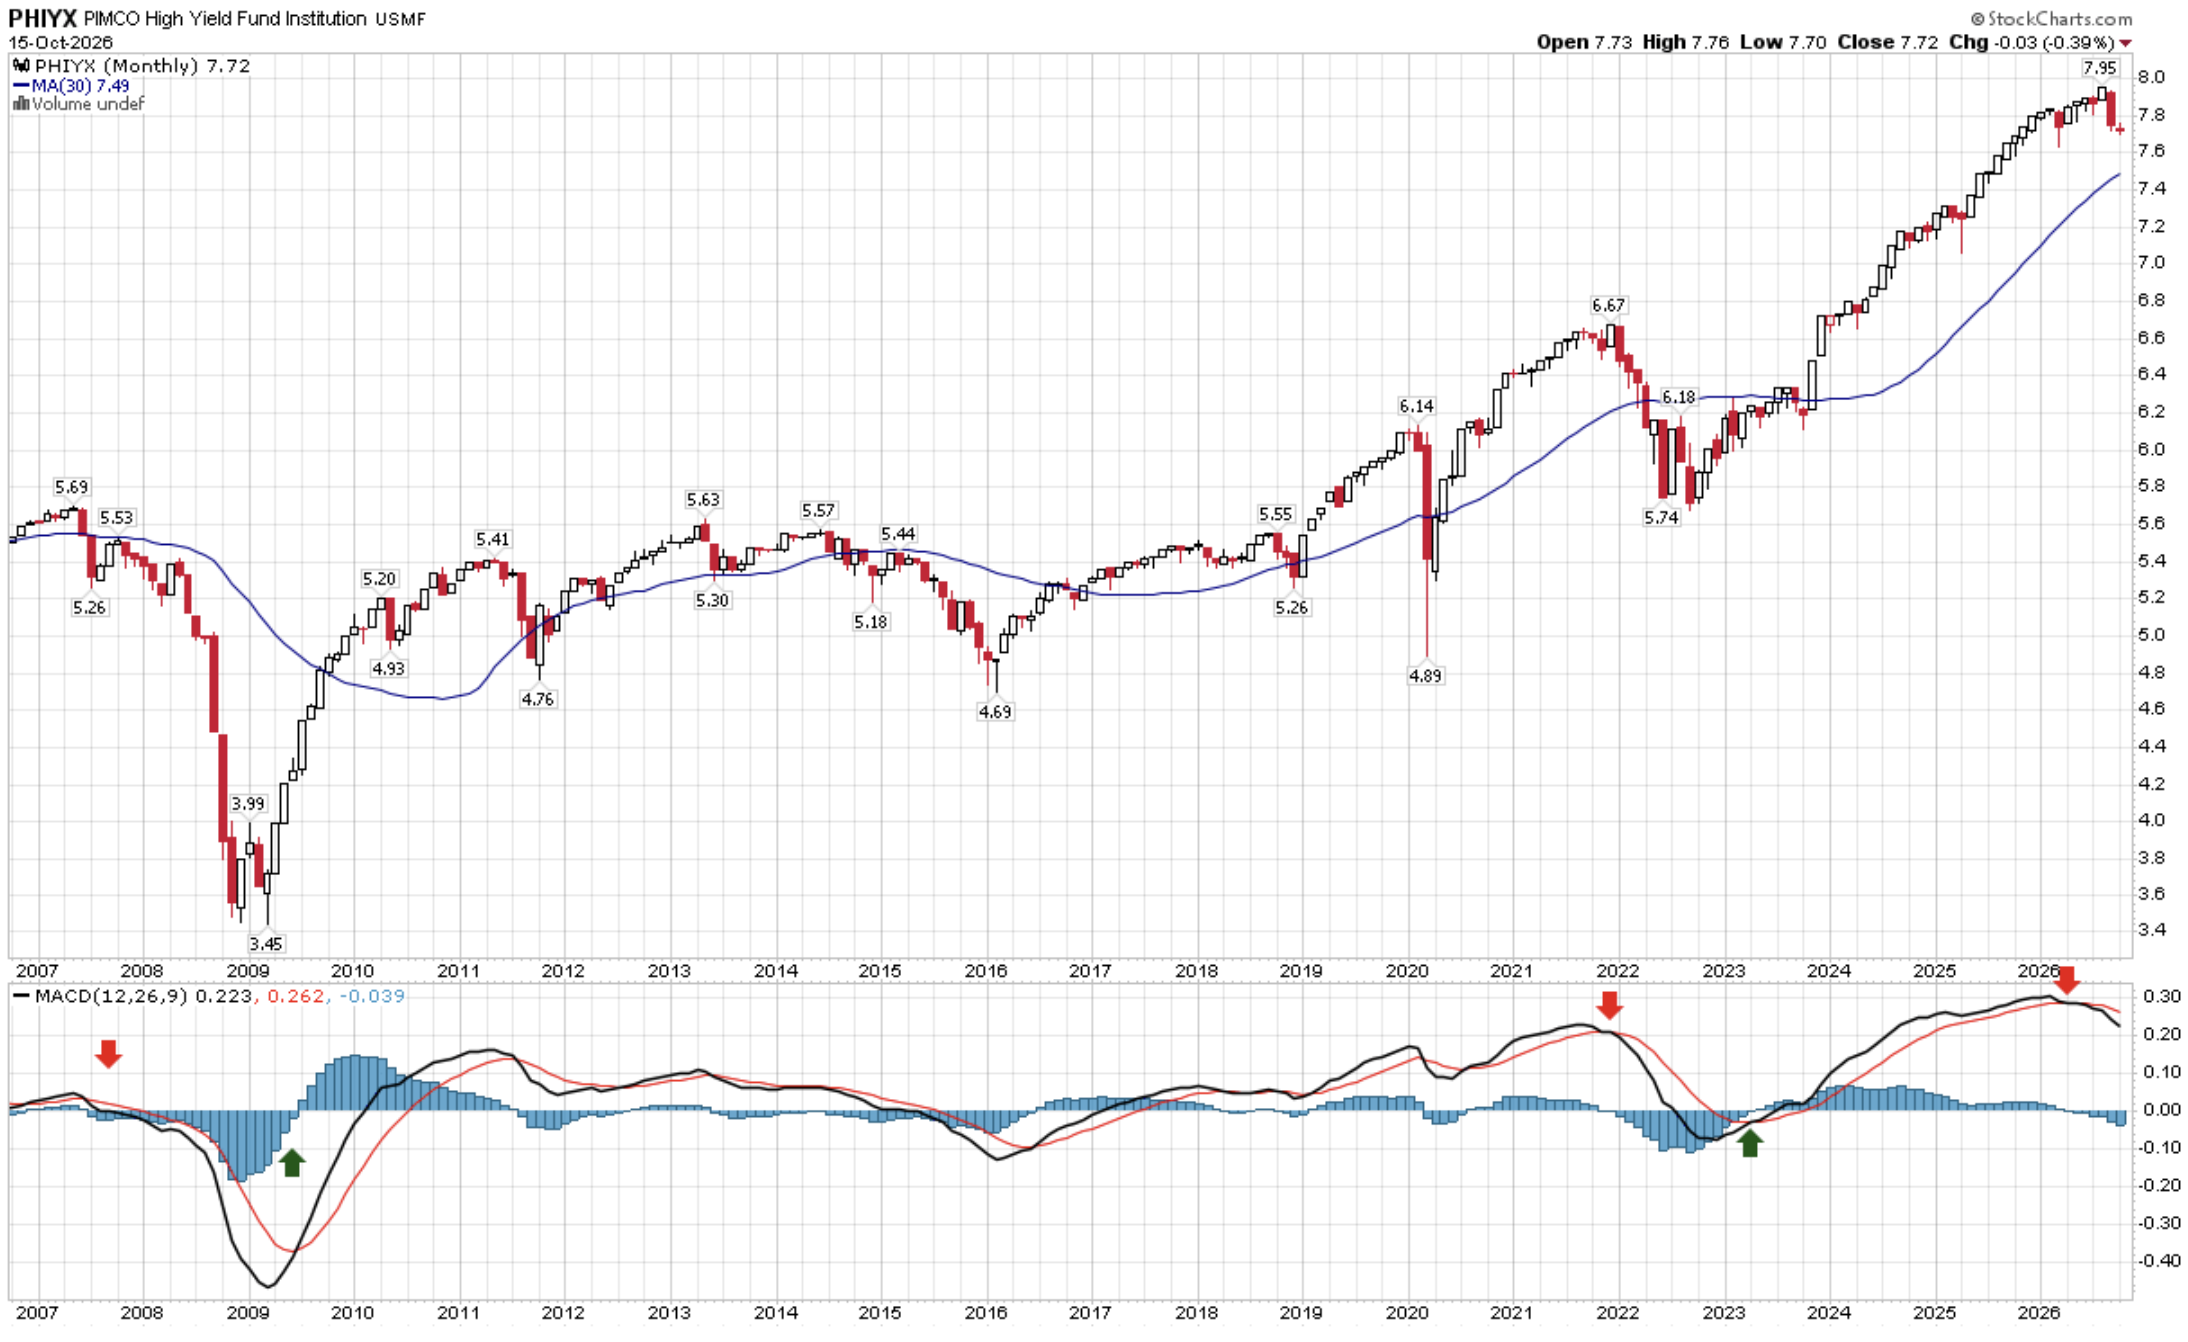
High-yield bonds - Monthly MACD Bear Trend Signal
Next is the “canary in the coal mine” indicator I’ve been using since 1992.
The long-term monthly MACD price trend remains bearish (the monthly MACD is the dominant long-term trend; the weekly is the intermediate-term trend).
Source: StockCharts.com, CMG arrows
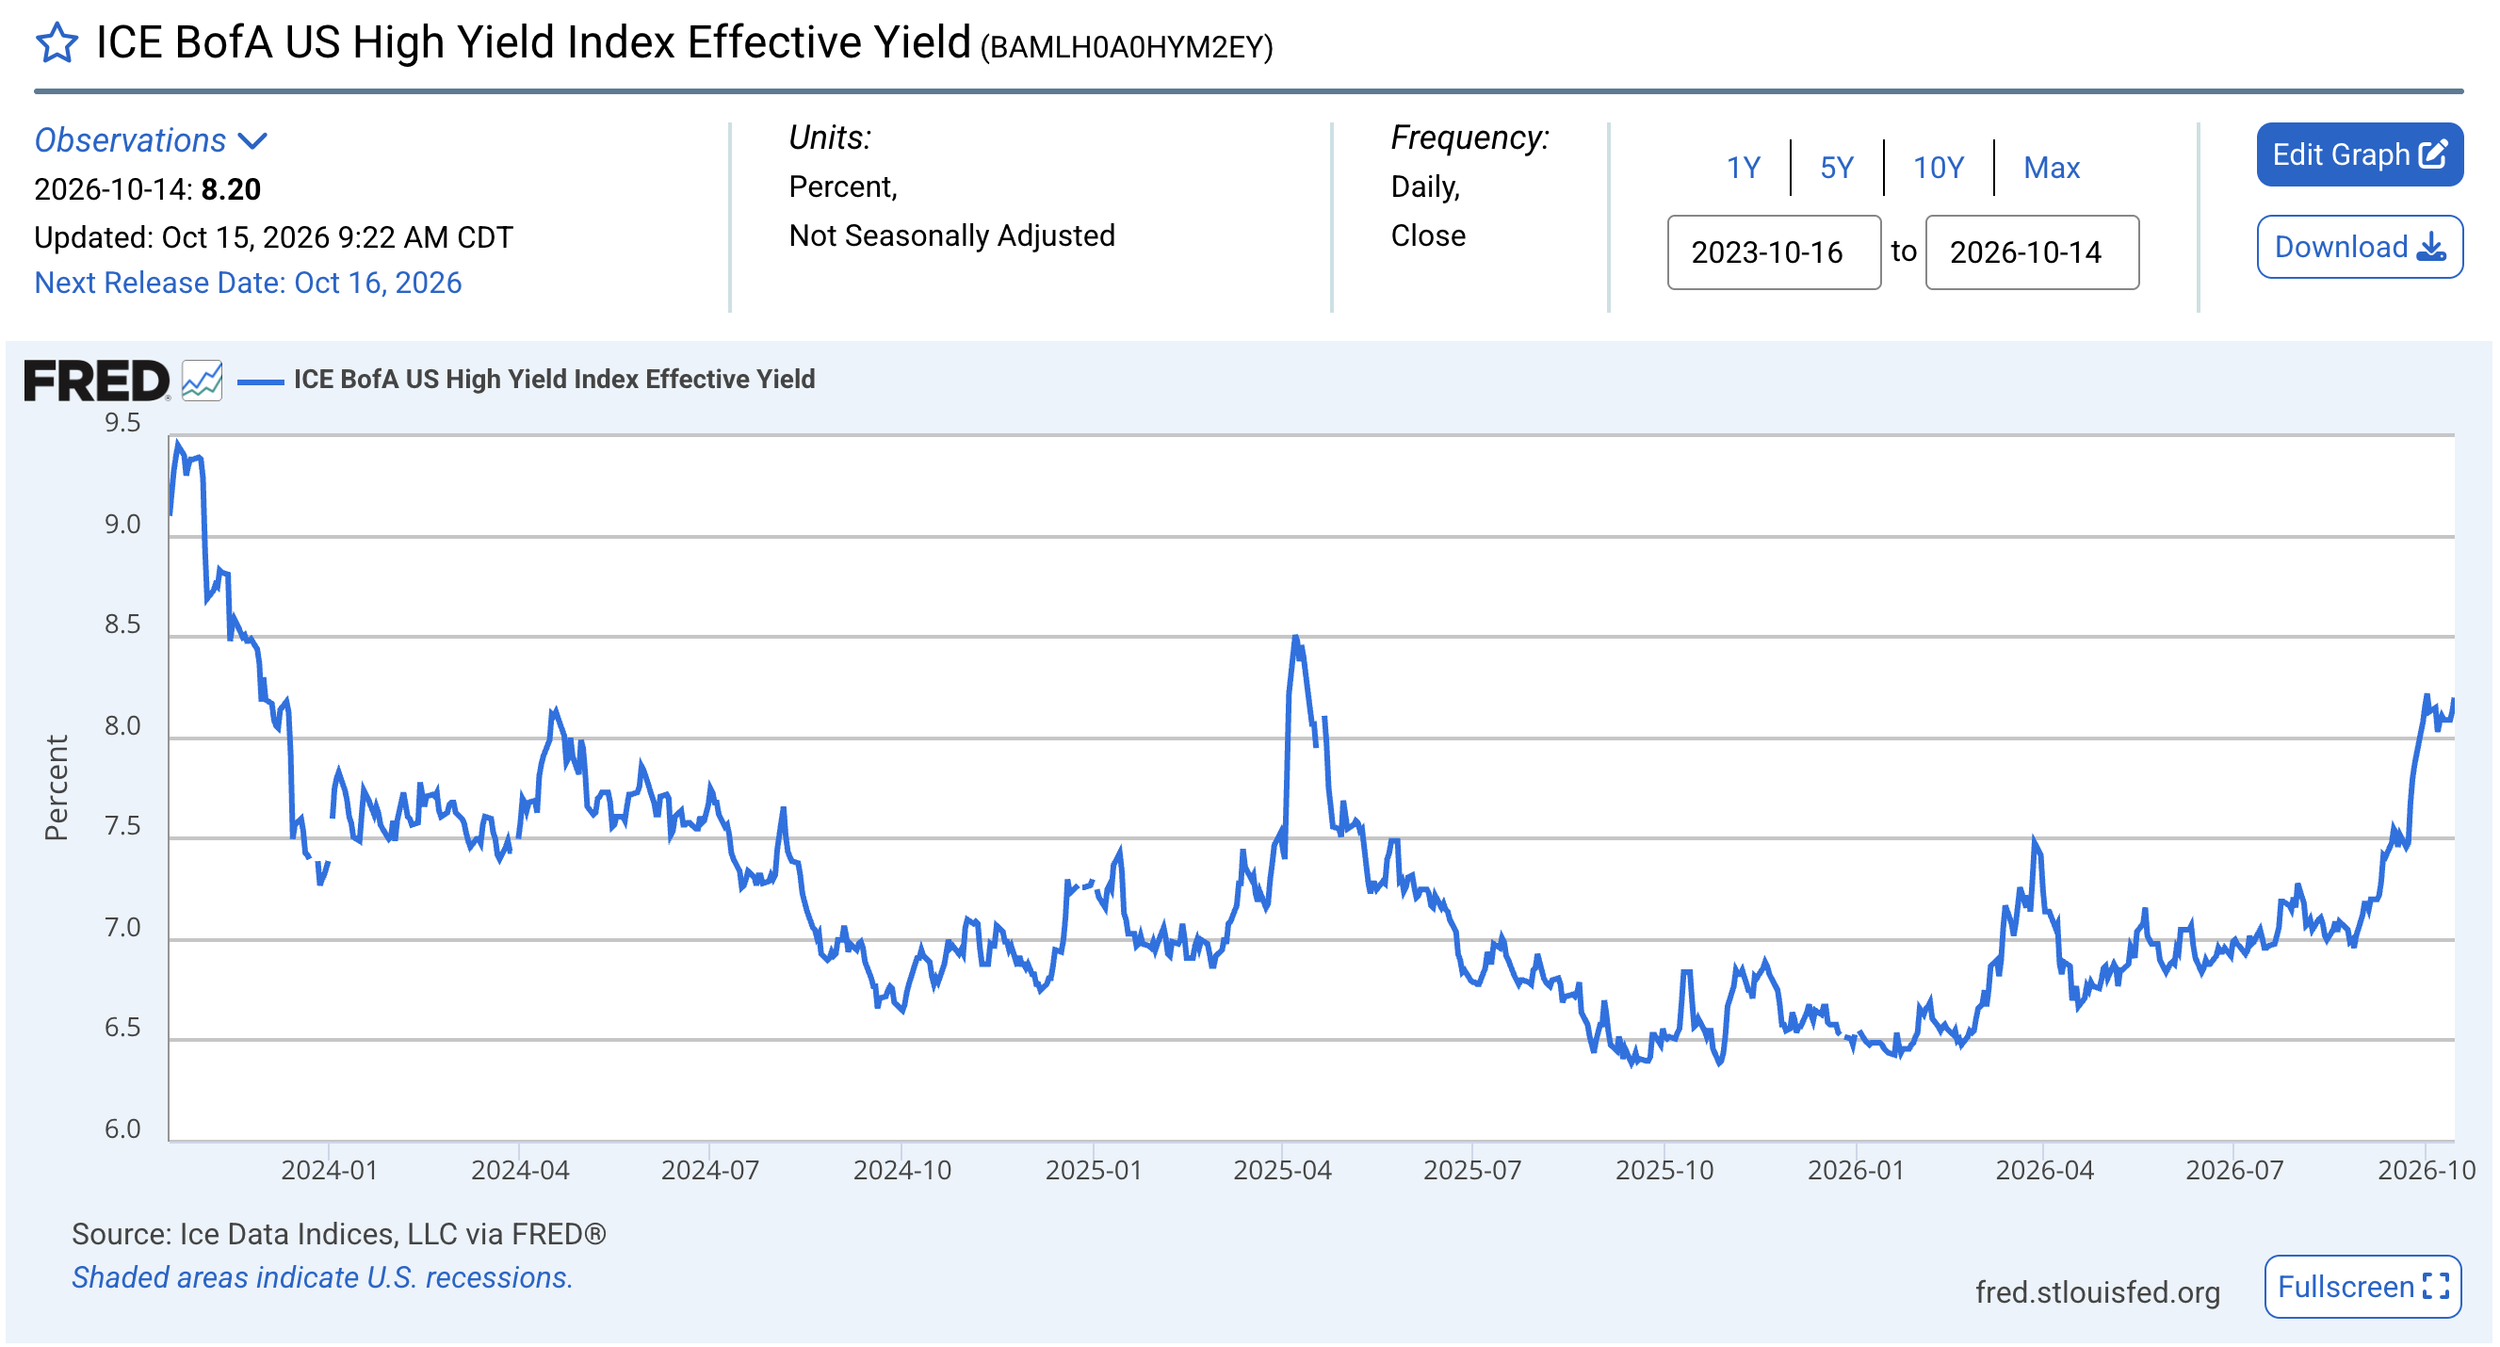
High-yield bond yields are spiking higher.
Source: FRED
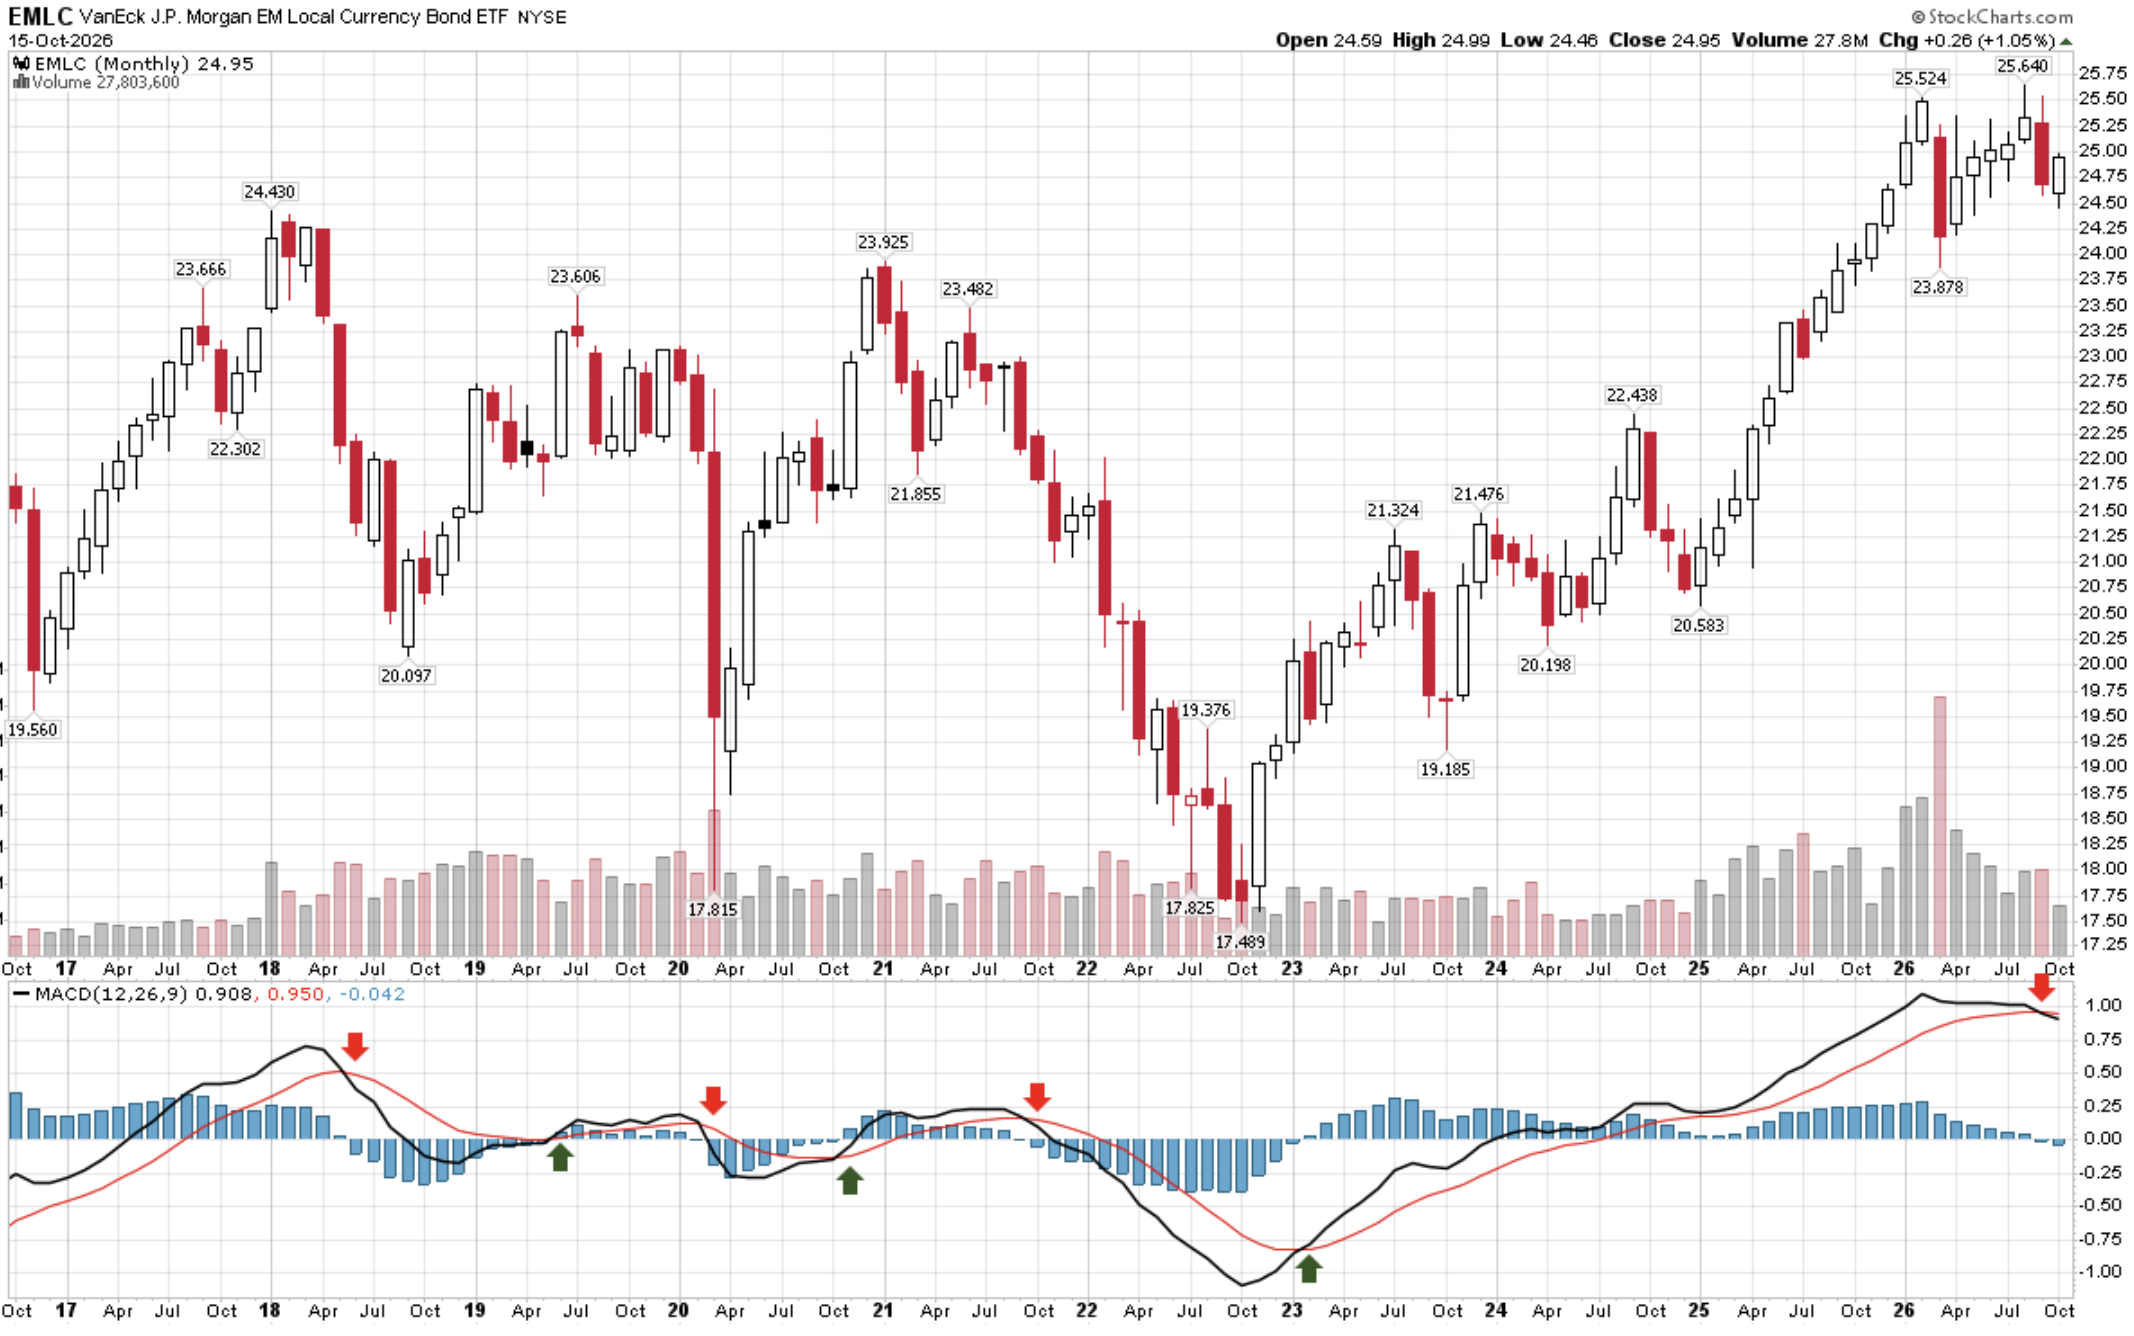
Emerging Market Local Currency Bond ETF - Monthly MACD Bear Trend Signal
Another signal to watch: EM debt, where some of the carry-trade leverage sits (borrow cheaply in yen, invest in higher-yielding EM bonds).
How to read the chart:
Calm and steady is good; a sharp price decline is a warning. Prices down mean yields are up.
The following is the Monthly MACD trend signal: a sell (downward price trend) signal. This is the first signal since the buy trend signal in early 2023.
Bottom line: A warning sign of the unwinding of the leveraged yen carry trade.
Source: StockCharts.com, CMG Investment Research
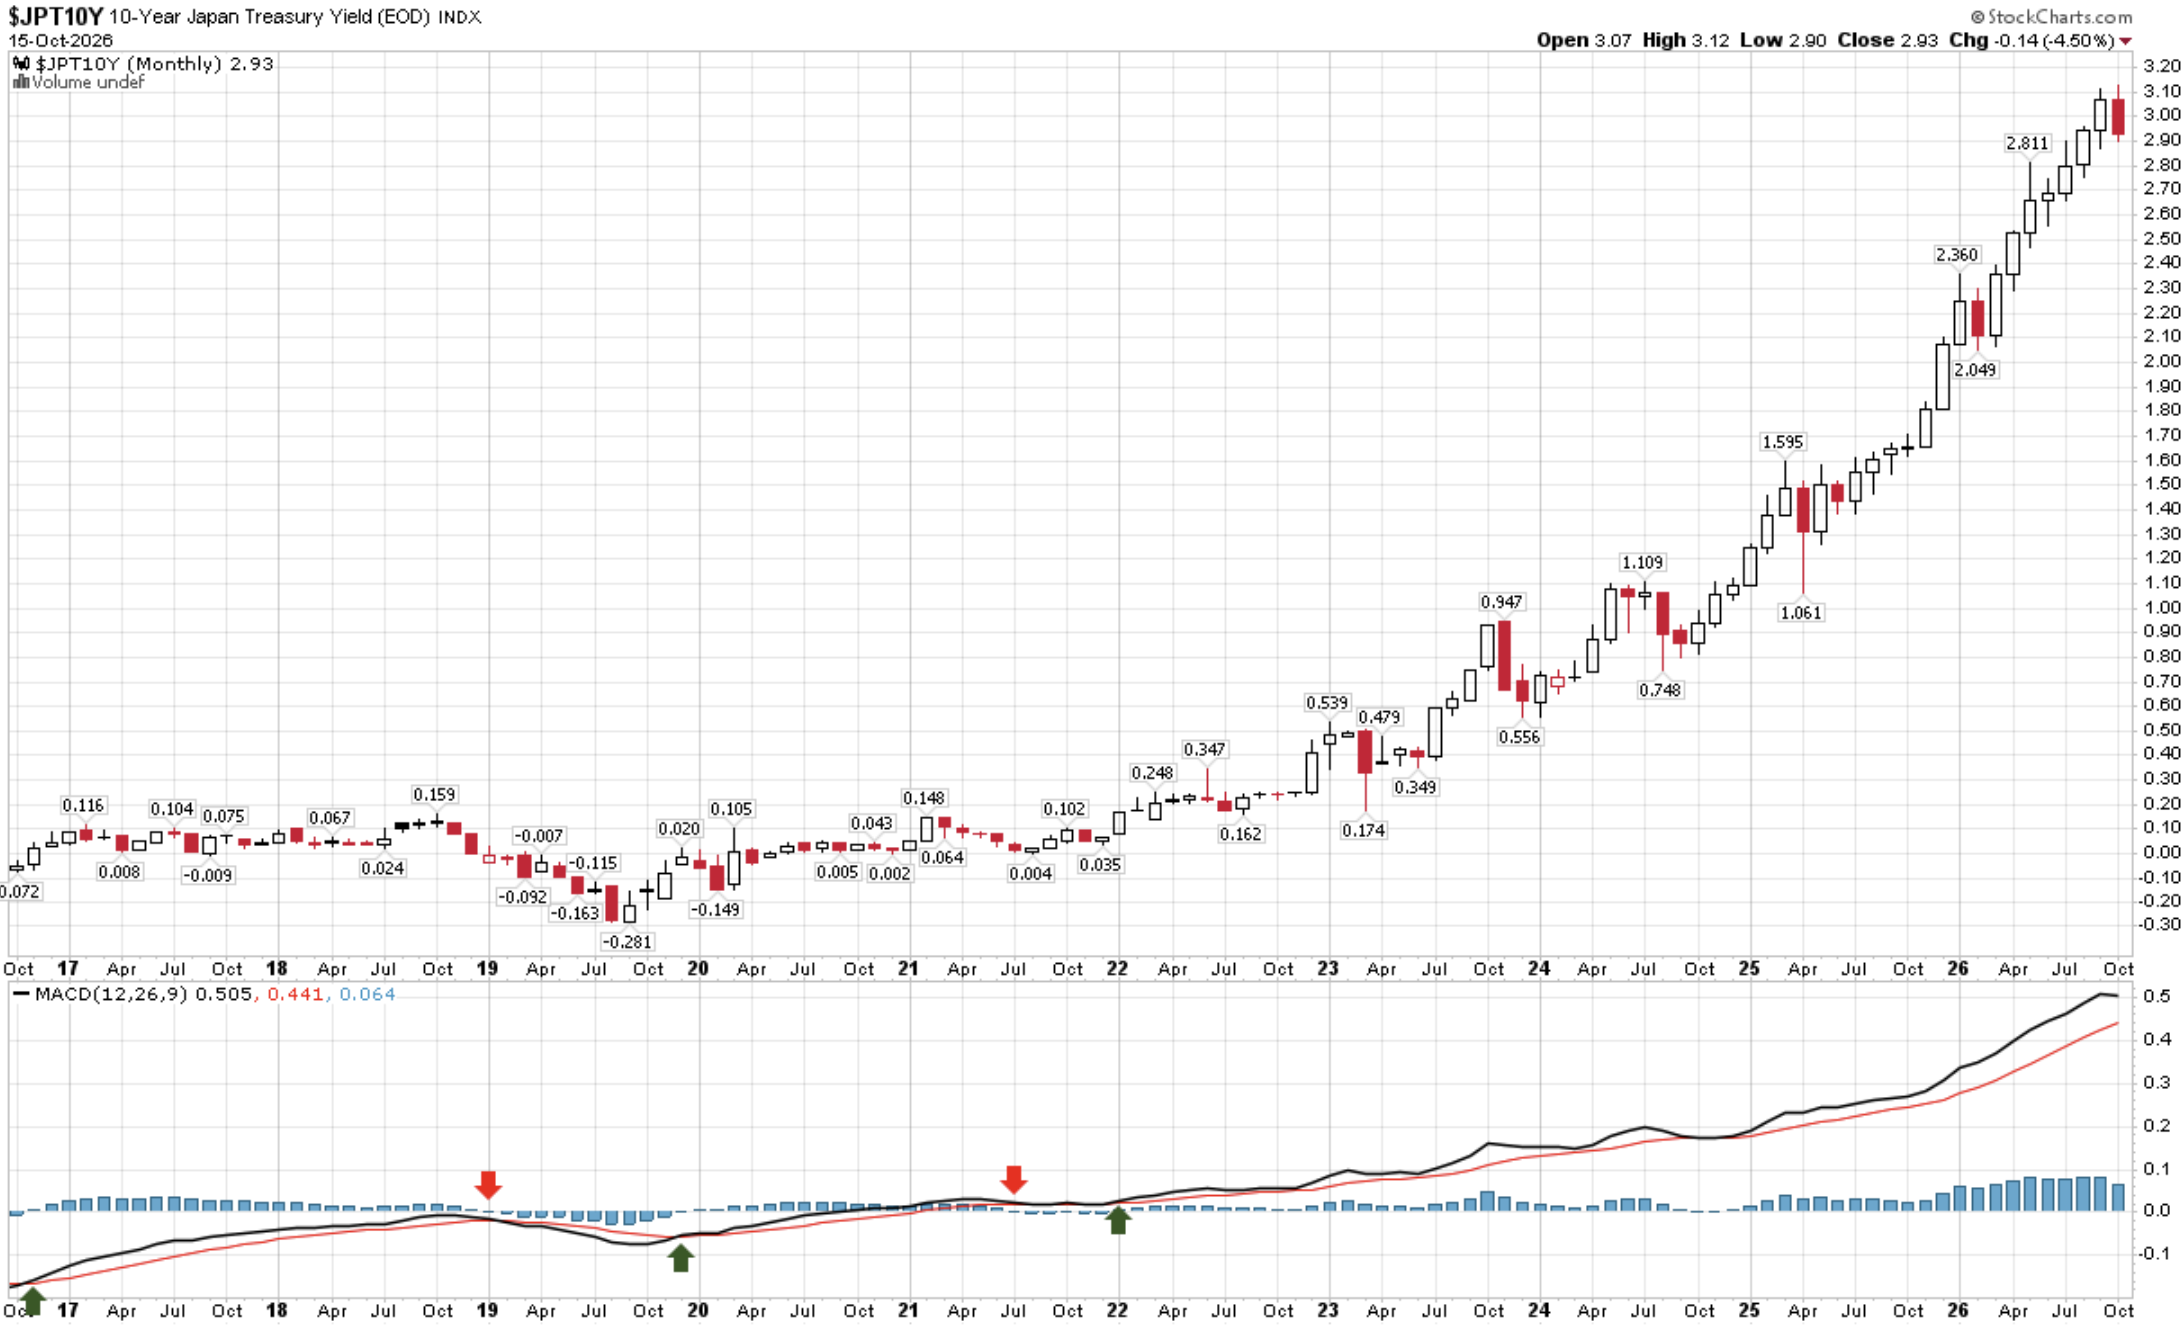
The Japan 10-year JGB yield - Monthly MACD Signaling Higher Yields (Bearish for global liquidity)
The current yield is 2.93%, down from the recent yield high of 3.12% earlier this month.
Higher JGB yields shrink the benefit of the yen carry trade.
Bottom line: Flashing yellow.
Source: StockCharts.com
Opinions are subject to change. Not a recommendation to buy or sell any security. Provided for discussion and educational purposes only.
If you like what you are reading, click on the link and share it with a friend (it’s free).
CLICK HERE TO SUBSCRIBE TO ON MY RADAR
Trade Signals: October 15, 2026 Update
Market Commentary
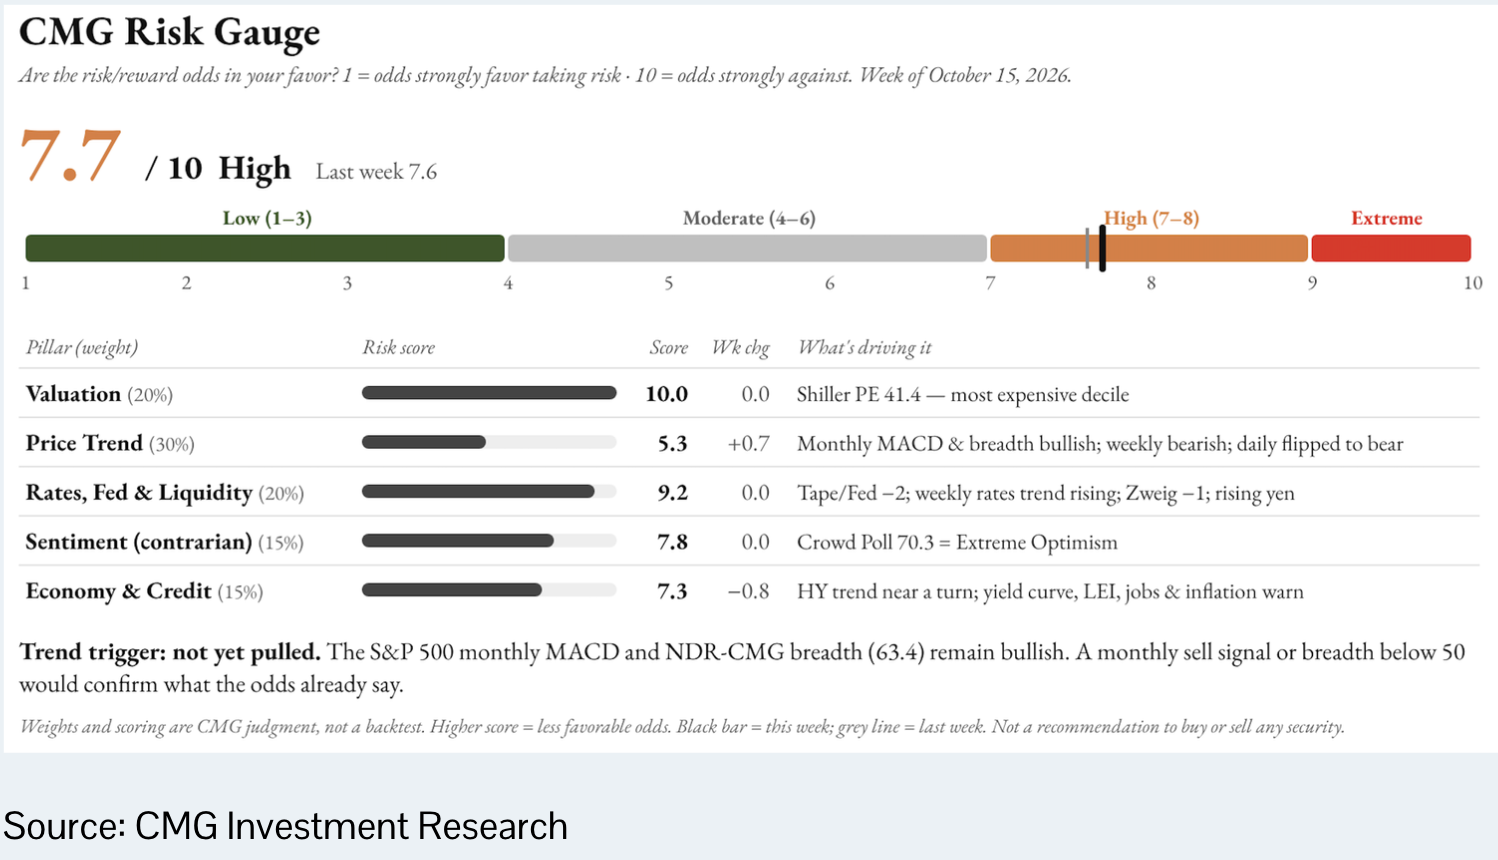
New this week: the CMG Risk Gauge
Here’s something new: a single read on where we stand. The gauge rolls the dashboard into one number on a 1-to-10 scale, the way I framed risk/reward in last week’s OMR. As Howard Marks frames it: are the risk/reward odds in your favor? Ten is the least favorable.
Our gauge looks at the various signals I update each week. It weighs valuation (20%), price trend (30%), rates, Fed and liquidity (20%), sentiment (15%, read as a contrarian), and the economy and credit (15%). It is designed to give our investment team a systematic way to assess risk vs. reward in the equity and fixed-income markets. Tickets in a fish bowl, as Howard Marks writes about risk. See On My Radar: A Game of Reward vs. Risk for more.
This week’s reading is 7.7 (High), up from 7.6 last week. The S&P daily sell signal added risk; the turn in high yield took a little away. Please know that CMG’s view of the current state of investment markets suggests hedging long-term equity exposure and seeking alternative solutions to traditional bond investing.
Not a recommendation to buy or sell any security.
Trade Signals is free for CMG clients and a paid subscription service for others. Selfishly, I write it for myself each week, and have for years, with the goal of staying disciplined in the markets.
Trade Signals
The Indicators Dashboard - Stocks, Investor Sentiment, Bonds, Commodities, Currencies, and Gold
Valuations and Subsequent 10-year Returns
Supporting Charts with Explanations

TRADE SIGNALS SUBSCRIPTION ACKNOWLEDGEMENT / IMPORTANT DISCLOSURES
About Trade Signals - Trade Signals is a paid subscription service that posts daily, weekly, and monthly market trends (and more). Free for CMG clients. Not a recommendation to buy or sell any security. For discussion purposes only.
The views expressed herein are solely those of Steve Blumenthal as of the date of this report and are subject to change without notice. Please note that the information provided is not recommended for buying or selling any security and is provided for discussion purposes only.
Personal Note: Homecoming
First, a quick Malvern Prep Friars update. The boys have gone 1-3-1 over the last five games and stand at 6-3-2. On Tuesday, Coach Sue’s team led Springside Chestnut Hill Academy 1-0 with about 10 minutes left. Our center back boxed out their forward and let the ball roll over the end line. It should have been our goal kick. To our surprise, the referee called a corner, and Springside headed it home to tie the game. With two minutes to go, they scored again. Of the five big league games so far, I’d say we were the stronger team in three. That’s soccer. Five games remain, and tomorrow at 10 a.m. is Homecoming. Coach and the boys need a win.
Now a fun story. Years ago, Susan (Coach Sue, my wife, whom I’m endlessly crazy about) worked for what became the Philadelphia Union Academy, where she built the Little Kickers program for ages 4 to 7. The owner, who was also a part-owner of the Philly Union MLS team, asked her whether a new hire could work alongside her. He was a former MLS player named Jim Curtin. They became good friends. Jim went on to coach the Philadelphia Union for seven seasons, and after this season he became head coach of Austin FC. We joke about Susan being his first boss. He and Susan remain close.
Jim lives in the Philly area, and his son plays for Springside Chestnut Hill. Before Tuesday’s game, one of our players spotted him walking across the field. I turned and greeted him with a big hug. He’s volunteering as an assistant coach for Springside’s varsity this fall. Let’s just say his post-game IPA tasted a little better than Susan’s and mine. A cold beer always tastes better after a W. But the real win is what sports (and life) teach us, the friendships we make along the way, and the kids we hope to help build the skills for a happy, creative, purposeful life. Winning and losing are powerful teachers.
On the road: I’ll be in Boston October 27–29 for the Schwab conference and visiting clients in Florida in November. If you’re nearby, I’d love to connect.
Ahhh, and basketball season is here. Tonight I’m taking a few close friends to the Sixers–Celtics preseason game. I may need to pick up a few LeBron James #23 Sixers jerseys for the kids. I still can’t believe I just typed that sentence.
Best of luck to your favorite teams. Mine have mostly stunk, except the 76ers. Let’s go, Sixers!
And finally, how about the Milwaukee Brewers! They swept the two-time defending champion Dodgers to reach their first World Series since 1982. Wow. I’m pulling for them and for all my friends in the Midwest.
Have a great week!
Kind regards,
Steve
CLICK HERE TO SUBSCRIBE TO ON MY RADAR - IT’S FREE
You can share this letter on X by clicking here.
You can share this letter on LinkedIn by clicking here.
Subscribe to OMR for free by clicking the photo.
Stephen B. Blumenthal
Founder and CEO
CMG Capital Management Group, Inc.
75 Valley Stream Parkway, Suite 201
Malvern, PA 19355
CMG Customer Relationship Summary (Form CRS)
Metric-Financial, LLC Customer Relationship Summary (Form CRS)

Stephen Blumenthal founded CMG Capital Management Group in 1992 and serves today as its CEO. Steve authors a free weekly e-letter entitled, “On My Radar.” Steve shares his views on macroeconomic research, valuations, portfolio construction, asset allocation and risk management. Author of Forbes Book: On My Radar, Navigating Stock Market Cycles.
Follow Steve on X @SBlumenthalCMG and LinkedIn.
IMPORTANT DISCLOSURE INFORMATION
This document is prepared by CMG Capital Management Group, Inc. (“CMG”) and is circulated for informational and educational purposes only. There is no consideration given to the specific investment needs, objectives, or tolerances of any of the recipients. Additionally, CMG’s actual investment positions may, and often will, vary from its conclusions discussed herein based on any number of factors, such as client investment restrictions, portfolio rebalancing, and transaction costs, among others. Recipients should consult their own advisors, including tax advisors, before making any investment decision. This material is for informational and educational purposes only and is not an offer to sell or the solicitation of an offer to buy the securities or other instruments mentioned. This material does not constitute a personal recommendation or take into account the particular investment objectives, financial situations, or needs of individual investors which are necessary considerations before making any investment decision. Investors should consider whether any advice or recommendation in this research is suitable for their particular circumstances and, where appropriate, seek professional advice, including legal, tax, accounting, investment, or other advice. The views expressed herein are solely those of Steve Blumenthal as of the date of this report and are subject to change without notice.
Investing involves risk.
This letter may contain forward-looking statements relating to the objectives, opportunities, and future performance of the various investment markets, indices, and investments. Forward-looking statements may be identified by the use of such words as; “believe,” anticipate,” “planned,” “potential,” and other similar terms. Examples of forward-looking statements include, but are not limited to, estimates with respect to financial condition, results of operations, and success or lack of success of any particular market, index, investment, or investment strategy. All are subject to various factors, including, but not limited to, general and local economic conditions, changing levels of competition within certain industries and markets, changes in legislation or regulation, Federal Reserve policy, and other economic, competitive, governmental, regulatory, and technological factors affecting markets, indices, investments, investment strategy and portfolio positioning that could cause actual results to differ materially from projected results. Such statements are forward-looking in nature and involve a number of known and unknown risks, uncertainties, and other factors, and accordingly, actual results may differ materially from those reflected or contemplated in such forward-looking statements. Investors are cautioned not to place undue reliance on any forward-looking statements or examples. All statements made herein speak only as of the date that they were made. Investing is inherently risky and all investing involves the potential risk of loss.
Past performance does not guarantee or indicate future results. Different types of investments involve varying degrees of risk, and there can be no assurance that the future performance of any specific investment, investment strategy, or product (including the investments and/or investment strategies recommended or undertaken by CMG), or any non-investment related content, made reference to directly or indirectly in this commentary will be profitable, equal any corresponding indicated historical performance level(s), be suitable for your portfolio or individual situation or prove successful. Due to various factors, including changing market conditions and/or applicable laws, the content may no longer be reflective of current opinions or positions. Moreover, you should not assume that any discussion or information contained in this commentary serves as the receipt of, or as a substitute for, personalized investment advice from CMG. Please remember to contact CMG, in writing, if there are any changes in your personal/financial situation or investment objectives for the purpose of reviewing/evaluating/revising our previous recommendations and/or services, or if you would like to impose, add, or to modify any reasonable restrictions to our investment advisory services. Unless, and until, you notify us, in writing, to the contrary, we shall continue to provide services as we do currently. CMG is neither a law firm, nor a certified public accounting firm, and no portion of the commentary content should be construed as legal or accounting advice.
No portion of the content should be construed as an offer or solicitation for the purchase or sale of any security. References to specific securities, investment programs or funds are for illustrative purposes only and are not intended to be, and should not be interpreted as recommendations to purchase or sell such securities.
This presentation does not discuss, directly or indirectly, the amount of the profits or losses realized or unrealized, by any CMG client from any specific funds or securities. Please note: In the event that CMG references performance results for an actual CMG portfolio, the results are reported net of advisory fees and inclusive of dividends. The performance referenced is that as determined and/or provided directly by the referenced funds and/or publishers, has not been independently verified, and does not reflect the performance of any specific CMG client. CMG clients may have experienced materially different performance based upon various factors during the corresponding time periods. See in links provided citing limitations of hypothetical back-tested information. Past performance cannot predict or guarantee future performance. Not a recommendation to buy or sell. Please talk to your advisor.
Information herein has been obtained from sources believed to be reliable, but we do not warrant its accuracy. This document is general communication and is provided for informational and/or educational purposes only. None of the content should be viewed as a suggestion that you take or refrain from taking any action nor as a recommendation for any specific investment product, strategy, or other such purposes.
In a rising interest rate environment, the value of fixed-income securities generally declines, and conversely, in a falling interest rate environment, the value of fixed-income securities generally increases. High-yield securities may be subject to heightened market, interest rate, or credit risk and should not be purchased solely because of the stated yield. Ratings are measured on a scale that ranges from AAA or Aaa (highest) to D or C (lowest). Investment-grade investments are those rated from highest down to BBB- or Baa3.
NOT FDIC INSURED. MAY LOSE VALUE. NO BANK GUARANTEE.
Certain information contained herein has been obtained from third-party sources believed to be reliable, but we cannot guarantee its accuracy or completeness.
In the event that there has been a change in an individual’s investment objective or financial situation, he/she is encouraged to consult with his/her investment professional.
Written Disclosure Statement. CMG is an SEC-registered investment adviser located in Malvern, Pennsylvania. Stephen B. Blumenthal is CMG’s founder and CEO. Please note: The above views are those of CMG and its CEO, Stephen Blumenthal, and do not reflect those of any sub-advisor that CMG may engage to manage any CMG strategy, or exclusively determines any internal strategy employed by CMG. A copy of CMG’s current written disclosure statement discussing advisory services and fees is available upon request or via CMG’s internet web site at www.cmgwealth.com/disclosures. CMG is committed to protecting your personal information. Click here to review CMG’s privacy policies.
See CMG Disclosures at the bottom of this page.
For more information about NDR, please visit at www.ndr.com.
NDR, Inc. (NDR), d.b.a. Ned Davis Research Group (NDRG), any NDRG affiliates or employees, or any third-party data provider, shall not have any liability for any loss sustained by anyone who has relied on the information contained in any NDRG publication. The data and analysis contained herein are provided "as is." NDRG disclaims any and all express or implied warranties, including, but not limited to, any warranties of merchantability, suitability or fitness for a particular purpose or use. NDRG's past recommendations and model results are not a guarantee of future results. This communication reflects our analysts' opinions as of the date of this communication and will not necessarily be updated as views or information change. All opinions expressed herein are subject to change without notice. NDRG or its affiliated companies or their respective shareholders, directors, officers and/or employees, may have long or short positions in the securities discussed herein and may purchase or sell such securities without notice. For NDRG's important additional disclaimers, refer to www.ndr.com/invest/public/copyright.html. Further distribution prohibited without prior permission. Copyright 2025 © NDR, Inc. All rights reserved.
The opinions are mine. Please know that there are no guarantees the above will prove correct, and that views are subject to change. See essential disclosures further below.