On My Radar: Look Up

June 12, 2026
By Steve Blumenthal
“I place economy among the first and most important virtues, and public debt as the
greatest of the dangers to be feared.”
- Thomas Jefferson
This week, SpaceX did what it does best: it launched. Not a rocket this time, but itself, pricing the largest IPO in history and rocketing more than 30% higher on its first day of trading. Look up from there, and you'll see a company built to reach orbit now valued like one. Look up from there, past the headlines, the whiplash, and the noise, and you'll see the bigger picture I want to talk about this week: the AI-bubble and why 1999-2000 keeps coming up.
This morning, gold is sitting near $4,200 an ounce, quietly absorbing most of a one-day, $400 round trip. On Thursday, it fell to its lowest level since November, then ripped higher in the afternoon when President Trump called off planned strikes on Iran and said a peace deal could be signed by the weekend. The S&P 500 offered a smaller-scale version of the same phenomenon: plunging on Wednesday amid a hot inflation report and fresh strikes on Iran, then surging nearly 2% Thursday on that same de-escalation headline. Oil moved in a mirror image of the stocks.
None of it had anything to do with earnings or productivity. The volatility had everything to do with what one person said about another country, twice, in 48 hours.
Step back from the headlines, and a different picture emerges. The U.S. equity market today is, by almost every measure I track, overvalued, overconcentrated, overowned, and overleveraged. The Shiller P/E sits near 41.54, the second-highest in history, behind only the peak before the 2000 crash. A small handful of stocks account for a share of the S&P 500's weight and return we've never seen before. Household equity allocations, as a share of net worth, are at record highs. And margin debt is at a record high, too. Source: Shiller P/E
Four warning lights, all flashing at once. I wrote about the concentration piece in detail in Cycles, Concentration, and Consequences a few weeks back, and nothing has changed since then. If anything, this week's whiplash is exactly the kind of environment where overleveraged, overowned markets get tested. Bottom line: Cracks are forming.
But here's the part that doesn't get nearly enough airtime, at least from our legislators: the U.S. government is approaching $40 trillion in debt, running deficits of nearly $2 trillion a year in an economy that isn't in recession. The interest expense on that debt, what we pay just to service it, is closing in on $1.3 trillion a year. Roughly one out of every four dollars Washington collects now goes toward interest expense alone, before a dollar is spent on anything else. And with Treasury rates rising, that expense is going up from here. I see very little political will in Washington, on either side, to address the problem. The incentives remain short-term, even as the consequences become increasingly long-term.
Where is the money coming from? The Fed has been printing it. Money creation - not tariffs, and not corporate greed - is the underlying driver of inflation and higher rates over time. If you want a single number that tells you whether this stays a slow burn or becomes a crisis, watch the 10-year Treasury yield. That yield is the match. The debt and deficit are the fuse. The bond and stock markets are the bomb. So far, the match hasn't touched the fuse, but it's getting closer, and this week's headline-driven swings show how sensitive that fuse has become.
A few things, as I see it, could change this picture without a painful adjustment. The first is AI: if it meaningfully lifts productivity and replaces enough labor, it could be disinflationary enough to offset the effects of money creation on prices and increase government tax revenue (a growth accelerator). The second is Treasury-backed stablecoins, which could become a genuinely new source of demand for U.S. debt just as traditional buyers, foreign central banks especially, grow less reliable.
Productivity gains from AI and demand for stablecoins may be the eye of the needle that Treasury Secretary Scott Bessent is trying to thread, with a Fed chairman in Kevin Warsh who sees the problem the same way. Whether that needle is wide enough is, to me, the most important question for investors over the next few years.
I hear you: "Steve, Stable Coins? You're dreaming." Maybe. It’s out there thinking, and at this point, a crypto step is a little bit above my pay grade. But here is what I know: Speaking at the Treasury Market Conference, Bessent described stablecoins and money-market funds as playing a growing role in shaping future U.S. debt demand, marking the first time a Treasury Secretary has publicly positioned stablecoins as a pillar of debt financing. More specifically, Bessent has suggested that Treasury could rebalance its issuance toward more short-term T-Bills to meet the demand that stablecoin reserves create, and has reportedly engaged directly with Tether and Circle on this. He's also cited analysis suggesting a fully operational federal stablecoin framework could generate up to $2 trillion in incremental Treasury demand, and he's publicly predicted the stablecoin market cap could reach $3 trillion by 2030, roughly a tenfold increase from current levels. Source: TheStreet
I think this is part of the Bessent / Warsh plan. And $2 trillion seems small if our deficit spending is that much per year, but we’ll see. We just can't yet know.
That's the picture I want to keep front and center this week, even as the headlines whip back and forth on Iran.
It doesn't mean we miss opportunities; there are many.
Grab that coffee. Let's get into it.
On My Radar:
OMR is for informational and educational purposes only. No consideration is given to your specific investment needs, objectives, or tolerances.
Please see the Important Disclosures at the bottom of this page. Reminder: This is not a recommendation to buy or sell any security. My views may change at any time. The information is for discussion and educational purposes only.
If you like what you are reading, you can subscribe for free.

The AI Bubble, and Why 1999-2000 Keeps Coming Up
Let’s start with the cracks I mentioned above, because the dot-com comparison is where they show up most clearly.
On valuation, the Shiller P/E of 41.54 is the second-highest reading in history. The only time it was higher was in the months right before the 2000 top, when it hit roughly 44. Source: Shillerpe
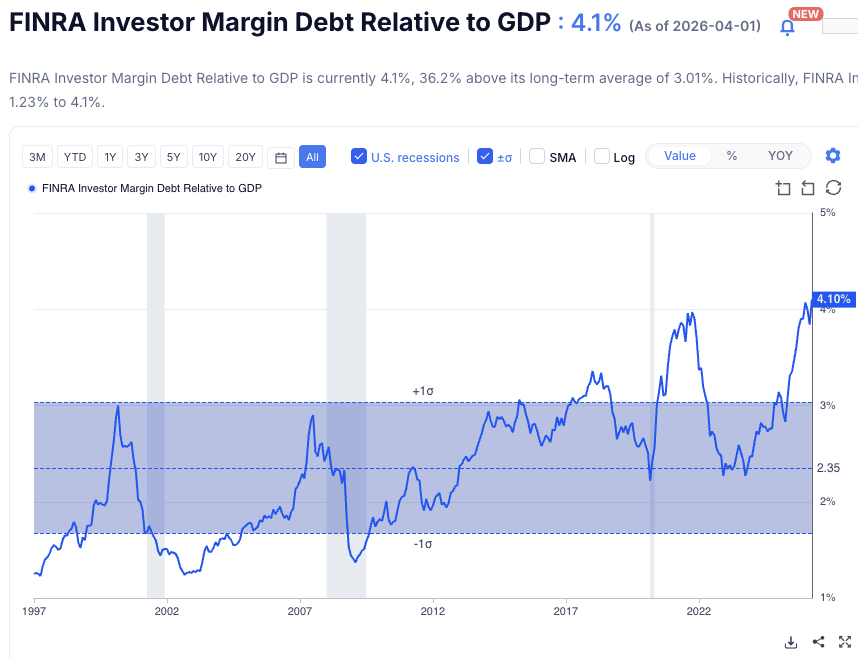
In terms of concentration, Nvidia alone now represents close to 8% of the S&P 500, and information technology as a sector accounts for about 35% of the index. FINRA Investor Margin Debt Relative to GDP reached 4.1% in April 2026, an all-time high in data going back decades. For context, margin debt peaked at 2.6% of GDP in 2000 at the dot-com top, and 2.5% of GDP in 2007 ahead of the financial crisis, and reached its prior record of 3.97% of GDP set in October 2021. Source: GuruFocus
Here is a look:
Here's where it gets more interesting. The bull case in 1999 was that the internet would change everything, and it did, just not on the timeline or for the companies the market was pricing in at the time. Many of the highest-flying names of that era went to zero. But the infrastructure that was overbuilt during that bubble, the fiber optic networks in particular, ended up being incredibly valuable a decade later, just owned by different companies at very different prices.
I suspect we're looking at something similar with AI infrastructure today. The data centers, the power generation, the chips, much of it will prove to be genuinely transformative and genuinely useful. The question isn't whether AI is real. It's whether the prices being paid today for that future are realistic, and whether the companies collecting that capital today are the ones who will still be standing when the bill comes due.
The other difference worth noting is the macro backdrop, and this is where the two halves of this letter connect. In 1999, the federal government was running a surplus. Today, we're running close to $2 trillion deficits with debt approaching $40 trillion. A bubble deflating into a fiscally healthy government is a very different event than a bubble deflating into a government that is already stretched.
That's part of why I keep coming back to the 10-year yield as the match. If this bubble unwinds the way the last one did, with a flight to the safety of Treasuries, that's one outcome. If it unwinds with investors questioning the safety of Treasuries themselves, given where the debt and deficit picture stands, that's the financial market bomb I mentioned above going off in a very different way.
Let’s next look at SpaceX.
Opinions are subject to change. Not a recommendation to buy or sell any security. Please note that the information provided is not recommended for buying or selling any security and is provided for discussion purposes only.
* No guarantees; all investing involves risk. Views are subject to change. TRADE SIGNALS SUBSCRIPTION ACKNOWLEDGEMENT / IMPORTANT DISCLOSURES
As always, this is not investment advice. For discussion purposes only. Reach out to us if you have any questions.
Views are subject to change. Not a recommendation to buy or sell any security. Please note that the information provided is not recommended for buying or selling any security and is provided for discussion purposes only. Current viewpoints are subject to change. Please note that the information provided is not recommended for buying or selling any security and is provided for discussion purposes only. See important CMG disclosures below.
If you like what you are reading, click on the link and share it with a friend (it’s free).
CLICK HERE TO SUBSCRIBE TO ON MY RADAR - IT’S FREE
Not a recommendation to buy or sell any security. Please note that the information provided is not intended to recommend buying or selling any security and is for discussion purposes only. Current viewpoints are subject to change. Please note that the information provided is not recommended for buying or selling any security and is provided for discussion purposes only.
SpaceX Goes Public: The Story Behind the Headline
This week gave us a live example of just how much capital is being pulled toward this theme, and the SpaceX IPO is a good lens for understanding it.
SpaceX priced its IPO Thursday night at $135 a share, raising roughly $75 billion at a valuation of about $1.75 trillion. To put that in perspective, the previous record holder for the largest IPO ever was Saudi Aramco in 2019, which raised about $25.6 billion. SpaceX raised nearly three times that, in a single offering, for a company that lost almost $5 billion on a GAAP basis in 2025, even as revenue grew 33% to $18.7 billion.
The story underneath the story is Starlink. Starlink generated $11.4 billion in revenue and $4.4 billion in operating profit last year, with a 63% EBITDA margin, and it's the only part of the SpaceX business that's currently profitable. The rocket business and the Starship development program are still cash consumers, and the xAI division, which merged into SpaceX earlier this year and makes the Grok AI models, posted a $6.4 billion operating loss in 2025. So what the market priced at $1.75 trillion this week is really a bet on Starlink's growth trajectory (subscribers roughly doubled from 4.5 million to over 10 million in just over a year), carrying the rest of the business through its investment phase.
Then there's the index mechanics, which is really why this matters for anyone holding a broad index fund, whether they've ever thought about SpaceX or not. SpaceX is expected to enter the Nasdaq 100 within about two weeks of its listing, which, by some estimates, could force $22 to $27 billion in mechanical buying from every fund that tracks QQQ. MSCI inclusion is targeted even sooner. None of that buying has anything to do with valuation. It's simply the funds required to hold the index and do what their mandate requires. This is the same mechanism that has driven so much of the concentration story I wrote about in Cycles, Concentration, and Consequences, just playing out in real time with a single company.
Update, Friday afternoon 2 pm ET: SpaceX (ticker SPCX) opened for trading around noon and is up roughly 38% from that $135 IPO price, putting shares around $186 and pushing the implied valuation from about $1.75 trillion to somewhere in the neighborhood of $2.4 trillion. For context, that's a single-day gain of roughly $650 billion in market value, more than the entire market cap of most of the companies in the S&P 500.
A few things stand out. First, this tells you something about the relationship between supply and demand. With only about 4% of shares actually floating, and roughly 30% of the deal allocated to retail, a 38% pop on day one suggests the deal could have been priced meaningfully higher and still cleared. Second, it makes the index inclusion story even bigger than I described above. If SPCX enters the Nasdaq 100 and gets MSCI inclusion at a $2.4 trillion valuation rather than $1.75 trillion, the mechanical buying from index funds scales up accordingly, somewhere in the range of $30 billion or more by some estimates, all of it indifferent to price.
Third, and this is the part I keep coming back to, a 38% first-day pop on a company that lost nearly $5 billion last year is itself a data point for the broader argument I'm making in this letter. This is what an overowned, overleveraged, momentum-driven market looks like in real time. None of this means SpaceX isn't a remarkable company; it is. I’m excited, I’m interested in building a position over time. But the gap between "remarkable company" and "remarkable price" is exactly the gap I'd encourage you to keep in mind, both for SPCX specifically and for the index funds that will soon be forced to own it at whatever price the market decides today.
Opinions are subject to change. Not a recommendation to buy or sell any security. Please note that the information provided is not recommended for buying or selling any security and is provided for discussion purposes only.
Where We're Finding Opportunity
Given everything above, overvalued, overconcentrated, overowned, and overleveraged at the index level, with a debt and deficit backdrop that isn't going away, our work has increasingly focused on areas that sit outside the most crowded trades, but that still have a credible, durable demand story behind them. A few areas we continue to favor (NOT A RECOMMENDATION FOR YOU TO BUY OR SELL ANY SECURITY).
Robotics - This is the part of the AI story that I think is most underappreciated relative to the data center buildout. If AI is going to show up in productivity numbers in a meaningful way, much of that may come through robotics and automation in physical industries, not just software. We see this as a multi-year theme that's still in the early innings.
Quantum computing - Still speculative, still early-stage for most names in this space, but the strategic importance to both commercial and defense applications means government and corporate capital continues to flow in regardless of where we are in the broader market cycle. We treat this as a smaller, venture-like allocation within portfolios.
Aerospace and defense - Geopolitical tensions, whether it's Iran, China, or elsewhere, aren't going away regardless of how the Iran challenges resolve. Defense budgets globally have been moving in one direction. This sector also tends to have less correlation to the AI/mega-cap trade, which is valuable from a diversification standpoint.
Strategic metals and mining - The energy transition, defense production, and AI infrastructure all compete for the same set of inputs: copper, uranium, rare earths, and other critical minerals. Supply has been underinvested for years, and the geopolitical concentration of where these materials are produced and processed, much of it tied to China, adds a layer of strategic urgency on top of the simple supply and demand picture.
Infrastructure - Power generation and grid capacity are the binding constraints on the AI buildout, not chips. That's created a wave of investment in everything from natural gas to nuclear to transmission.
Oil and natural gas - Even setting aside the Iran-driven volatility we've seen this week, the structural picture for energy demand, driven in part by AI data center power needs, supports a higher baseline than the market has been pricing for much of the last few years. Energy also remains one of the few sectors trading at reasonable valuations relative to its own history.
Specialty finance - As traditional banks remain constrained by regulation, specialty finance companies, private credit, asset-based lending, and similar niches have stepped into gaps in the lending market. This is an area that requires real due diligence, given how much capital has flowed in (we wrote at length about the risks in private credit back in March), but selectively, there are attractive risk-adjusted opportunities to consider.
Value: High and Growing Dividend Payers - Fairly valued companies with strong free cash flow, low debt, and management teams with long track records of raising their dividend year after year. I touched on this group last week in OMR, under the section titled, Valuations, Buffett and Value.” You can find it here.
The common thread across all of these is that they don't depend on the AI mega-cap trade continuing at its current pace to work. Some benefit from it, infrastructure and strategic metals especially, but none of them require it. In a market this concentrated, that kind of independence is itself a form of risk management.
Opinions are subject to change. Not a recommendation to buy or sell any security. Please note that the information provided is not recommended for buying or selling any security and is provided for discussion purposes only.
Trade Signals: June 11, 2026 Update
Market Commentary
Here’s the weekly recap through Thursday:
Subscribers - link below.
The Dashboard of Indicators follows next.
Trade Signals - subscribers only
The Indicators Dashboard - Stocks, Investor Sentiment, Bonds, Commodities, Currencies, and Gold
Valuations and Subsequent 10-year Returns
Supporting Charts with Explanations
About Trade Signals - Trade Signals is a paid subscription service that posts the daily, weekly, and monthly trends in the markets (and more). Free for CMG clients. Not a recommendation to buy or sell any security. For discussion purposes only.
“Extreme patience combined with extreme decisiveness. You may call that our investment process. Yes, it’s that simple.” – Charlie Munger

TRADE SIGNALS SUBSCRIPTION ACKNOWLEDGEMENT / IMPORTANT DISCLOSURES
The views expressed herein are solely those of Steve Blumenthal as of the date of this report and are subject to change without notice. Not a recommendation to buy or sell any security.
Please note that the information provided is not recommended for buying or selling any security and is provided for discussion purposes only. Current viewpoints are subject to change. Please note that the information provided is not recommended for buying or selling any security and is provided for discussion purposes only.
Personal Note: The World Cup
The World Cup kicked off last night, and I was glued to the opening match, Mexico against South Africa in Mexico City. I'm a big fan of how Mexico plays, quick, technical, fun to watch. They won 2-0.
Tonight is the one I've been waiting for. The U.S. plays Paraguay at 9 pm ET, and I feel like a kid again, the can't-sit-still kind. It’s fun to share the excitement with Susan and our children.
Later this month, I'll be in Atlanta to watch Haiti play Morocco. And on July 4th, Susan and I will be at the Round of 16 game here in Philadelphia. Ticket prices have been coming down, so if you've been on the fence, go. Even if you're not a soccer fan, it's a once-in-a-lifetime experience.
For predictions, I like England, Argentina, Spain, or France. And admittedly, other than the U.S. (which will take a miracle), I’m pulling for England. But really, I'm looking forward to watching great soccer.
What stays with me most isn't who wins. Earlier in this letter, I wrote about looking up, past the headlines and the noise, to the bigger picture. For a month, the whole world is doing something similar, looking up from its own arguments and conflicts to watch the same games, root for their country, and share the same moments. That's worth something. We could use more of it.
I’ll be hosting a casual dinner in Atlanta for clients and OMR readers on Thursday evening, June 25.
Space is limited. If you are interested in joining, please email Amy@cmgwealth.com.

Source: Discoveratlanta.com
Best of luck to your favorite team. It is going to be a fun six weeks!
With kind regards,
Steve
CLICK HERE TO SUBSCRIBE TO ON MY RADAR - IT’S FREE
You can share this letter on X by clicking here.
You can share this letter on LinkedIn by clicking here.
Subscribe to OMR for free by clicking the photo.
Stephen B. Blumenthal
Executive Chairman & CIO
CMG Capital Management Group, Inc.
75 Valley Stream Parkway, Suite 201,
Malvern, PA 19355
CMG Customer Relationship Summary (Form CRS)
Metric-Financial, LLC Customer Relationship Summary (Form CRS)

Stephen Blumenthal founded CMG Capital Management Group in 1992 and serves today as its Executive Chairman and CIO. Steve authors a free weekly e-letter entitled, “On My Radar.” Steve shares his views on macroeconomic research, valuations, portfolio construction, asset allocation and risk management. Author of Forbes Book: On My Radar, Navigating Stock Market Cycles.
Follow Steve on X @SBlumenthalCMG and LinkedIn.
IMPORTANT DISCLOSURE INFORMATION
This document is prepared by CMG Capital Management Group, Inc. (“CMG”) and is circulated for informational and educational purposes only. There is no consideration given to the specific investment needs, objectives, or tolerances of any of the recipients. Additionally, CMG’s actual investment positions may, and often will, vary from its conclusions discussed herein based on any number of factors, such as client investment restrictions, portfolio rebalancing, and transaction costs, among others. Recipients should consult their own advisors, including tax advisors, before making any investment decision. This material is for informational and educational purposes only and is not an offer to sell or the solicitation of an offer to buy the securities or other instruments mentioned. This material does not constitute a personal recommendation or take into account the particular investment objectives, financial situations, or needs of individual investors which are necessary considerations before making any investment decision. Investors should consider whether any advice or recommendation in this research is suitable for their particular circumstances and, where appropriate, seek professional advice, including legal, tax, accounting, investment, or other advice. The views expressed herein are solely those of Steve Blumenthal as of the date of this report and are subject to change without notice.
Investing involves risk.
This letter may contain forward-looking statements relating to the objectives, opportunities, and future performance of the various investment markets, indices, and investments. Forward-looking statements may be identified by the use of such words as; “believe,” anticipate,” “planned,” “potential,” and other similar terms. Examples of forward-looking statements include, but are not limited to, estimates with respect to financial condition, results of operations, and success or lack of success of any particular market, index, investment, or investment strategy. All are subject to various factors, including, but not limited to, general and local economic conditions, changing levels of competition within certain industries and markets, changes in legislation or regulation, Federal Reserve policy, and other economic, competitive, governmental, regulatory, and technological factors affecting markets, indices, investments, investment strategy and portfolio positioning that could cause actual results to differ materially from projected results. Such statements are forward-looking in nature and involve a number of known and unknown risks, uncertainties, and other factors, and accordingly, actual results may differ materially from those reflected or contemplated in such forward-looking statements. Investors are cautioned not to place undue reliance on any forward-looking statements or examples. All statements made herein speak only as of the date that they were made. Investing is inherently risky and all investing involves the potential risk of loss.
Past performance does not guarantee or indicate future results. Different types of investments involve varying degrees of risk, and there can be no assurance that the future performance of any specific investment, investment strategy, or product (including the investments and/or investment strategies recommended or undertaken by CMG), or any non-investment related content, made reference to directly or indirectly in this commentary will be profitable, equal any corresponding indicated historical performance level(s), be suitable for your portfolio or individual situation or prove successful. Due to various factors, including changing market conditions and/or applicable laws, the content may no longer be reflective of current opinions or positions. Moreover, you should not assume that any discussion or information contained in this commentary serves as the receipt of, or as a substitute for, personalized investment advice from CMG. Please remember to contact CMG, in writing, if there are any changes in your personal/financial situation or investment objectives for the purpose of reviewing/evaluating/revising our previous recommendations and/or services, or if you would like to impose, add, or to modify any reasonable restrictions to our investment advisory services. Unless, and until, you notify us, in writing, to the contrary, we shall continue to provide services as we do currently. CMG is neither a law firm, nor a certified public accounting firm, and no portion of the commentary content should be construed as legal or accounting advice.
No portion of the content should be construed as an offer or solicitation for the purchase or sale of any security. References to specific securities, investment programs or funds are for illustrative purposes only and are not intended to be, and should not be interpreted as recommendations to purchase or sell such securities.
This presentation does not discuss, directly or indirectly, the amount of the profits or losses realized or unrealized, by any CMG client from any specific funds or securities. Please note: In the event that CMG references performance results for an actual CMG portfolio, the results are reported net of advisory fees and inclusive of dividends. The performance referenced is that as determined and/or provided directly by the referenced funds and/or publishers, has not been independently verified, and does not reflect the performance of any specific CMG client. CMG clients may have experienced materially different performance based upon various factors during the corresponding time periods. See in links provided citing limitations of hypothetical back-tested information. Past performance cannot predict or guarantee future performance. Not a recommendation to buy or sell. Please talk to your advisor.
Information herein has been obtained from sources believed to be reliable, but we do not warrant its accuracy. This document is general communication and is provided for informational and/or educational purposes only. None of the content should be viewed as a suggestion that you take or refrain from taking any action nor as a recommendation for any specific investment product, strategy, or other such purposes.
In a rising interest rate environment, the value of fixed-income securities generally declines, and conversely, in a falling interest rate environment, the value of fixed-income securities generally increases. High-yield securities may be subject to heightened market, interest rate, or credit risk and should not be purchased solely because of the stated yield. Ratings are measured on a scale that ranges from AAA or Aaa (highest) to D or C (lowest). Investment-grade investments are those rated from highest down to BBB- or Baa3.
NOT FDIC INSURED. MAY LOSE VALUE. NO BANK GUARANTEE.
Certain information contained herein has been obtained from third-party sources believed to be reliable, but we cannot guarantee its accuracy or completeness.
In the event that there has been a change in an individual’s investment objective or financial situation, he/she is encouraged to consult with his/her investment professional.
Written Disclosure Statement. CMG is an SEC-registered investment adviser located in Malvern, Pennsylvania. Stephen B. Blumenthal is CMG’s founder and CEO. Please note: The above views are those of CMG and its CEO, Stephen Blumenthal, and do not reflect those of any sub-advisor that CMG may engage to manage any CMG strategy, or exclusively determines any internal strategy employed by CMG. A copy of CMG’s current written disclosure statement discussing advisory services and fees is available upon request or via CMG’s internet web site at www.cmgwealth.com/disclosures. CMG is committed to protecting your personal information. Click here to review CMG’s privacy policies.
See CMG Disclosures at the bottom of this page.
For more information about NDR, please visit at www.ndr.com.
NDR, Inc. (NDR), d.b.a. Ned Davis Research Group (NDRG), any NDRG affiliates or employees, or any third-party data provider, shall not have any liability for any loss sustained by anyone who has relied on the information contained in any NDRG publication. The data and analysis contained herein are provided "as is." NDRG disclaims any and all express or implied warranties, including, but not limited to, any warranties of merchantability, suitability or fitness for a particular purpose or use. NDRG's past recommendations and model results are not a guarantee of future results. This communication reflects our analysts' opinions as of the date of this communication and will not necessarily be updated as views or information change. All opinions expressed herein are subject to change without notice. NDRG or its affiliated companies or their respective shareholders, directors, officers and/or employees, may have long or short positions in the securities discussed herein and may purchase or sell such securities without notice. For NDRG's important additional disclaimers, refer to www.ndr.com/invest/public/copyright.html. Further distribution prohibited without prior permission. Copyright 2025 © NDR, Inc. All rights reserved.