On My Radar: The Fed’s Fight - Round Nine

September 18, 2026
By Steve Blumenthal
“I can complain because rose bushes have thorns or rejoice because thorn bushes have roses.”
— Sir John Templeton
Two central banks that hadn't moved in years both moved this week. Two of the world’s heavyweight prize fighters, sizing each other up in round nine of a twelve-round fight. A knockout is not the goal; the hope is for both to be standing when the final bell rings.
Wednesday, the Fed hiked a quarter point to 3.75%–4.00%, its first increase since 2023, with Chairman Kevin Warsh saying inflation has been "too high for too long." Friday, the Bank of Japan followed with a hike of its own to 1.25%, a 31-year high and its fastest pace since normalization began.
That pairing is worth sitting with. Back in June, in OMR: Zulauf – Gundlach, I highlighted that the yen carry trade is one of the most underappreciated sources of global liquidity, and that the real risk was never Japan's debt; it's Japanese capital coming home. The BOJ just handed that capital one more reason to.
Several of the voices I trust are converging on the same read: the Fed is following the market, not leading it. Peter Boockvar noted the bond market priced in this hike before the Fed acted. Jeffrey Gundlach went further on CNBC, saying Wednesday's quarter-point wasn't enough. He wanted "stun and done," a half-point move to true up to the 2-year Treasury, which is sitting 100+ basis points above fed funds.
As Meb Faber put it in a tweet this week, “The only guide the Fed needs.”
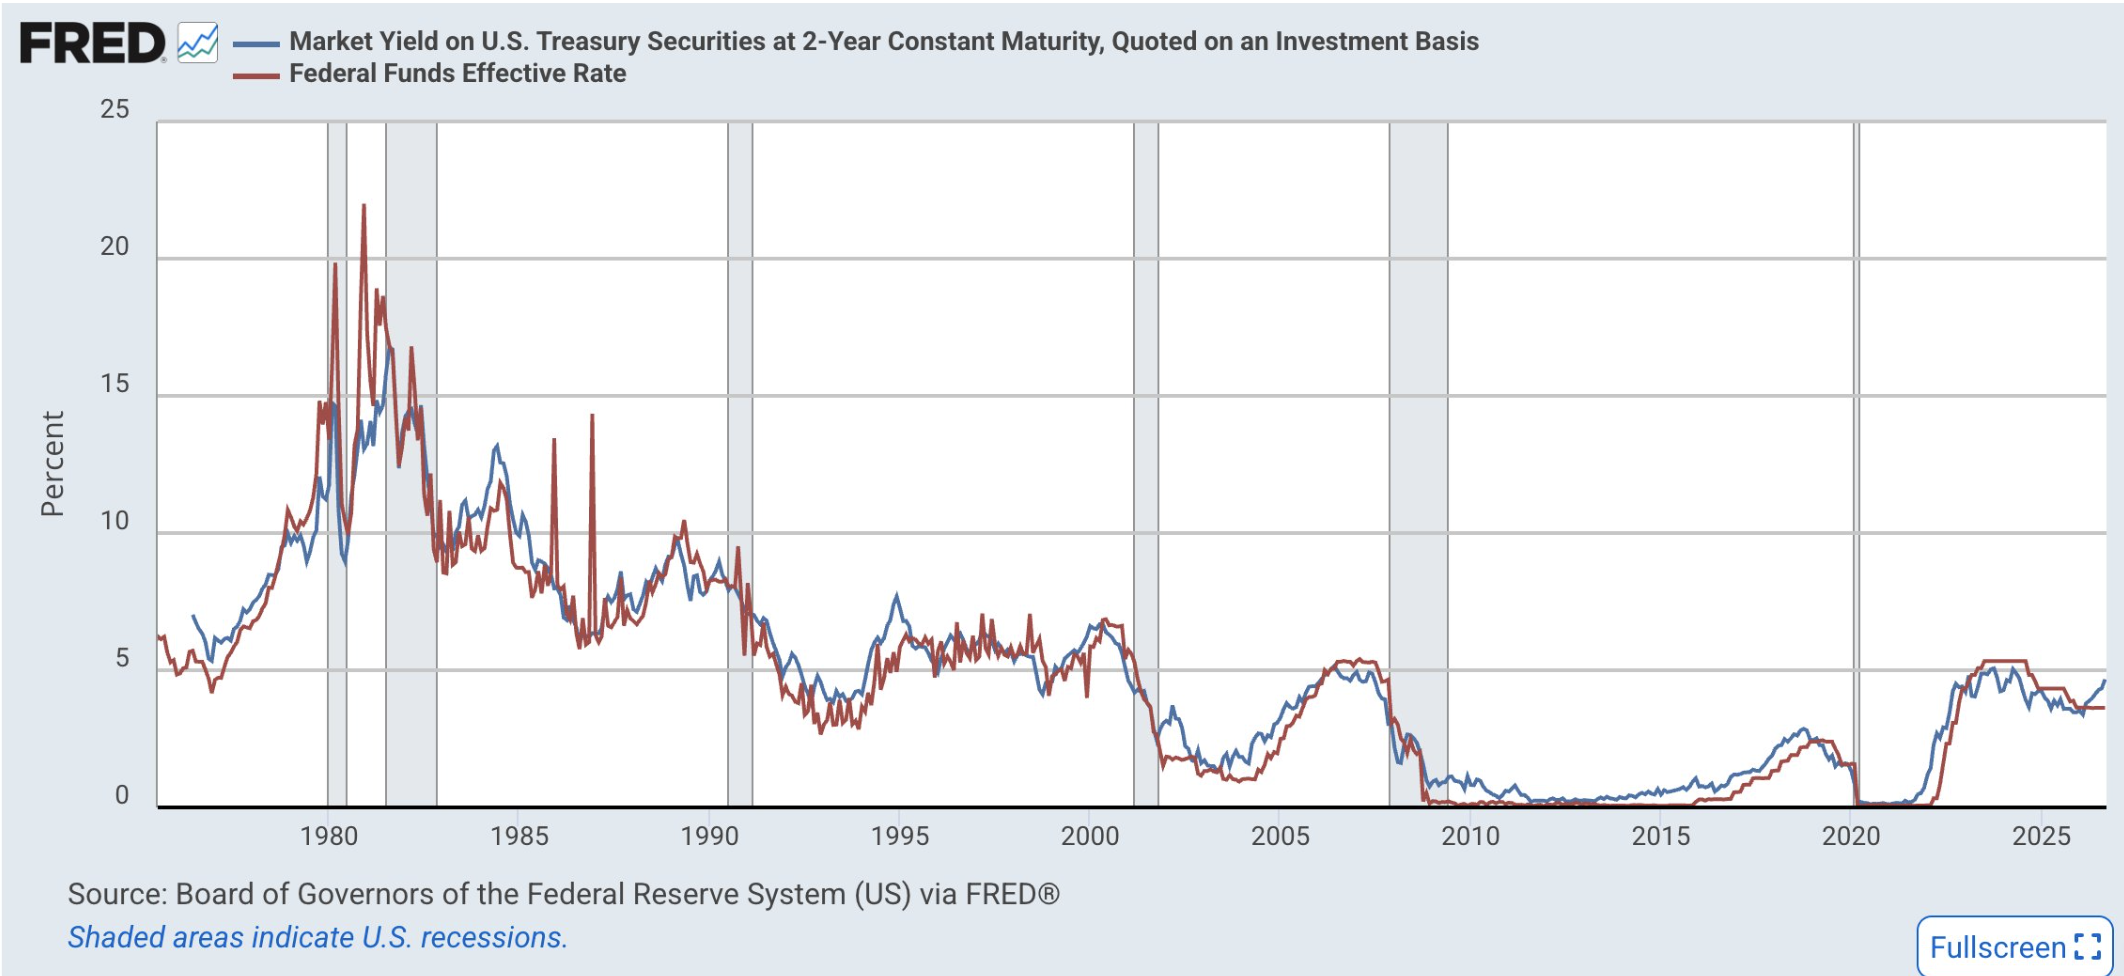
Source: FRED, hat tip to @MebFaber
Luke Gromen's framing is the sharpest: with true U.S. interest expense near 105% of federal receipts, Warsh doesn't get to choose inflation-fighting over debt-servicing. He has to pick the dollar or the bond market, not both.
Grab your coffee, find your favorite chair. You’ll find a selection of charts that may prove helpful as we move closer to the final round of the fight. Think risk management tools to keep on your radar. Thorns, then roses…
On My Radar: The Fed’s Fight Begins
The 10-year - The Yen Carry Trade - The Signals To Watch
John Ray – I'm Calling the Bond Market Top (Low in Yields); It's Got to Be Over — February 28, 2020
Trade Signals: September 17, 2026
Personal Note: Brotherhood and Luke
OMR is for informational and educational purposes only. No consideration is given to your specific investment needs, objectives, or tolerances.
Please see the Important Disclosures at the bottom of this page. Reminder: This is not a recommendation to buy or sell any security. My views may change at any time. The information is for discussion and educational purposes only.
If you like what you are reading, you can subscribe for free.

The 10-year - The Yen Carry Trade - The Signals To Watch
This week was a live test of everything I've been tracking all year. The Fed hiked to 3.75%–4.00%, its first increase since 2023. Two days later, the BOJ hiked to 1.25%, a 31-year high. Two central banks moved in the same week for related reasons, and the 10-year Treasury and the yen carry trade are the threads tying them together.
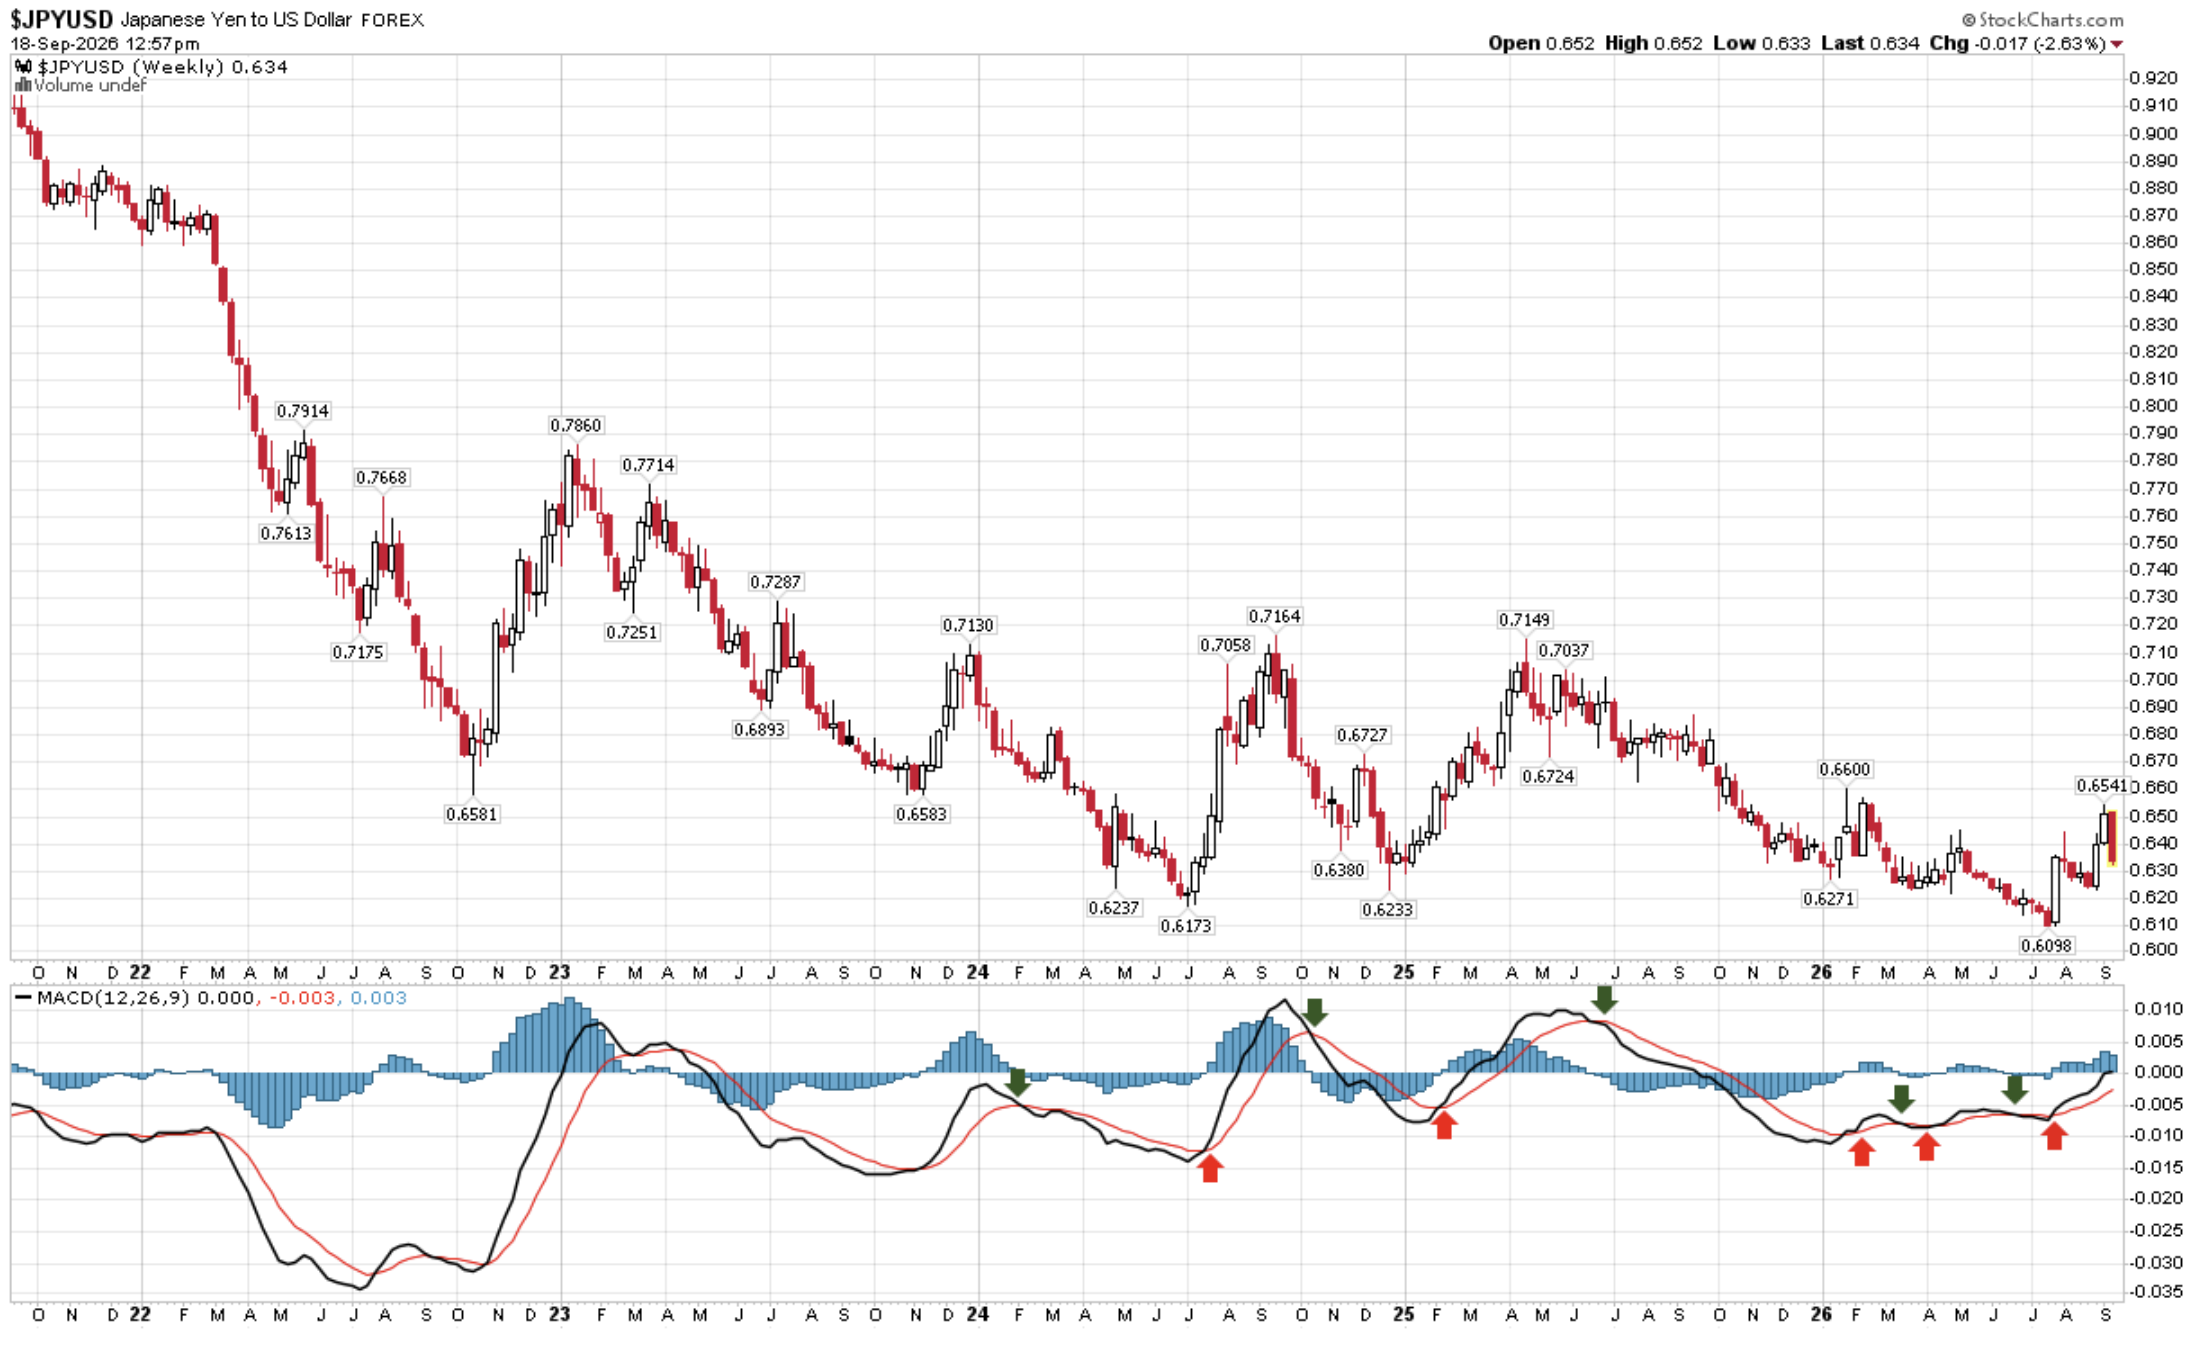
The Yen — A falling yen-to-dollar ratio is bullish for global liquidity; a rising yen is bearish. Watch the MACD for the turn: green arrows have marked past drops in the yen, red the rebounds. The current trend is up (red arrow bottom right).
It’s notable that the yen declined relative to the dollar. That is not the reaction the Bank of Japan desired. They will need to hike more, which risks unwinding the leveraged yen carry trade. Keep a close eye on this chart!
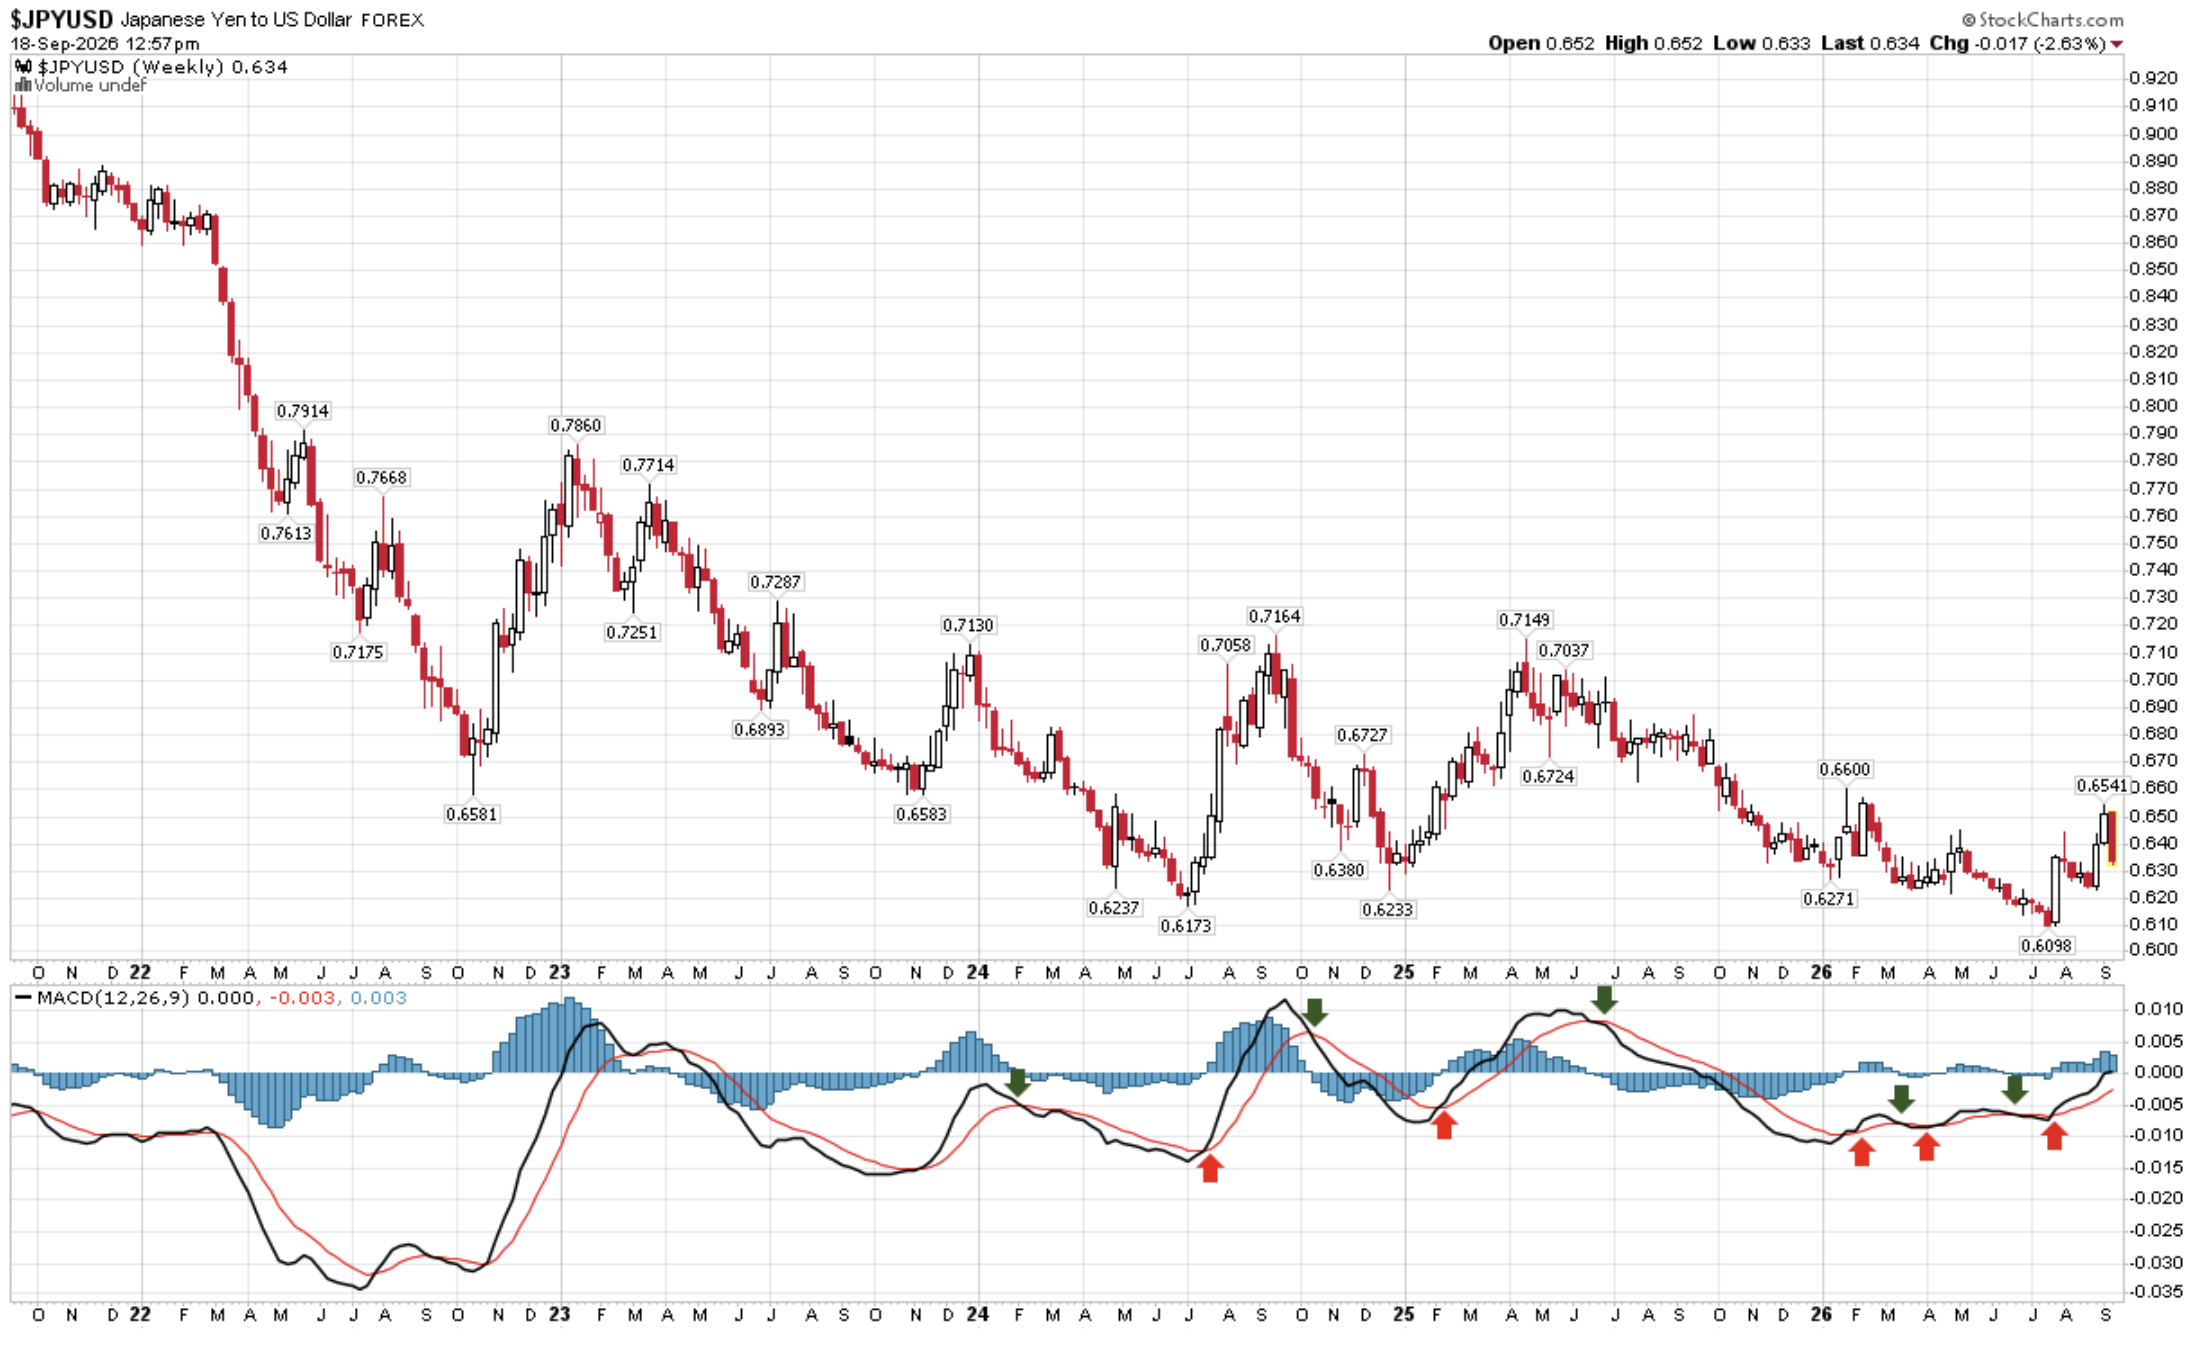
Source: StockCharts.com, CMG annotations (arrows)
The 10-Year Treasury yield weekly MACD trend remains up. I touched 5.01% this week and is yielding 4.99% at the time of this writing. I continue to believe we may see 5.5% before the month ends. If so, that will get everyone’s attention.
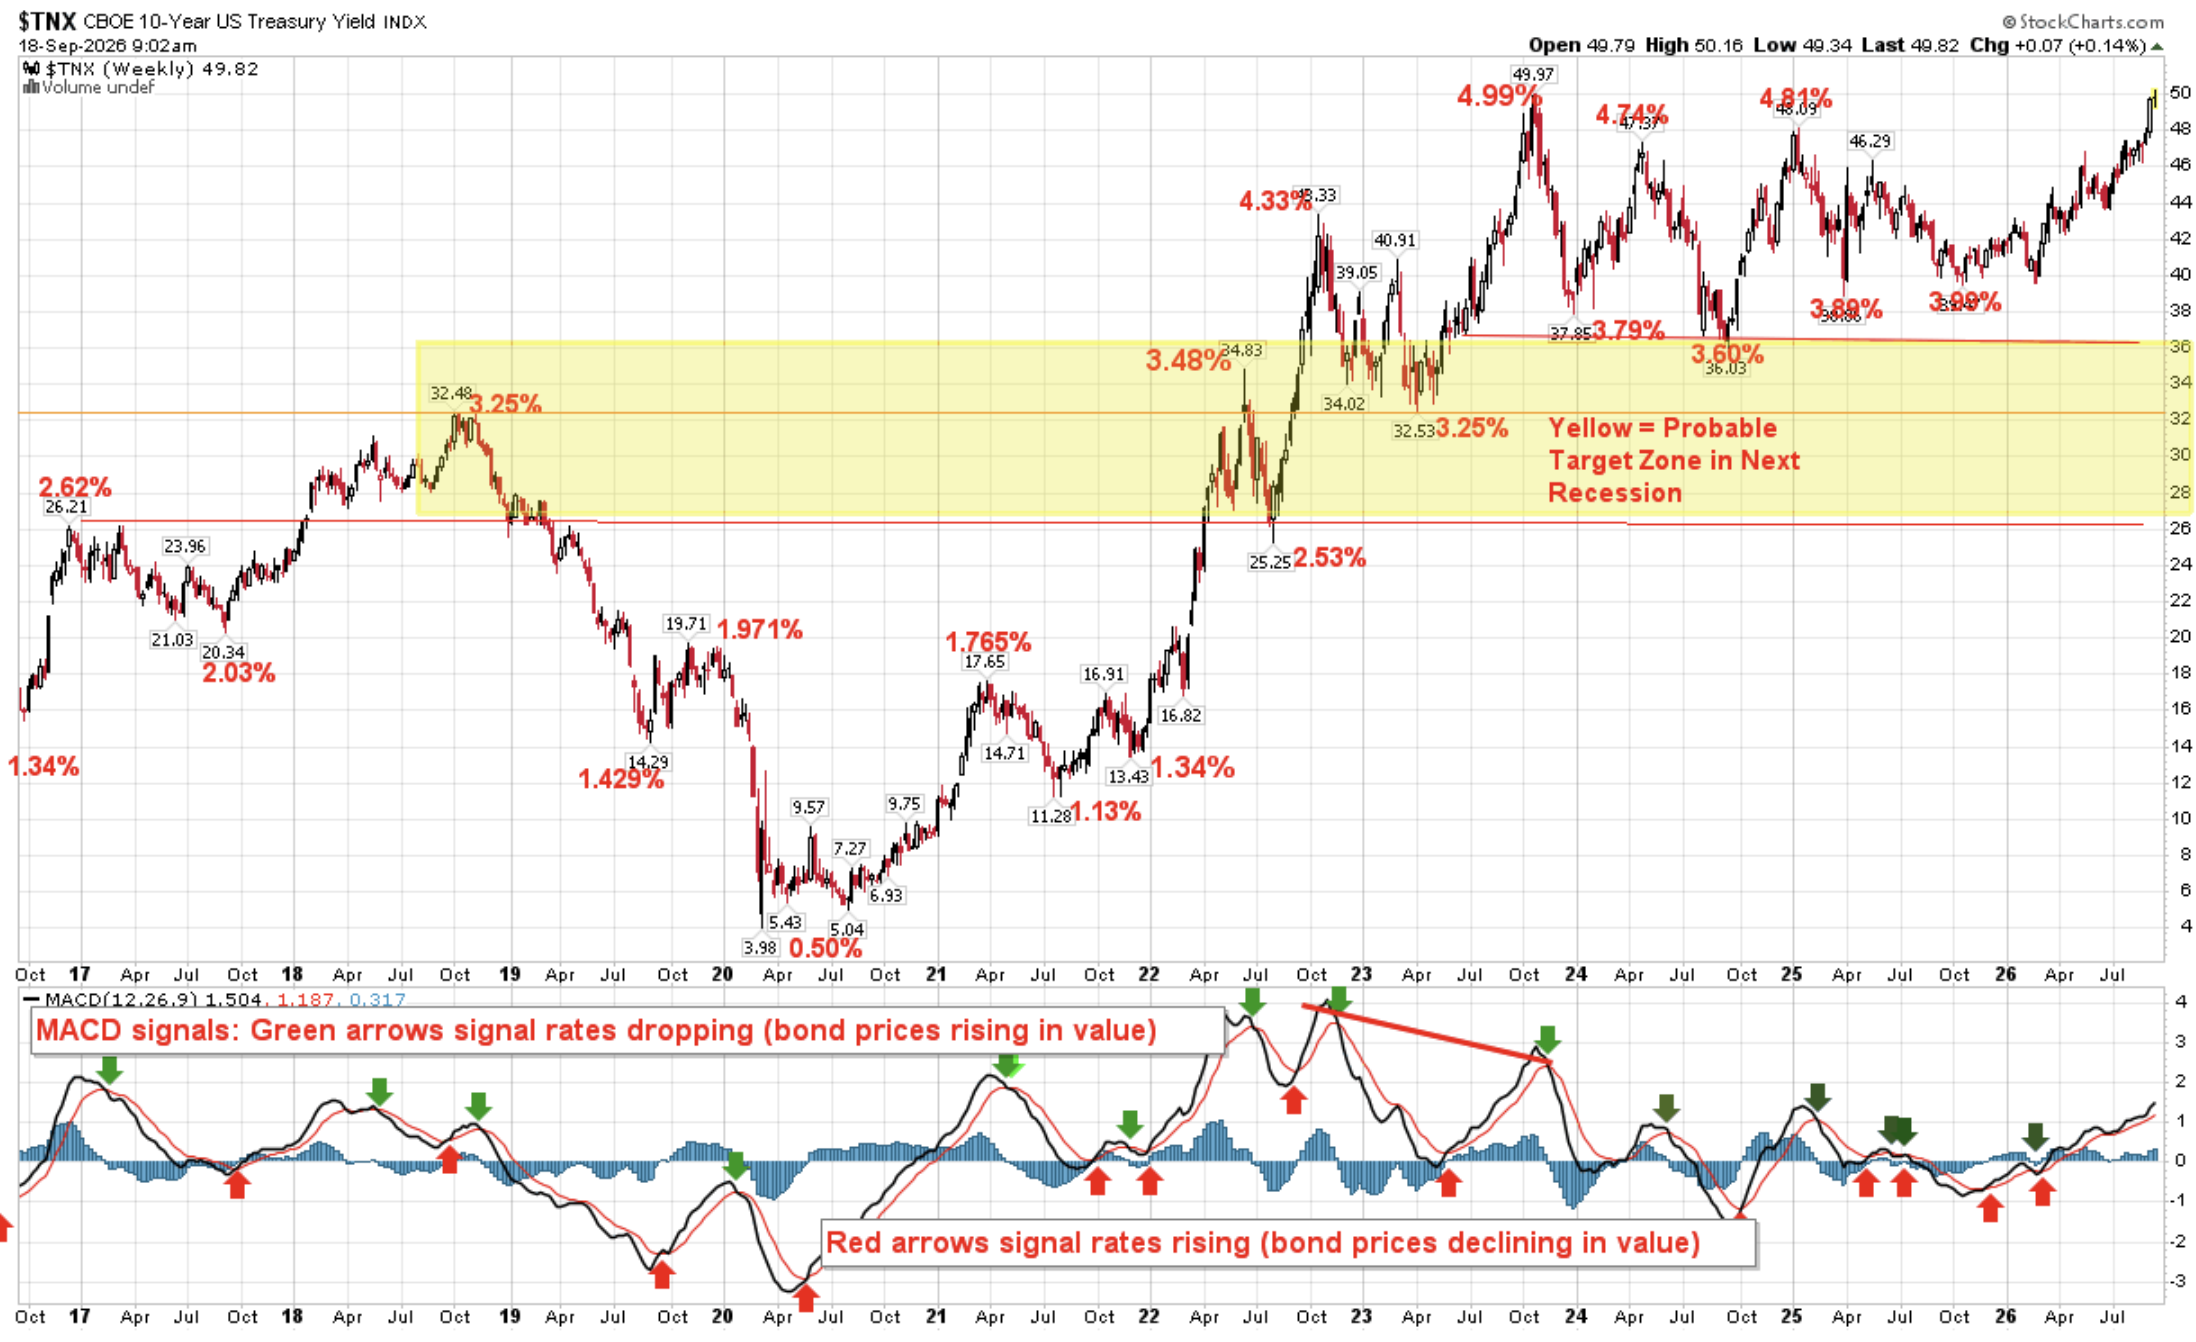
Source: StockCharts.com, CMG annotations
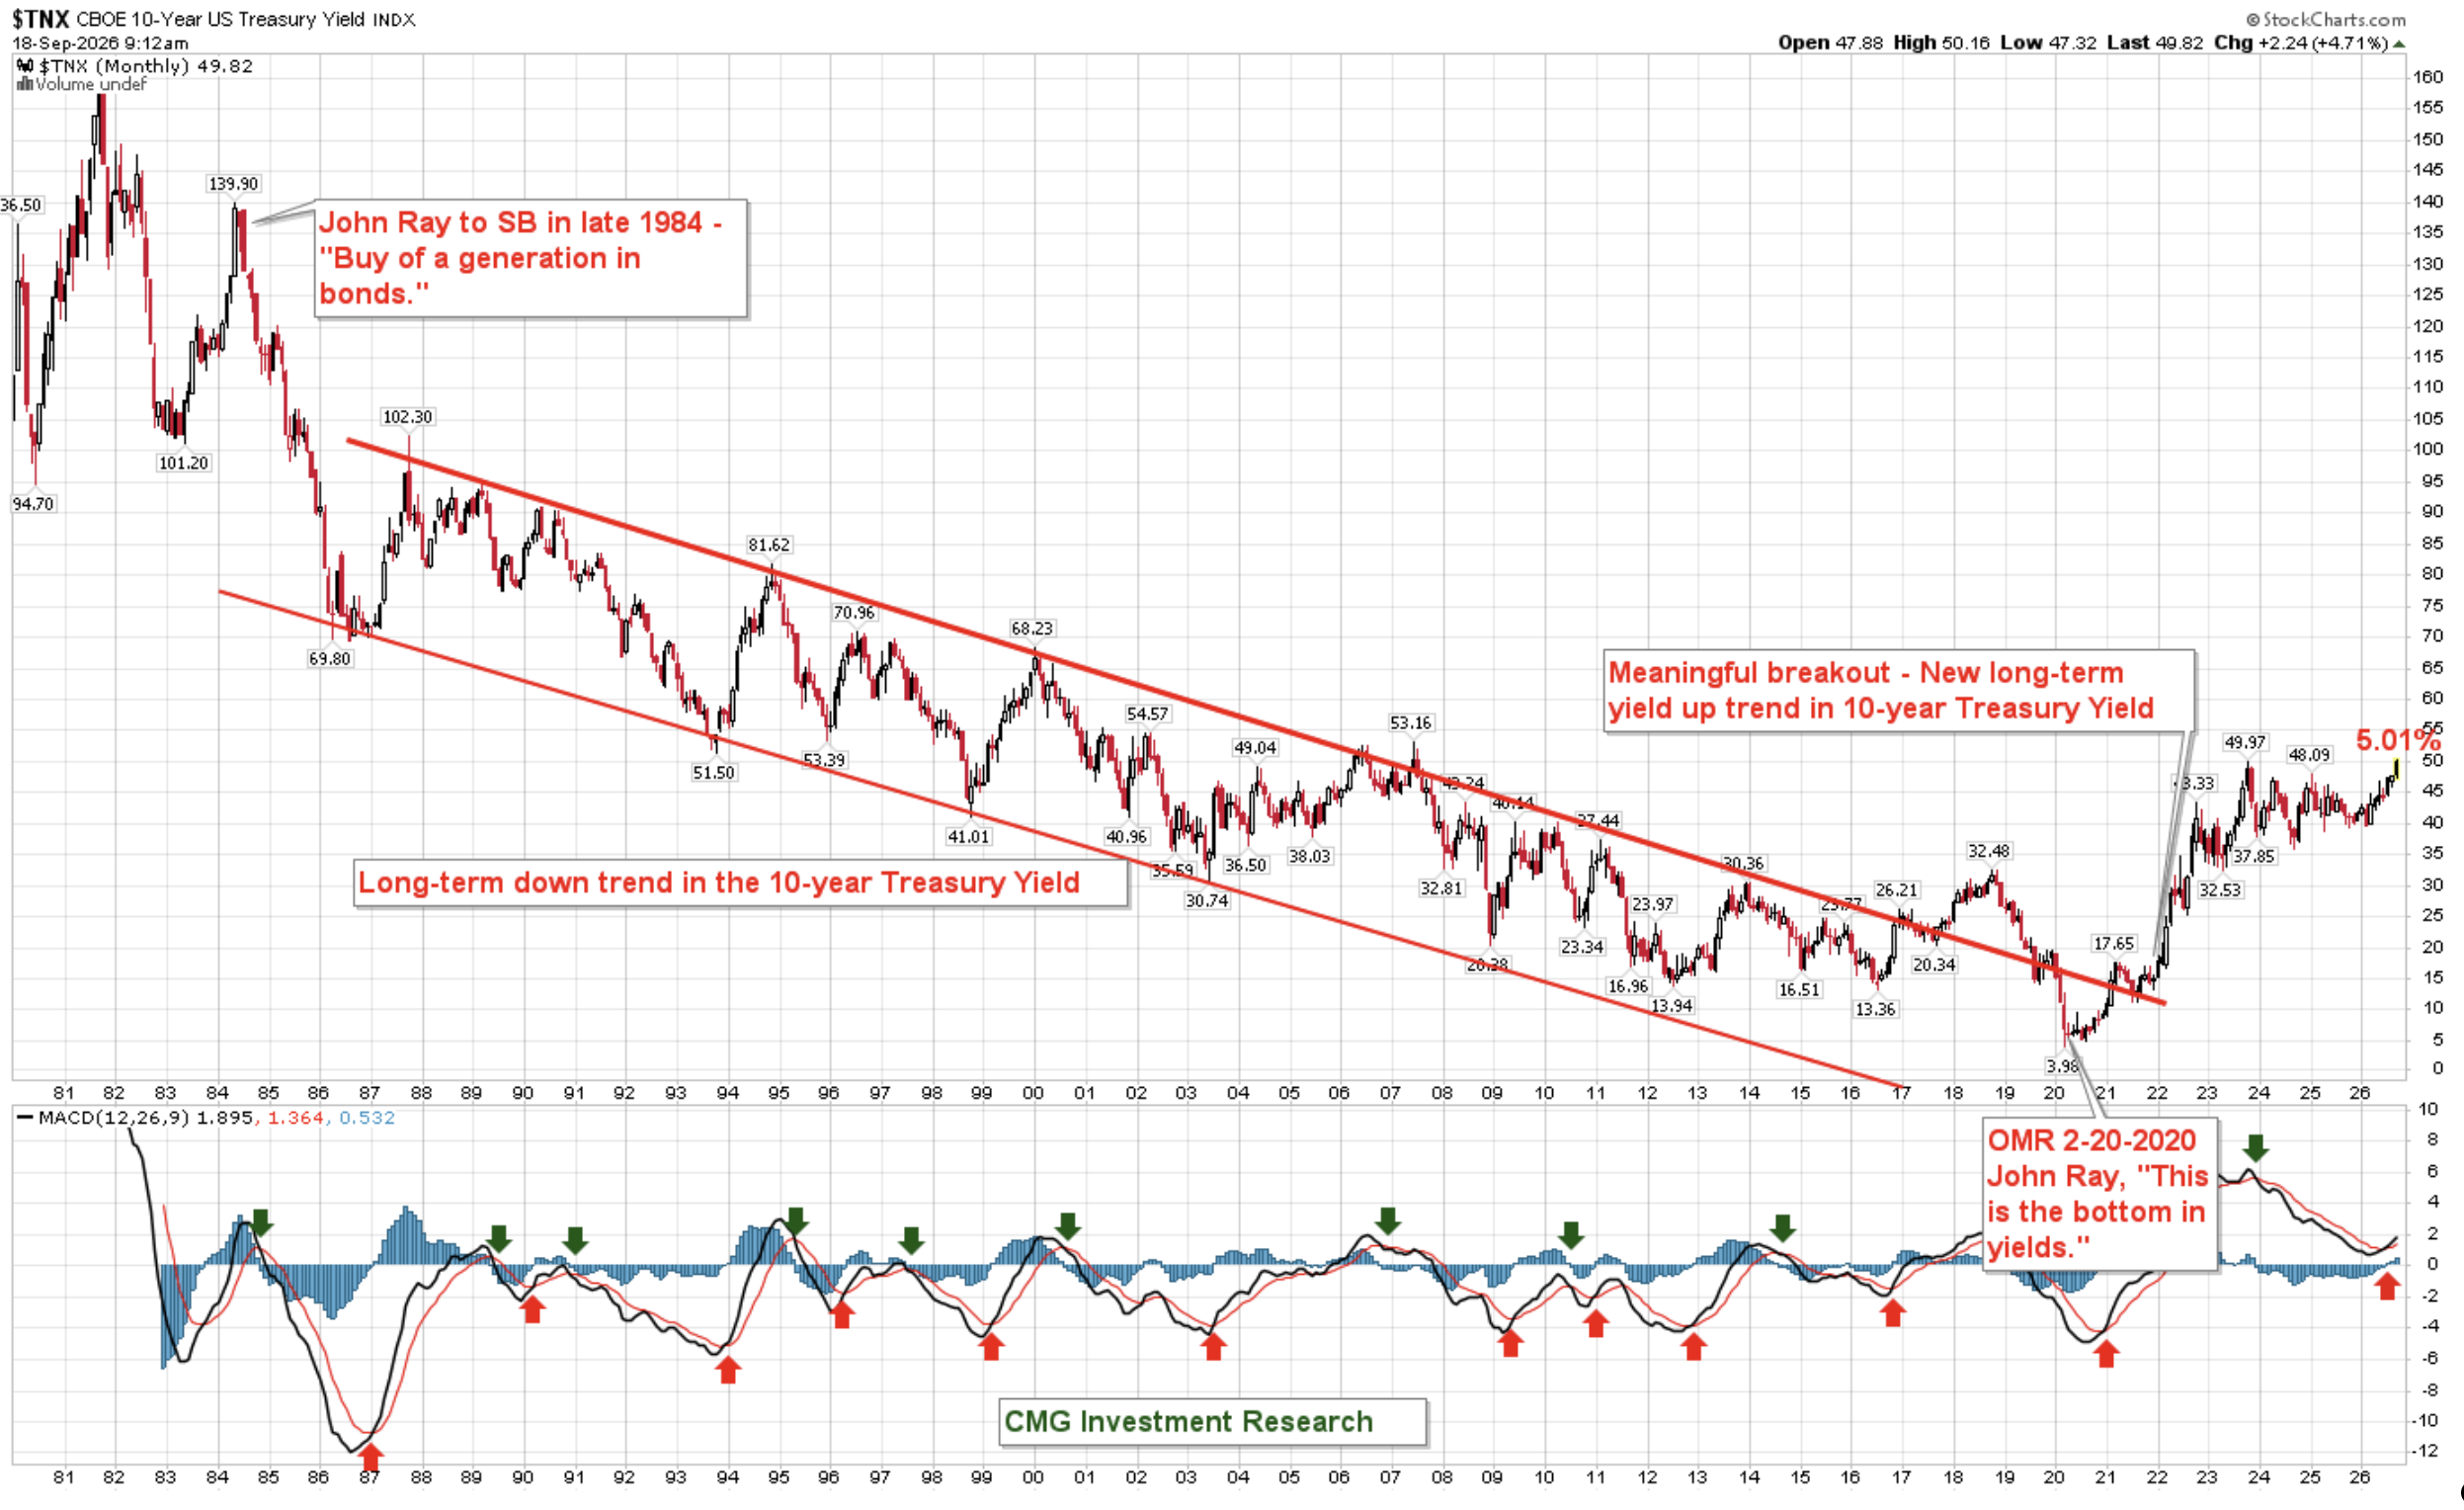
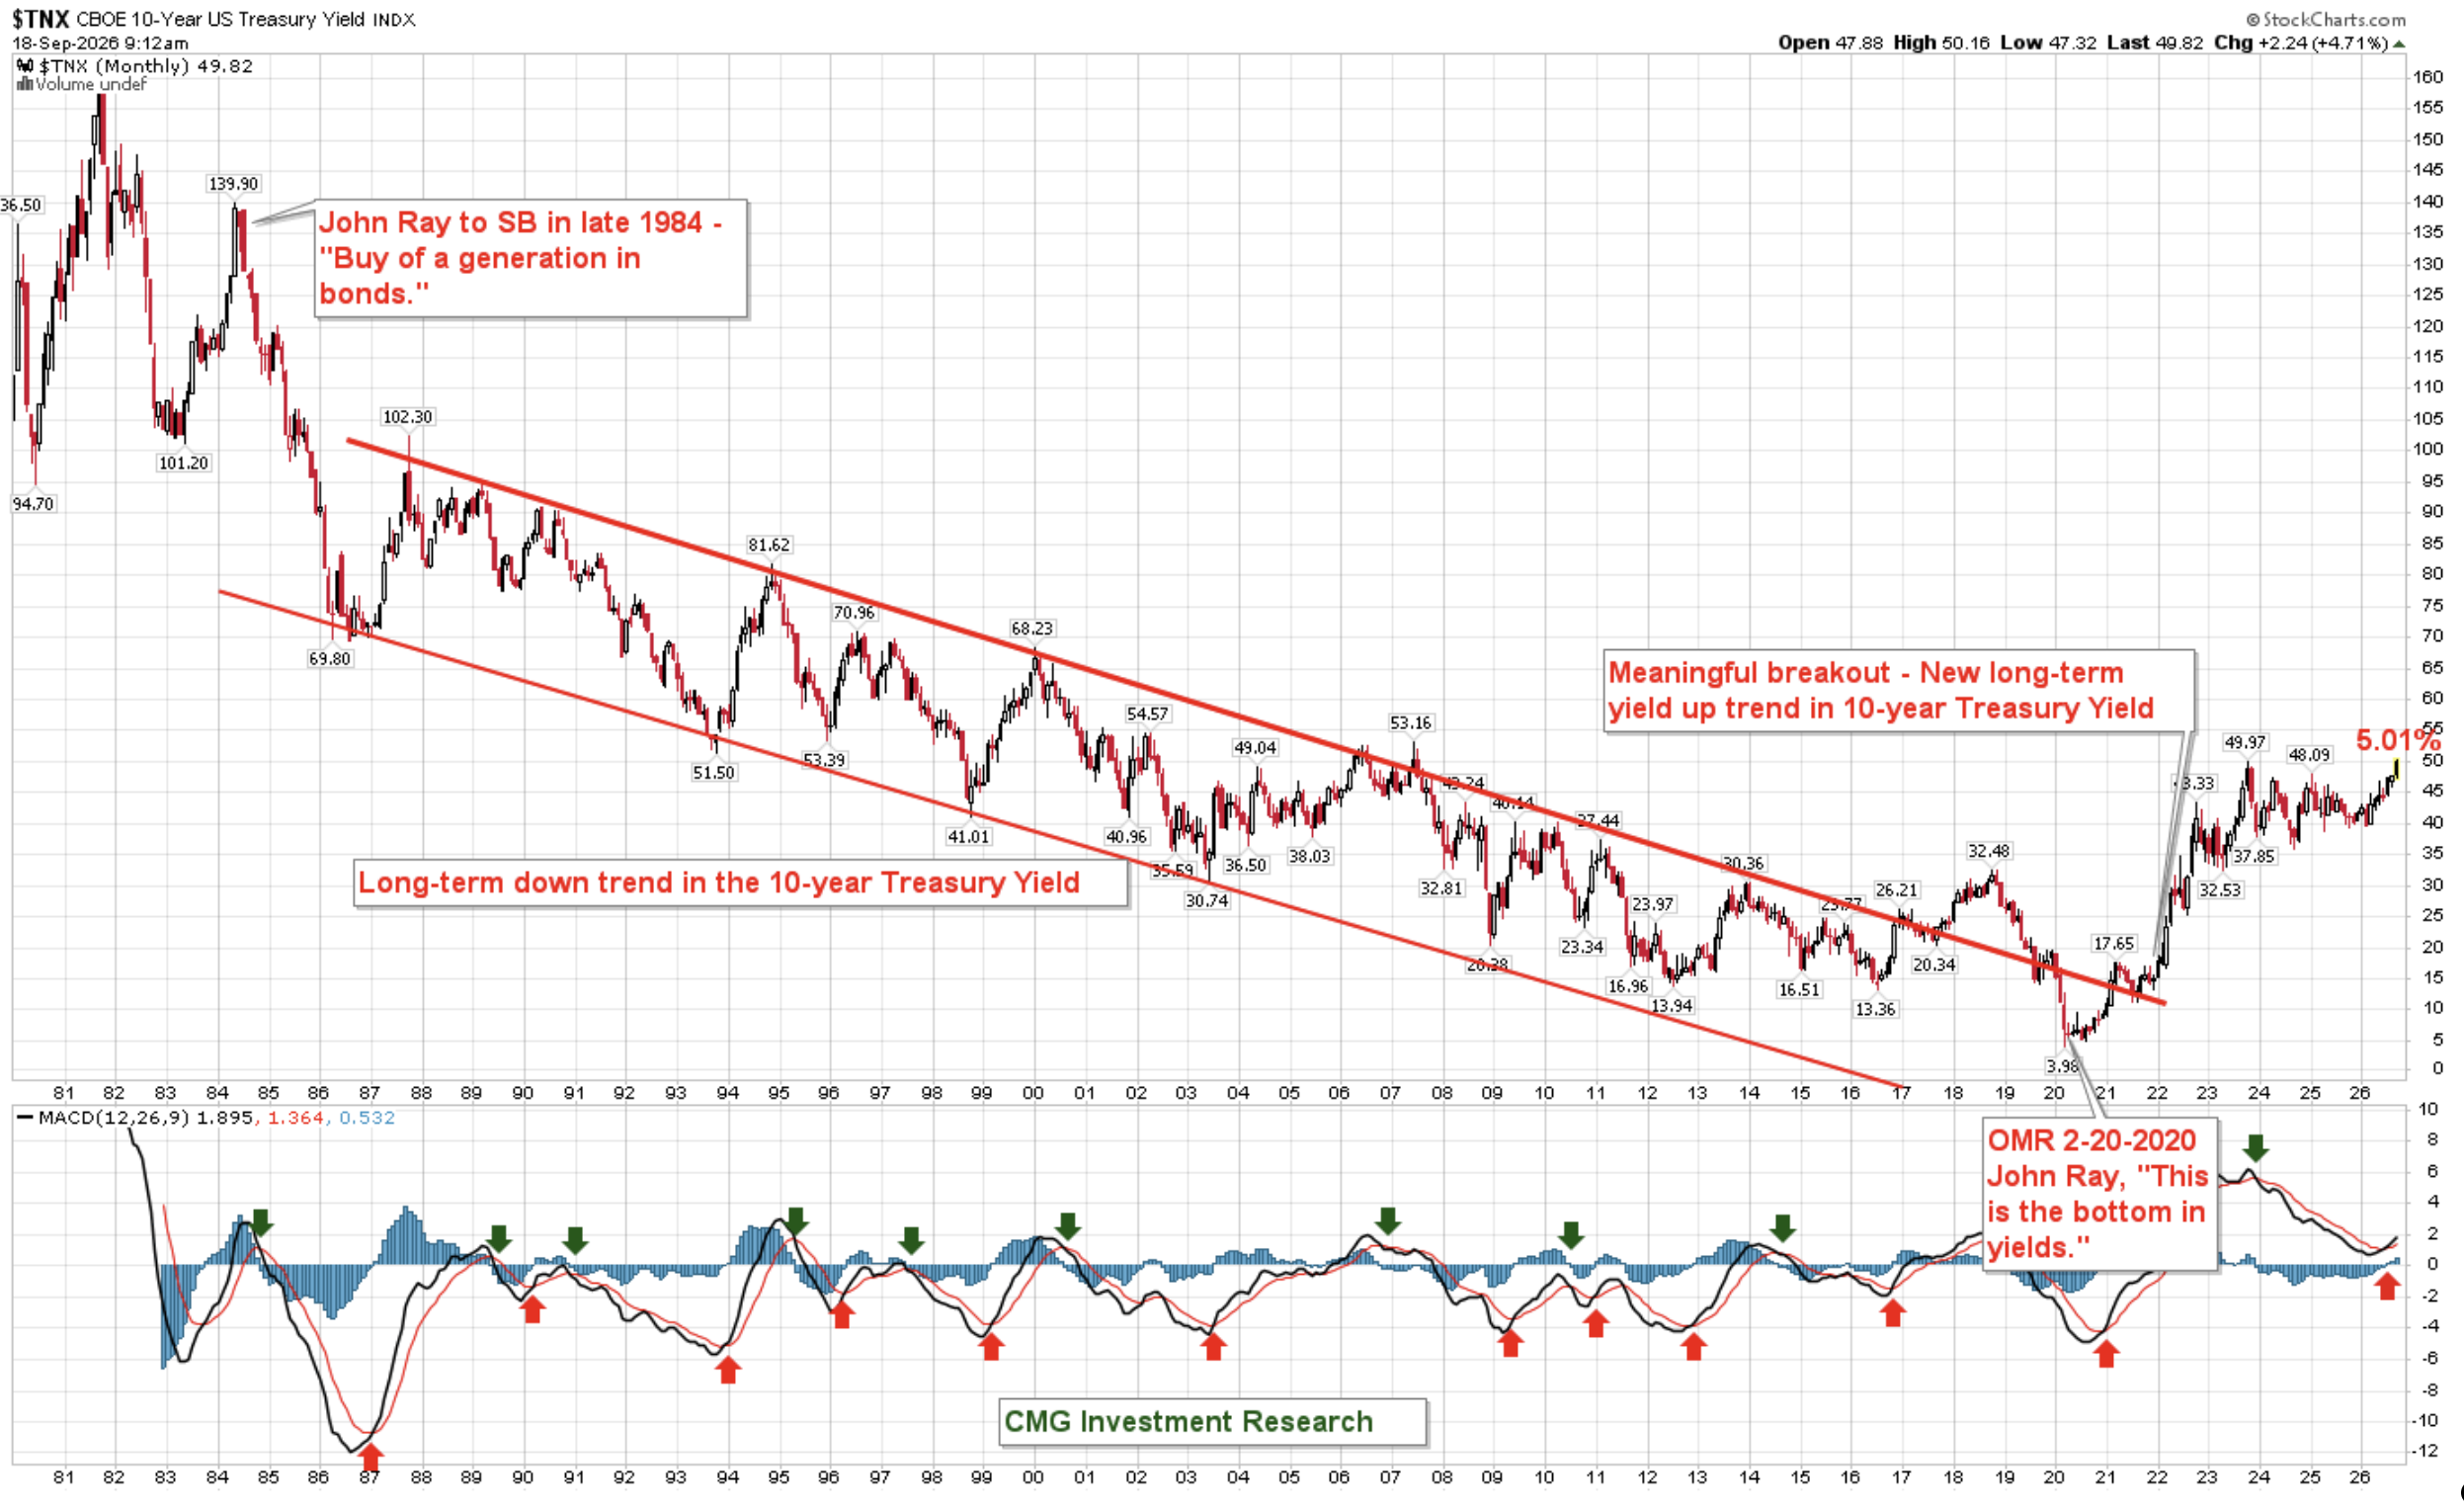
The monthly MACD trend signal is the bigger story. The 40-year secular decline in yields ended at the 2020 low (I called that bottom in OMR, 2/20/2020); we've been in a new long-term uptrend since.
Three more signals, from the archive — I laid these out in "The Yen Carry Trade, Margin Debt, Oil and Inflation" (7/24/26) as what I watch for the carry trade cracking.
Worth an update here:
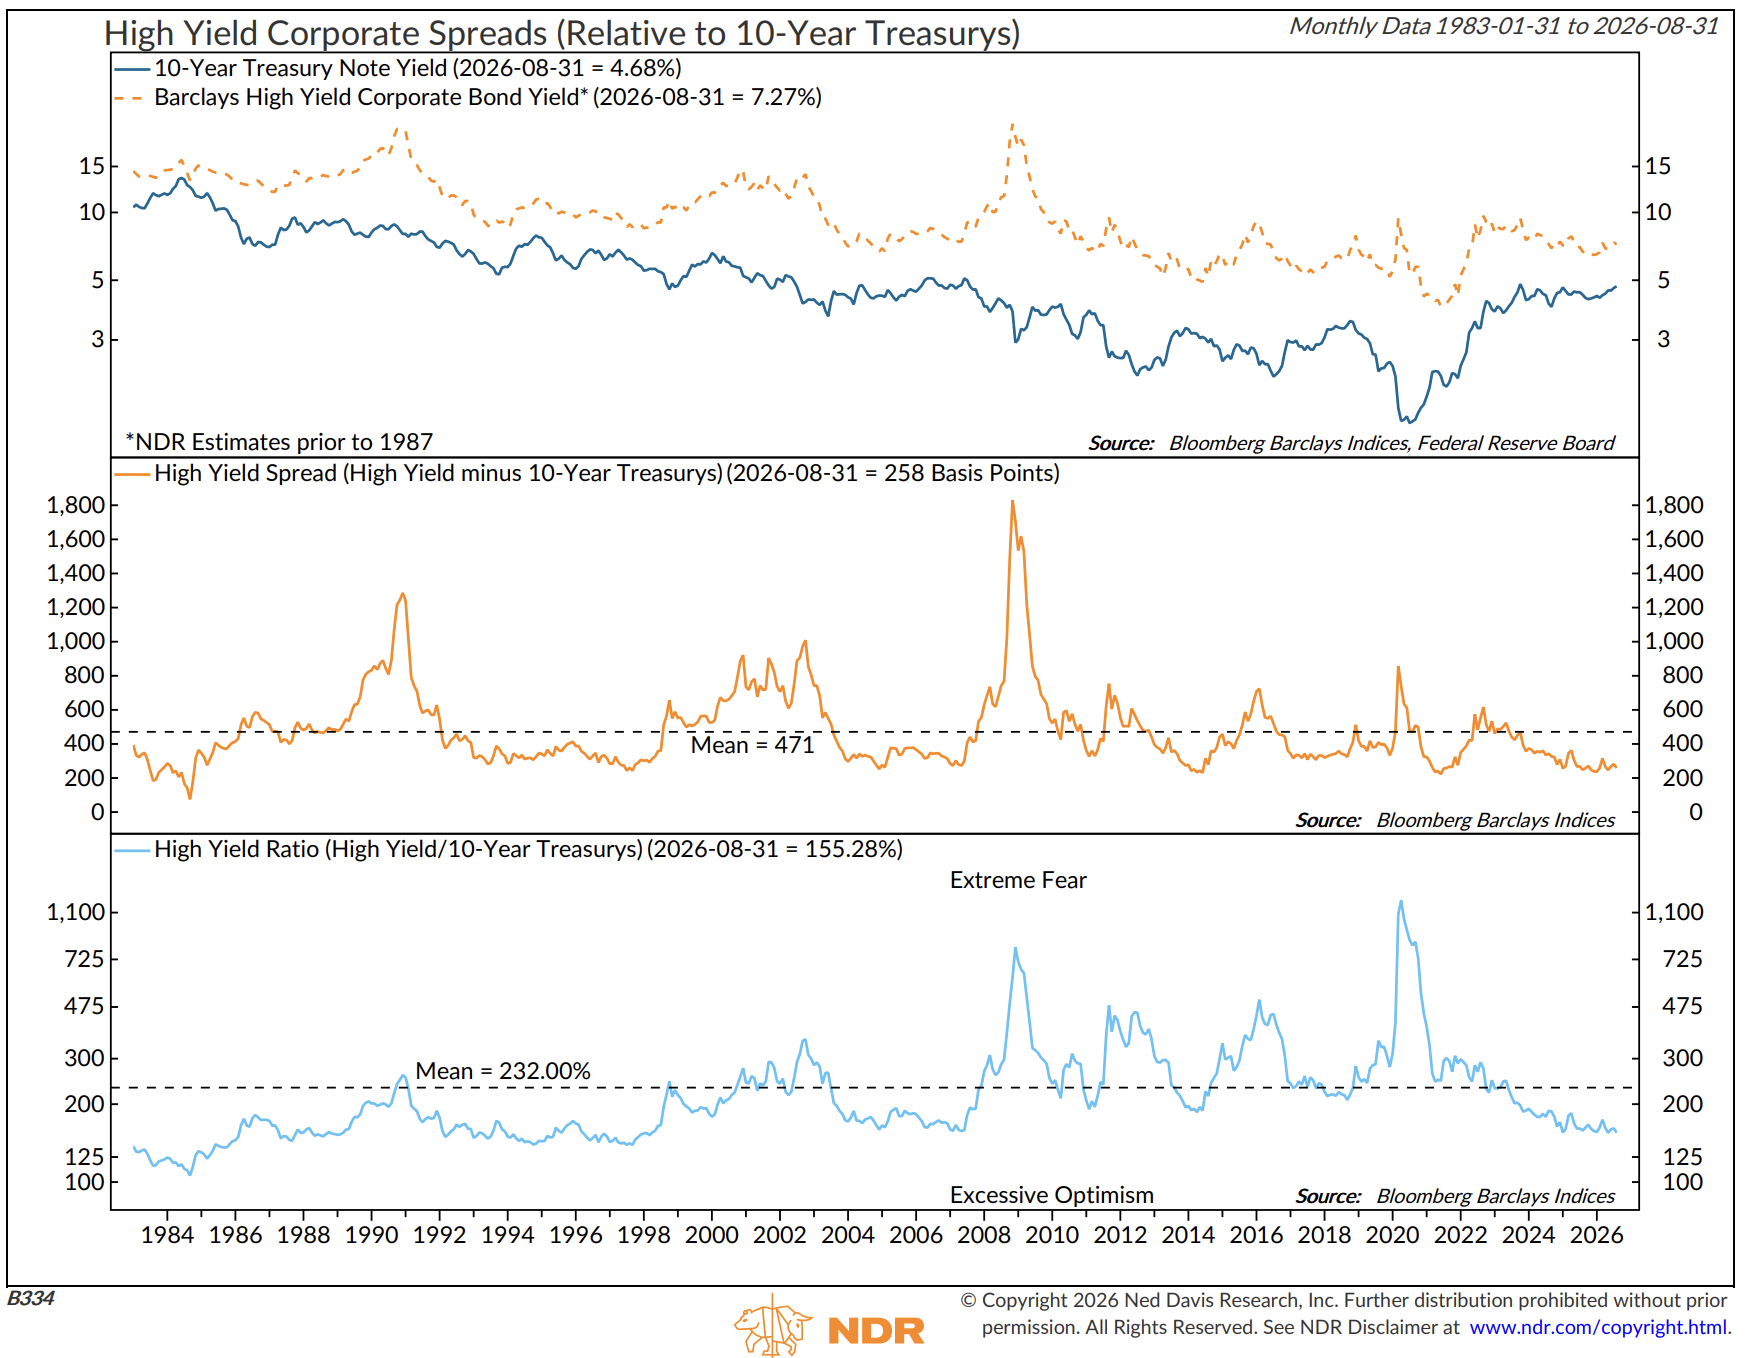
1) High-yield credit spreads (Barclays U.S. HY Corporate OAS) — tight now; a sustained widening is usually the first tell.
Here’s how to read the chart: “Spread” is the difference between two asset-class yields. In this case, the 10-year Treasury yield and the High Yield bond yield.
We are watching for the orange lines in the top two sections and the light blue line in the bottom section to move higher. That is clearly not yet happening
Source: NDR
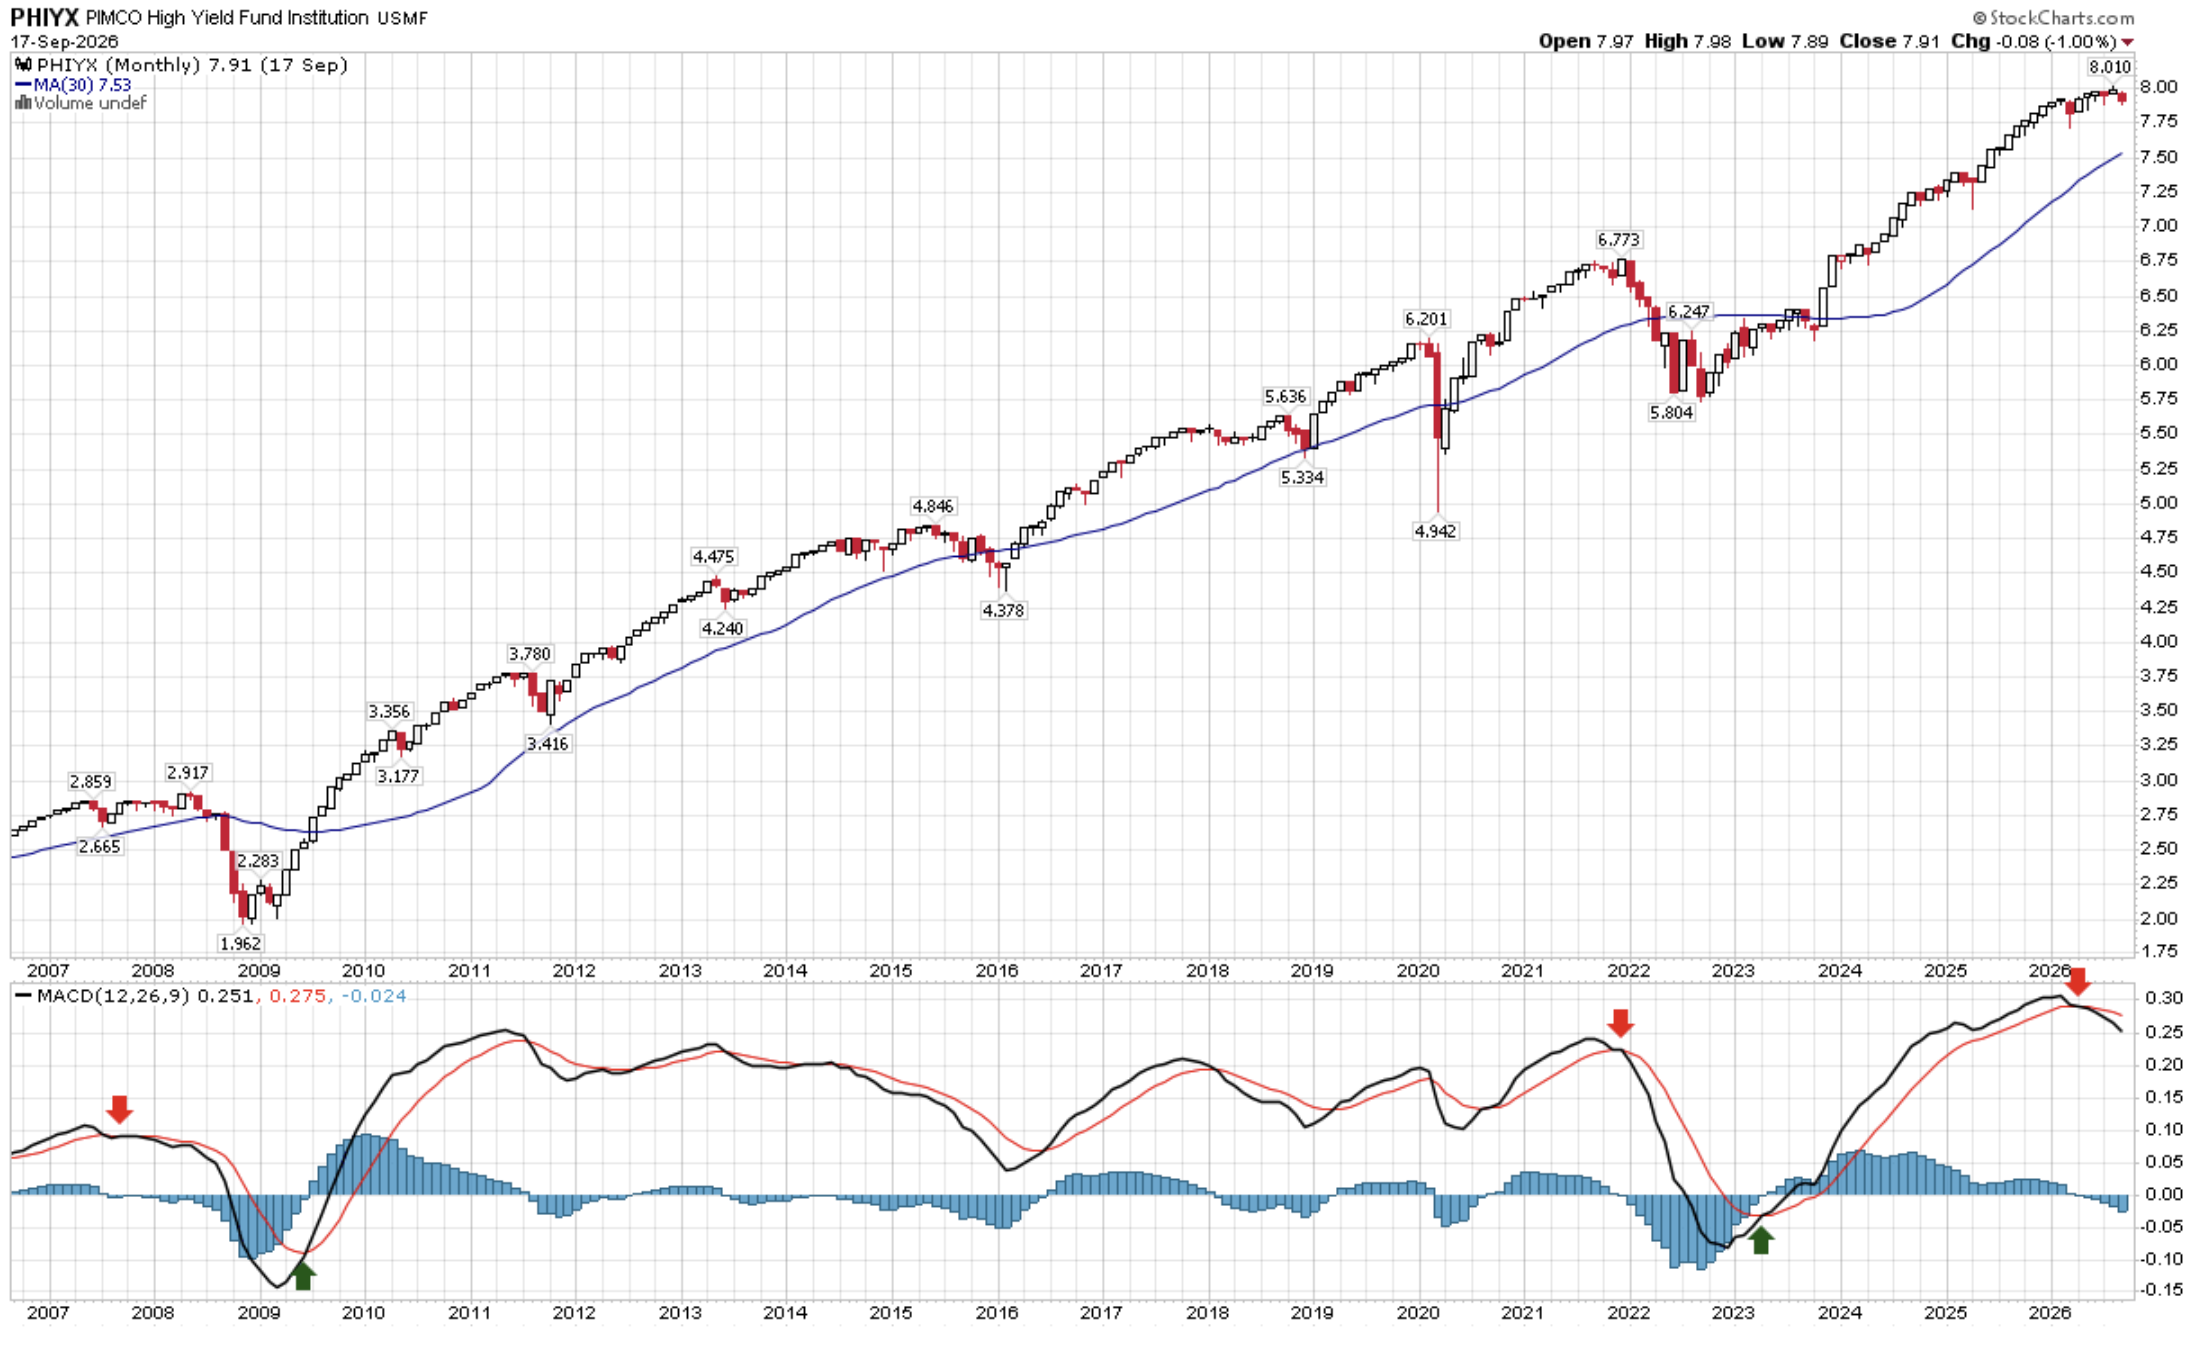
Here is another HY trend chart I keep my eye on. Note that the monthly MACD is signaling a downtrend. No major deterioration yet. Watch for acceleration in price decline.
Source: StockCharts.com w CMG trend arrows
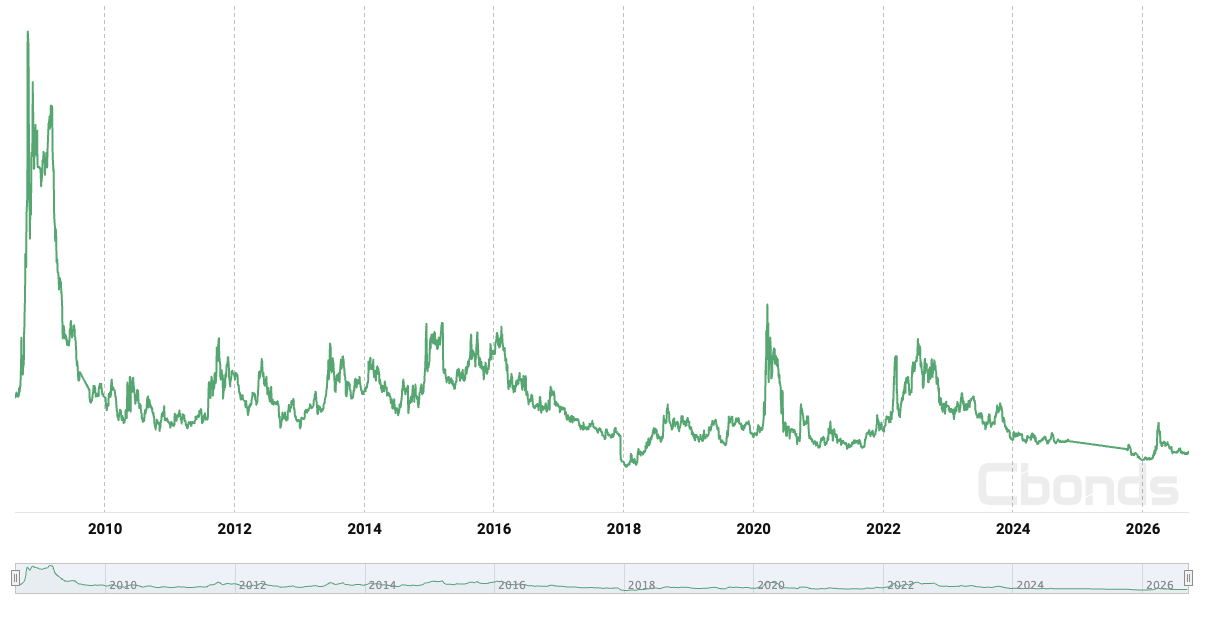
2) Emerging market CDX (CDX EM Diversified Debt) — low and calm; a sharp rise alongside #1 is the warning.
This is S&P Global’s official page for the CDX.EM 5-year index. The 5-year contract is generally the one people refer to when discussing EM sovereign credit conditions. Source: S&PGlobal
Bottom line: No sign of concern. Watching for the green line, far right, to spike higher.
Source: CBonds, https://cbonds.com/indexes/379/?utm_source=chatgpt.com
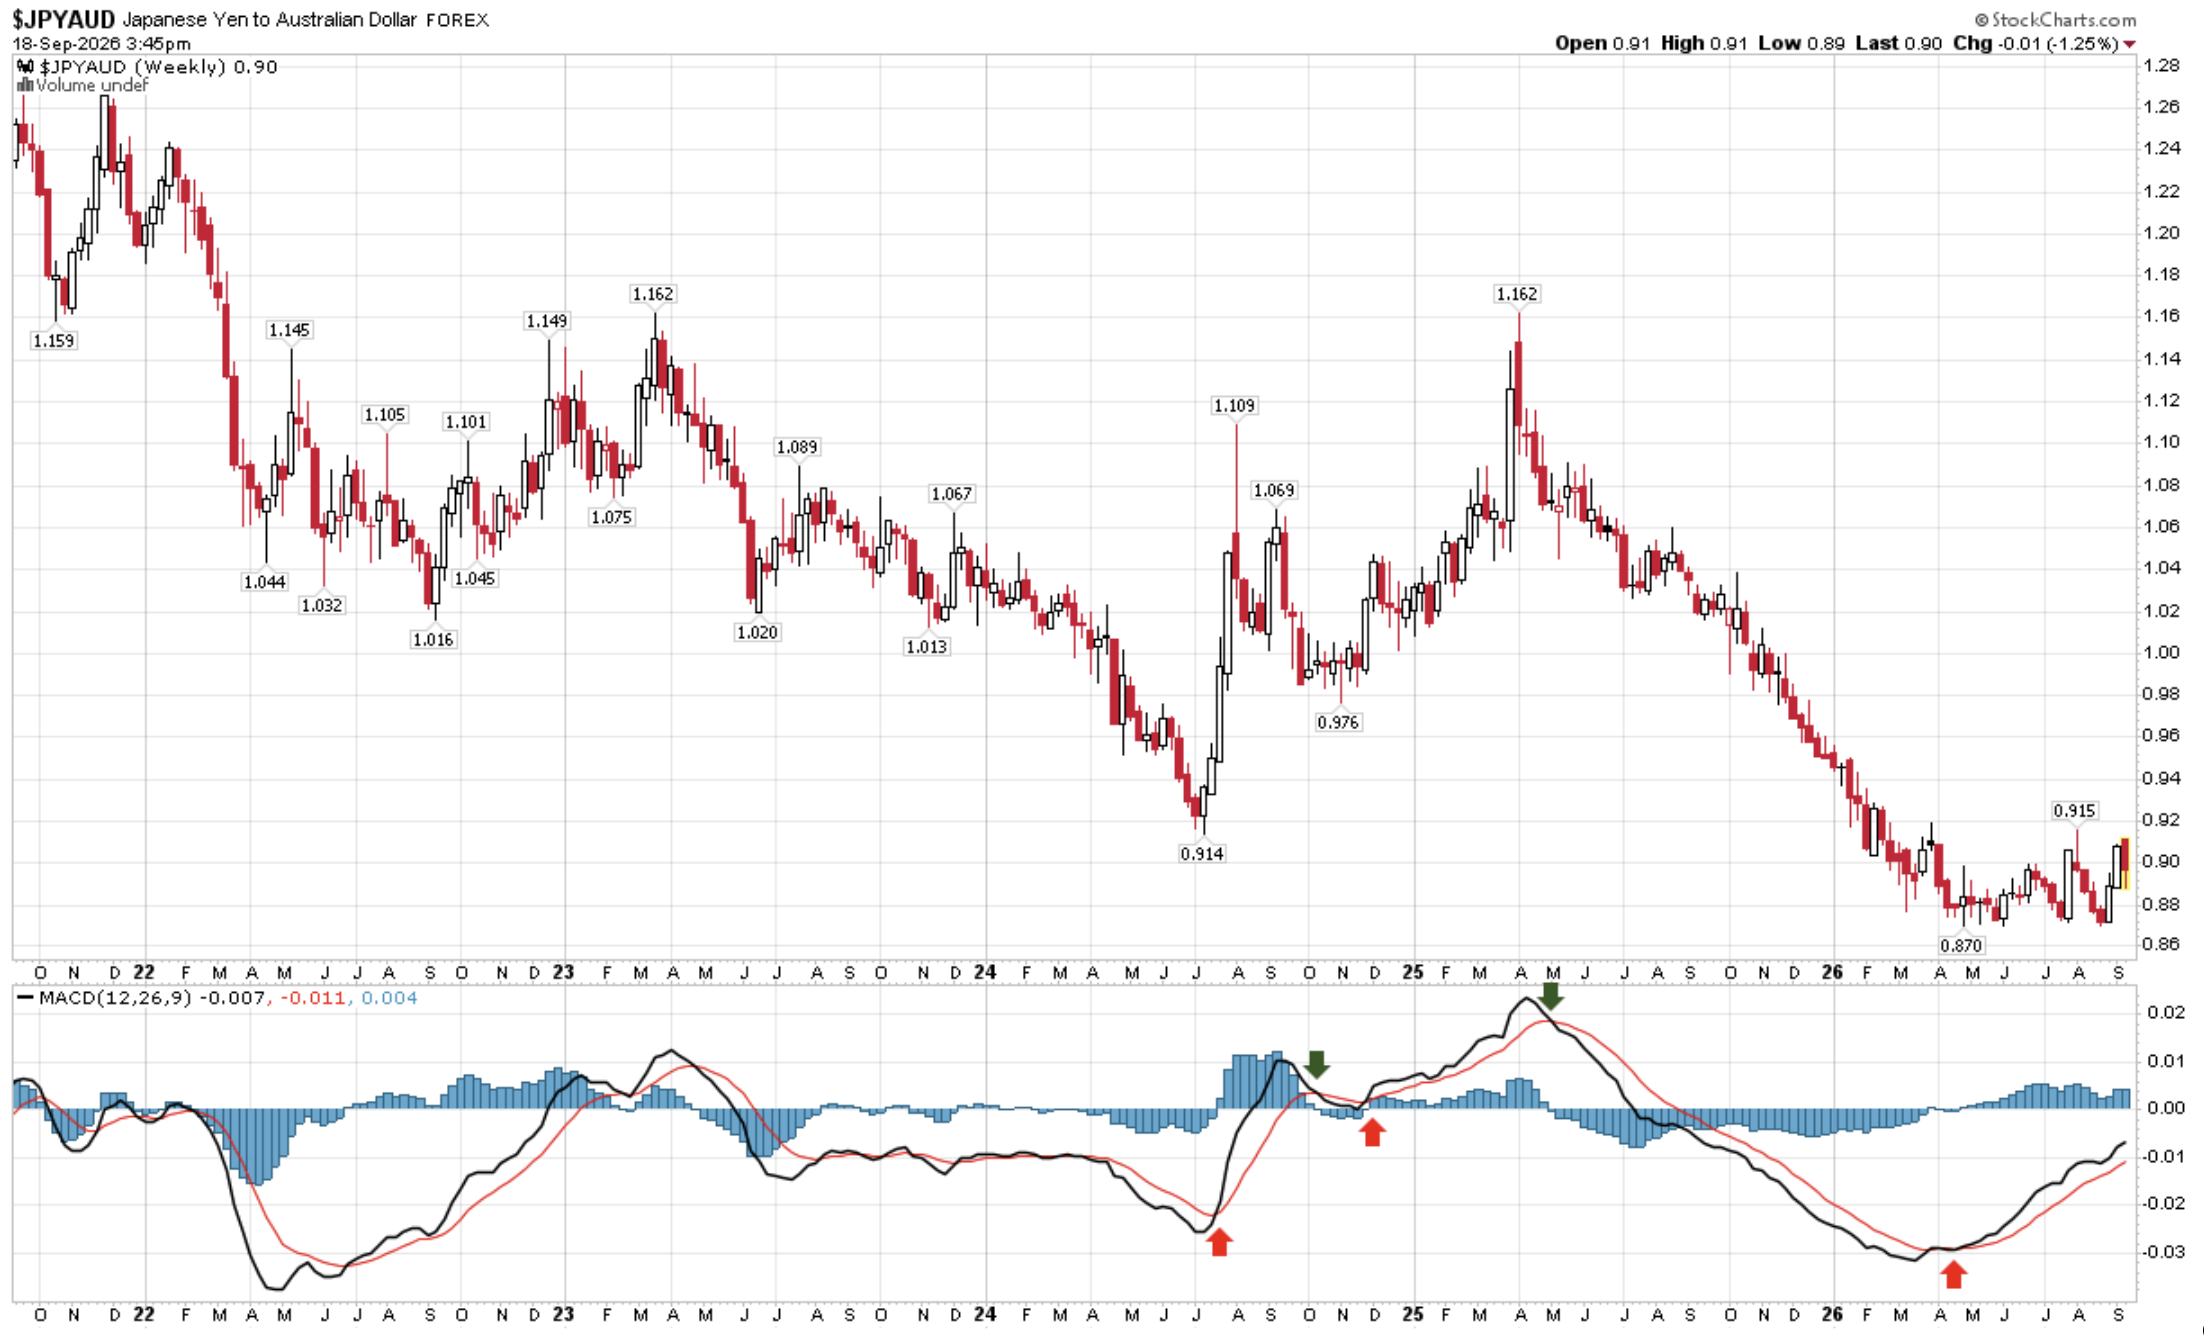
3) The yen itself, vs. the dollar (JPY/USD) and vs. the Australian dollar (JPY/AUD) — the most direct signal. When it snaps back fast, as in August 2024, that's unwinding of the carry trade.
Bottom line: starting to rise, as shown in the lower right-hand side of the chart. Call it “flashing yellow,” not red.
Source: StockCharts.com, CMG arrows
Source: StockCharts.com, CMG arrows
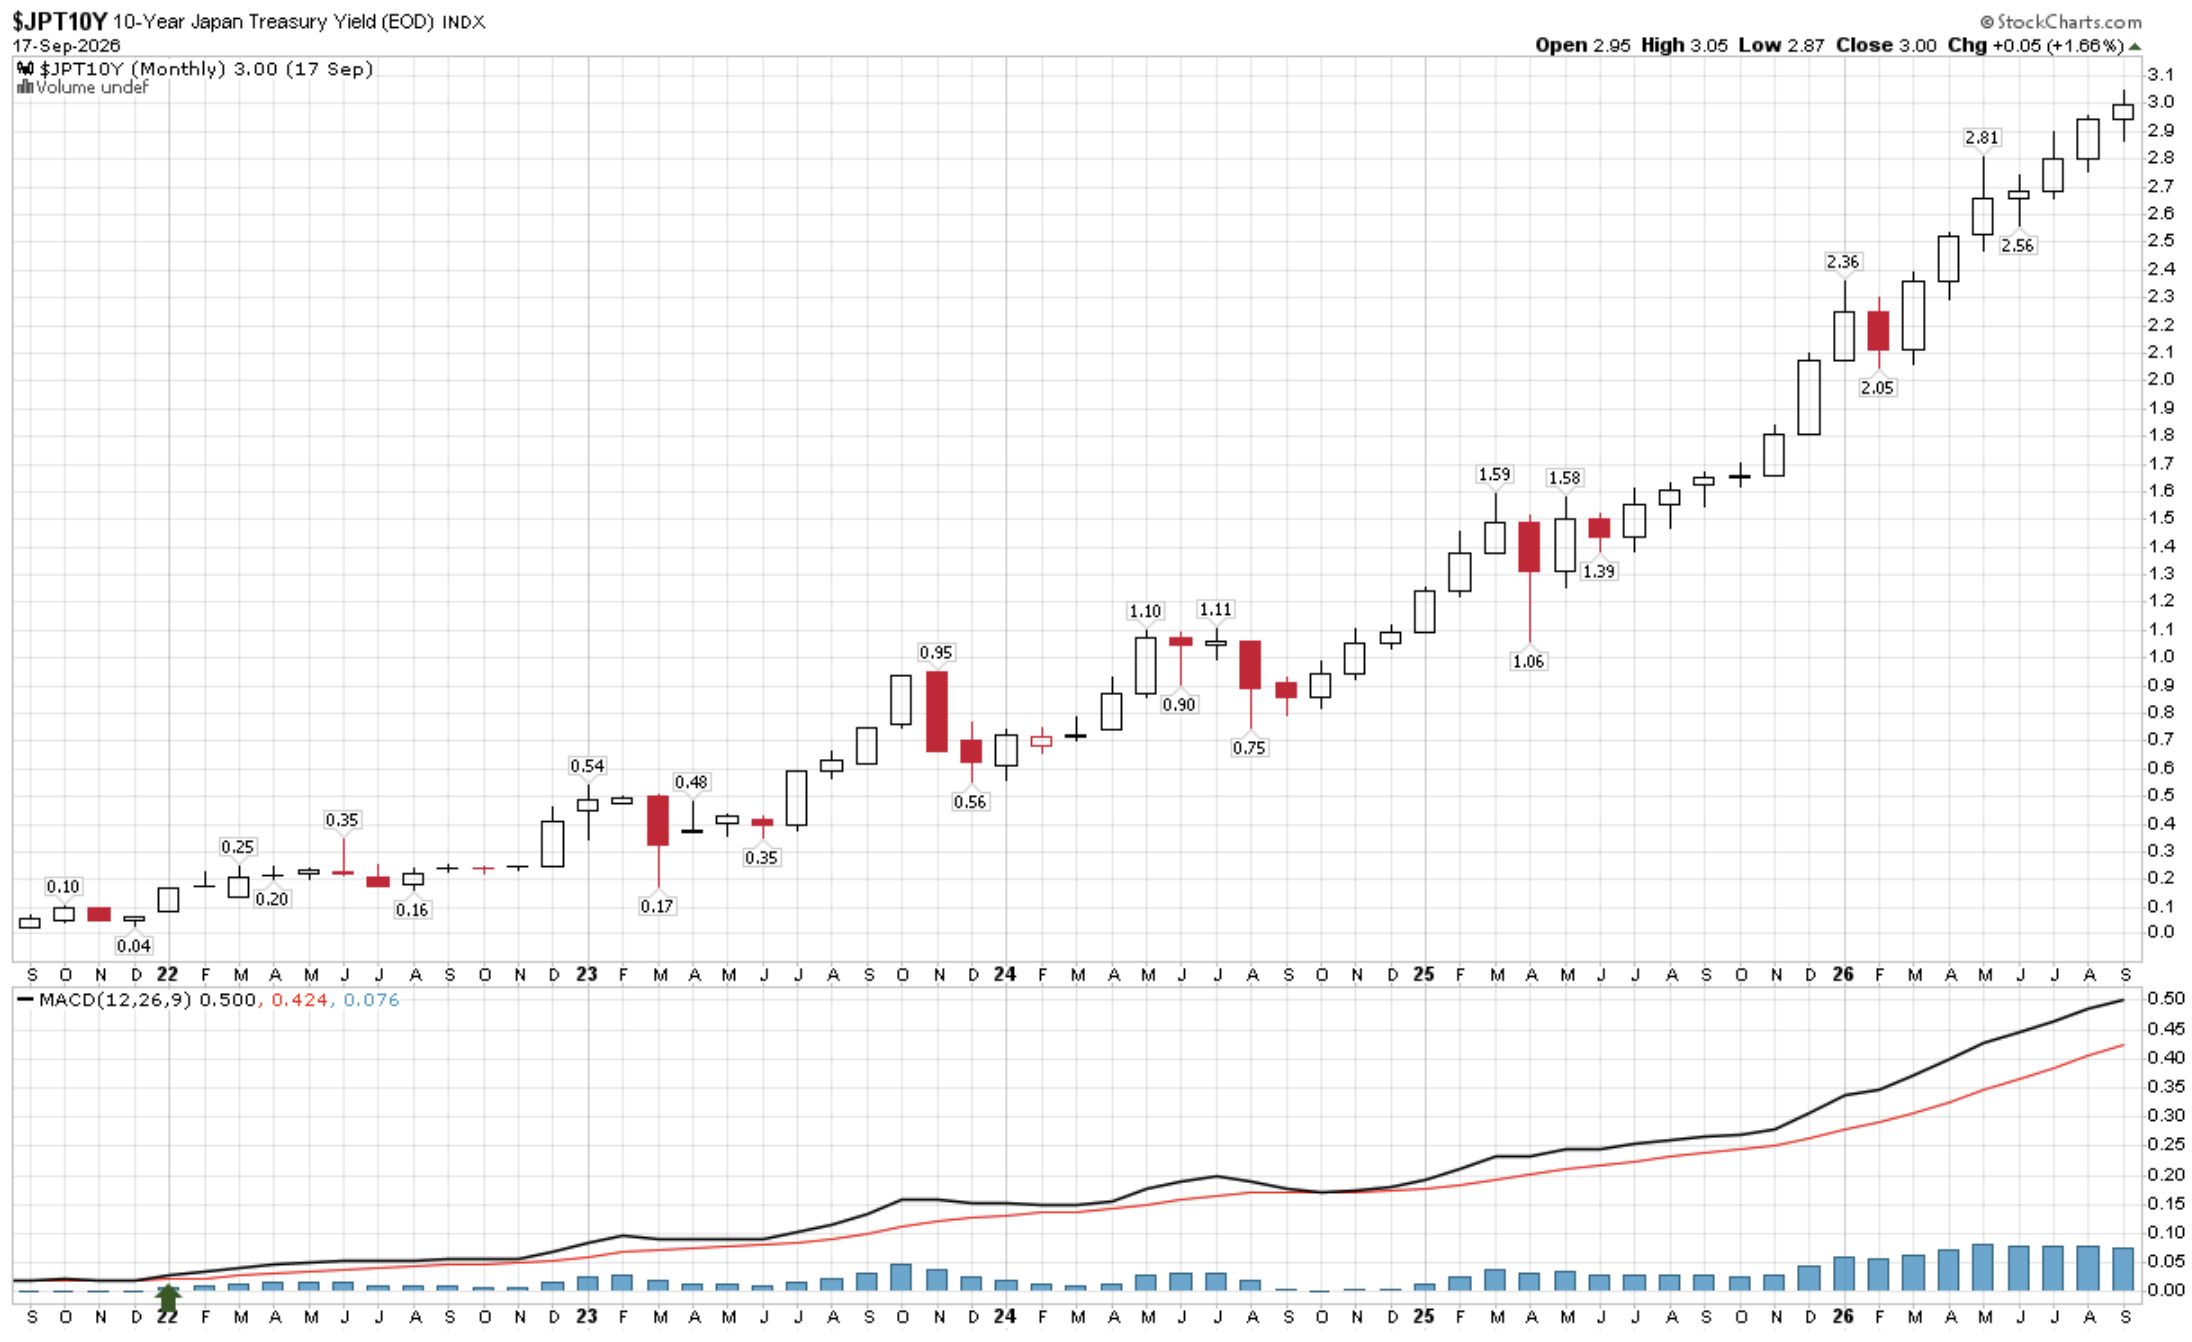
Other important signals: The Japan 10-year JGB yield is at 3% today, the highest level since September 1996. What is important about this is that high JGB yields choke off the carry trade at the source.
Bottom line: Flashing yellow.
Source: StockCharts.com
And as noted in the Treasury yield charts above, the U.S. 30-year Treasury (spiked to 5.24% during Japan's record intervention in August).
Same leverage, same debt cycle, different house.
Bottom line: We are at an inflection point in the yen carry trade. Think of the debt problem in Japan and the US as two extremely overweight patients with clogged arteries. Think of expanding the debt and printing money to fund it as feeding the patient more sugar. The illness only grows worse.
Japan’s currency has declined because few people wanted to buy its bonds. The ultra-low borrowing costs enabled borrowers to borrow cheaply in Japan and convert their borrowed funds from yen to other currencies (such as dollars), then invest those dollars in select assets. Borrow at 1% and invest at 4% and you are making money. A good gig while you can get it. When the spread narrows, the opportunity shrinks, and borrowers may be forced to unwind. That’s what the unwinding of the yen carry trade means. The problem globally is the size of the leverage.
Today, one of the overweight patients, Japan, is stuck in an inflationary trap due to its dependence on oil and diesel to fuel its economy. They have to get the yen up so that oil, which trades in dollars, doesn’t cost them as much. To increase the yen, they need to raise their interest rates, but doing so means they pay higher interest costs on all their debt, making the yen carry trade less attractive and risking unwinding. It’s like a leveraged hedge fund forced to sell assets to unwind its leverage. But that is small peanuts compared to how much money is in the leveraged yen carry trade.
A close friend called me this morning and noted that if oil reaches $180, the Japanese will have to sell their treasury holdings and bring their capital home.
They would use that money to bring it back home (sell dollars and buy yen) to support the currency and reduce the painful inflation they are experiencing.
They have to help their citizens, and they will do so despite Treasury Secretary Scott Bessent's desire to persuade them otherwise.
Please know that this is not a recommendation to buy or sell any security. Speak with your advisor or reach out to one of ours.
We wrote a white paper titled How We Think About Wealth. If you’d like a copy of the paper, you can access it here or click on the photo.
Opinions are subject to change. Not a recommendation to buy or sell any security. Provided for discussion and educational purposes only.
OMR: John Ray – I'm Calling the Bond Market Top (Low in Yields); It's Got to Be Over — February 28, 2020
This is what I wrote then: “This morning, I sat down and started writing about the coronavirus—something you may have expected, considering its impact on the markets. Then, around 7:30 am, my cellphone rang. I looked over and saw it was John Ray. When John calls, I stop what I’m doing, and I pick up the phone. John is my long-time mentor. He got me the interview that led to my first job on a Merrill Lynch institutional options market trading desk. That was in early 1984. A year later, I moved to the retail side. John was my first client.
Once a month, he would take me to lunch at the Philadelphia Union League, and he’d often call me over to his office. I’d walk down, pick up a check he’d want to deposit, and he’d take me to school. My head would spin as I walked the few city blocks back to my office. He’s been my greatest teacher.
John nailed the secular cycle high in interest rates—and the story is a good one. Back then, he was a portfolio manager running a popular mutual fund at Delaware Funds, a large money management company. He was buying 14.25% Treasury bonds at a discount of 94 cents on the dollar. That meant the yield was even higher. He sought to put half the money he was managing in Treasury bonds, but his board of directors shut him down. I remember how frustrated he was. Inflation was out of control, and everyone thought rates would move even higher. That’s what it feels like at inflection points. I remember buying zero-coupon bonds in his children’s investment accounts and having a hard time convincing the few other clients I had at the time to do the same. But John was spot-on. He nailed the top in yields, and he took action.
It’s been months since we’ve spoken, but that never matters. What I love about John is he gets right to business. The first words out of his mouth this morning were, “Steve, listen to me. This is the bottom in yields,” he said. “It has to be. It’s crazy. We have upside-down interest rates. It will reverse.”
I’ve been in the camp that we are going to 1% on the 10-year, and John agreed that maybe we will. But think about it. The top was 35 years ago—I remember the talks we had to this day. Then, out of the blue, the call this morning. "I think John Ray is right.
There was more wisdom from John back then: “I really believe that the bond market is driving this. It is insanity in the bond market. Who locks up their money for 10 years at 1%? Cash it out and wait for a higher yield down the road.
The Fed is promoting inflation appreciation with a target at 2%. Someone has to ring the alarm bell. Enough is enough. This is the low in interest rates.
I told John I’ve seen charts that show we are at 5,000-year interest rate lows. He told me he can’t argue. Who the hell is buying negative-interest-rate-yielding bonds in Europe? You can’t do it.
He continued:
He advised me to key off the bond market. It is in a worse condition than equities. He asked me if I remembered when he had to walk over to my office and address a margin call during the ’87 crash. “Well,” he said, “this is like that for the bond market.”
I clear remember that moment. October 19, 1987. I was in Maui on an award trip and my phone rang at 3 am. It was my assistant. It was absolute chaos. My first call was to John. Then other clients.
John Ray was right! Well, almost perfect, as the 10-year was yielding about 0.50% and bottomed shortly after at 0.38%. Source: FRED, StockCharts
I believe one of the most important things we have done for our clients was to keep them out of long-duration fixed-income bonds.
The yield on the 10-year was below 0.50% on that day I wrote the OMR piece in February 2020. It is at 5% today.
Here is the chart I shared back then, updated to today.
Source: StockCharts.com, CMG annotations
Here is a look at the loss (2-28-2020 to 9-18-2026)
The top section is the 10-year Treasury yield note's decline in value. Down ~ -35%
The bottom section is the 30-year Treasury bond. Down ~ -65%
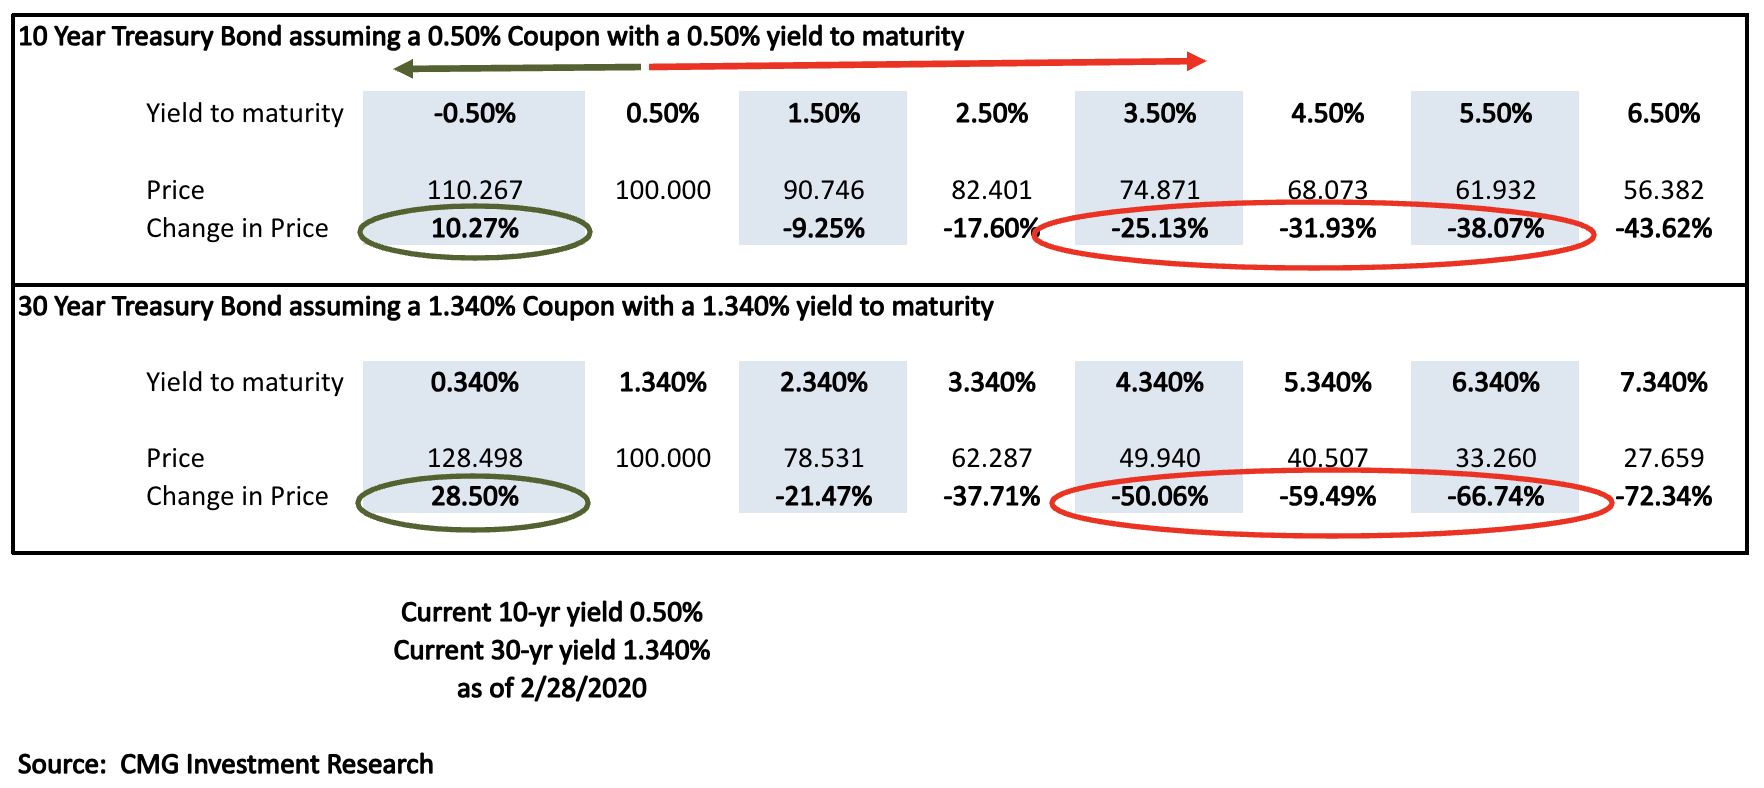
Source: CMG Investment Research, Starting Yield data on 2/28/2020 StockCharts.com
I need to call my friend John Ray to get his current take.
Here’s mine: I’m not even close to calling a new bull market in bonds. Not until we get our fiscal house in order. And I’m not sure how we do that, nor whether we can muster the political will to raise taxes, cut spending, and stop printing money.
This next grid looks at the reward/risk potential from here. If the 10-year drops back to 3%, the gain will be attractive. If the yield rises to 7%, the loss will be ~ 14%. There is even greater potential for gains and losses in betting on the 30-year. A bet I’m not yet ready to take.
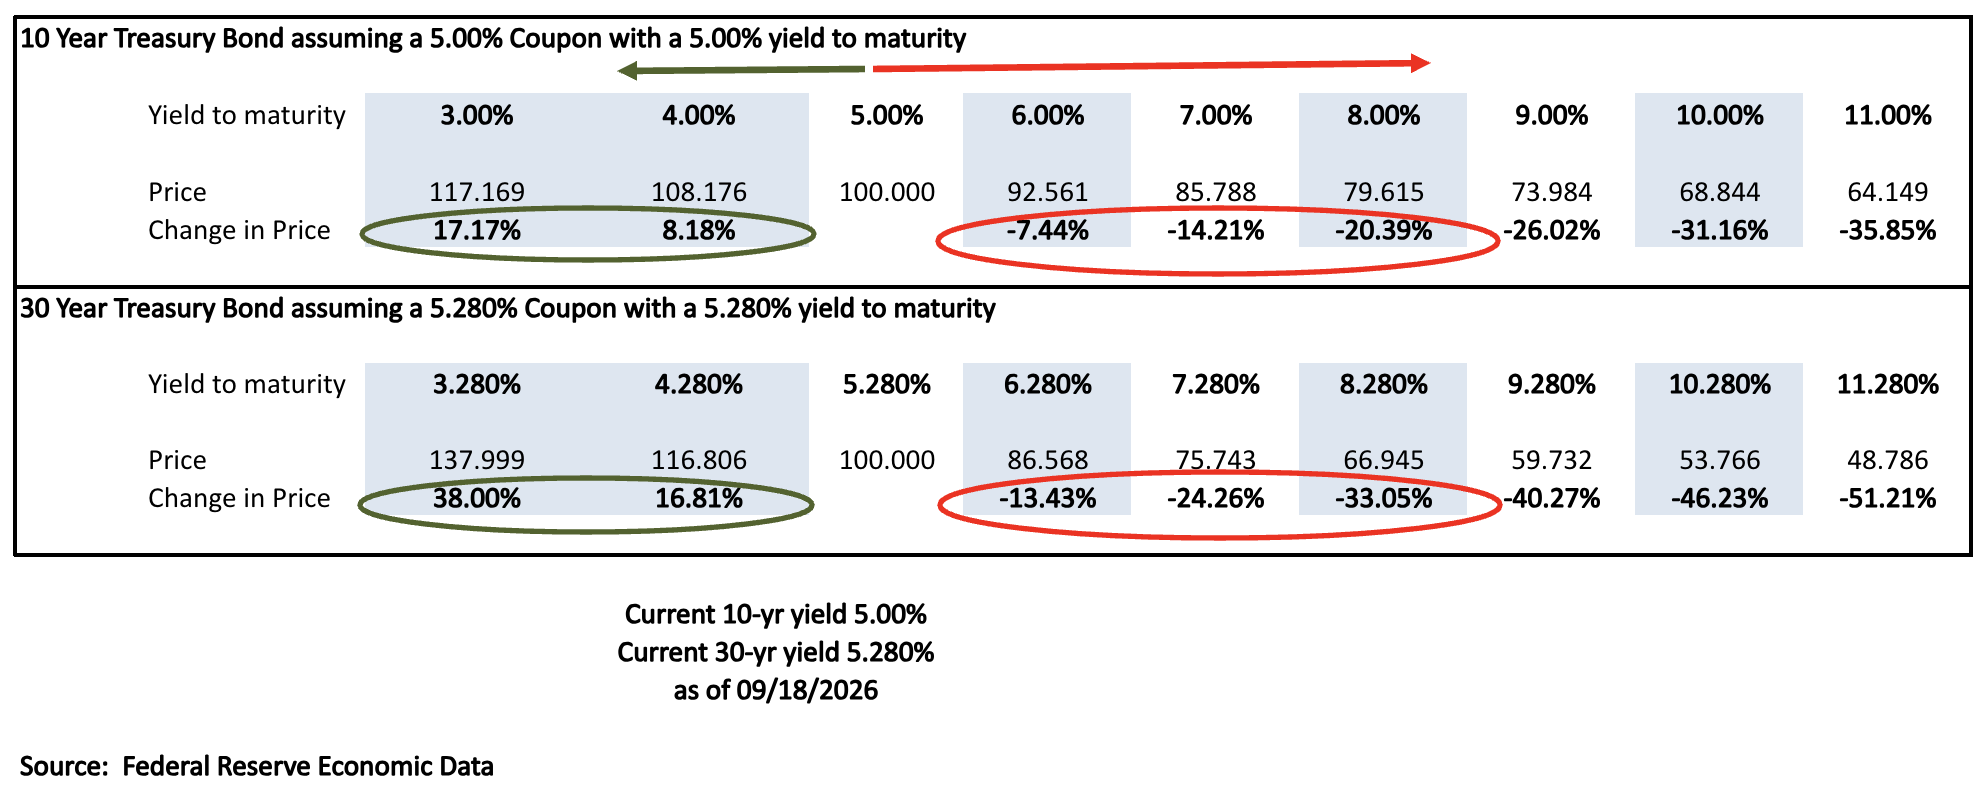
Source: CMG Investment Research, https://fred.stlouisfed.org/series/DGS10/
Opinions are subject to change. Not a recommendation to buy or sell any security. Provided for discussion and educational purposes only.
If you like what you are reading, click on the link and share it with a friend (it’s free).
CLICK HERE TO SUBSCRIBE TO ON MY RADAR
Trade Signals: September 17, 2026 Update
Trade Signals
The Indicators Dashboard - Stocks, Investor Sentiment, Bonds, Commodities, Currencies, and Gold
Valuations and Subsequent 10-year Returns
Supporting Charts with Explanations

TRADE SIGNALS SUBSCRIPTION ACKNOWLEDGEMENT / IMPORTANT DISCLOSURES
About Trade Signals - Trade Signals is a paid subscription service that posts daily, weekly, and monthly market trends (and more). Free for CMG clients. Not a recommendation to buy or sell any security. For discussion purposes only.
The views expressed herein are solely those of Steve Blumenthal as of the date of this report and are subject to change without notice. Please note that the information provided is not recommended for buying or selling any security and is provided for discussion purposes only.
Personal Note: Brotherhood and Luke
His brother wheeled him out onto the field, and his teammates didn't wait for an invitation. The team swarmed him — arms everywhere, faces close, a pile of Malvern Prep Friars around one wheelchair. Malvern had just beaten Hill School. But watching the boys embrace their friend, the final score felt like the least important part of the afternoon.
Luke is a senior. A goalie. A few months ago, he and his family got the kind of news no one is ready for: bone cancer, in his lower leg, just below the knee. What followed was several rounds of chemotherapy, then surgery to remove the section of bone where the cancer had taken hold. Surgeons rebuilt the joint — something like a total knee replacement, but a harder, more delicate procedure. You're rebuilding one in an eighteen-year-old who, a few months earlier, was still stopping shots on goal.
He's fighting. And by every account, he's winning.
Learned through her many years in coaching education, Susan shares a 1965 theory by Bruce Tuckman on team dynamics. When groups/teams are formed, they go through 4 main stages of development: forming, storming, norming, performing. Forming is the initial stage, best behavior, figuring each other out. Storming is where the friction lives — different personalities, different expectations, the conflict that every real team has to move through, not around. Norming is when the group finally settles into how it actually works together. And performing is the payoff: a team that trusts each other enough to stop managing each other and just play. But you can’t skip storming, and it shows itself in unexpected ways.
What I saw on Wednesday, both during and especially after the game, was a team well past performing. A team that had gone somewhere Tuckman didn't quite have a name for — the stage where the group stops being a collection of players and starts being something closer to family. You don't get a wheelchair full of teammates racing across a field to embrace one of their own unless a team has already done the harder work, learning how to show up for each other. Luke has that effect on people.
That's the part of coaching youth sports that's easy to miss if you're only watching the scoreboard. The wins matter, and the losses teach. But the real return on a season and life is always beyond the scoreboard.
Luke, if you ever read this: while we want to lift you up, you invariably lift US up much more. Even in your darkest times, you carry a certain special bright light with a warrior’s mentality.

Neil, Vince, Susan and Luke

The Malvern Prep Soccer team surrounding Luke
The season is in full swing now, and the boys are 3-0-1. Two games next week. Let’s go, Friars!
And of course, let’s go your team too!
Have a great week!
Kind regards,
Steve
CLICK HERE TO SUBSCRIBE TO ON MY RADAR - IT’S FREE
You can share this letter on X by clicking here.
You can share this letter on LinkedIn by clicking here.
Subscribe to OMR for free by clicking the photo.
Stephen B. Blumenthal
Executive Chairman & CIO
CMG Capital Management Group, Inc.
75 Valley Stream Parkway, Suite 201,
Malvern, PA 19355
CMG Customer Relationship Summary (Form CRS)
Metric-Financial, LLC Customer Relationship Summary (Form CRS)

Stephen Blumenthal founded CMG Capital Management Group in 1992 and serves today as its Executive Chairman and CIO. Steve authors a free weekly e-letter entitled, “On My Radar.” Steve shares his views on macroeconomic research, valuations, portfolio construction, asset allocation and risk management. Author of Forbes Book: On My Radar, Navigating Stock Market Cycles.
Follow Steve on X @SBlumenthalCMG and LinkedIn.
IMPORTANT DISCLOSURE INFORMATION
This document is prepared by CMG Capital Management Group, Inc. (“CMG”) and is circulated for informational and educational purposes only. There is no consideration given to the specific investment needs, objectives, or tolerances of any of the recipients. Additionally, CMG’s actual investment positions may, and often will, vary from its conclusions discussed herein based on any number of factors, such as client investment restrictions, portfolio rebalancing, and transaction costs, among others. Recipients should consult their own advisors, including tax advisors, before making any investment decision. This material is for informational and educational purposes only and is not an offer to sell or the solicitation of an offer to buy the securities or other instruments mentioned. This material does not constitute a personal recommendation or take into account the particular investment objectives, financial situations, or needs of individual investors which are necessary considerations before making any investment decision. Investors should consider whether any advice or recommendation in this research is suitable for their particular circumstances and, where appropriate, seek professional advice, including legal, tax, accounting, investment, or other advice. The views expressed herein are solely those of Steve Blumenthal as of the date of this report and are subject to change without notice.
Investing involves risk.
This letter may contain forward-looking statements relating to the objectives, opportunities, and future performance of the various investment markets, indices, and investments. Forward-looking statements may be identified by the use of such words as; “believe,” anticipate,” “planned,” “potential,” and other similar terms. Examples of forward-looking statements include, but are not limited to, estimates with respect to financial condition, results of operations, and success or lack of success of any particular market, index, investment, or investment strategy. All are subject to various factors, including, but not limited to, general and local economic conditions, changing levels of competition within certain industries and markets, changes in legislation or regulation, Federal Reserve policy, and other economic, competitive, governmental, regulatory, and technological factors affecting markets, indices, investments, investment strategy and portfolio positioning that could cause actual results to differ materially from projected results. Such statements are forward-looking in nature and involve a number of known and unknown risks, uncertainties, and other factors, and accordingly, actual results may differ materially from those reflected or contemplated in such forward-looking statements. Investors are cautioned not to place undue reliance on any forward-looking statements or examples. All statements made herein speak only as of the date that they were made. Investing is inherently risky and all investing involves the potential risk of loss.
Past performance does not guarantee or indicate future results. Different types of investments involve varying degrees of risk, and there can be no assurance that the future performance of any specific investment, investment strategy, or product (including the investments and/or investment strategies recommended or undertaken by CMG), or any non-investment related content, made reference to directly or indirectly in this commentary will be profitable, equal any corresponding indicated historical performance level(s), be suitable for your portfolio or individual situation or prove successful. Due to various factors, including changing market conditions and/or applicable laws, the content may no longer be reflective of current opinions or positions. Moreover, you should not assume that any discussion or information contained in this commentary serves as the receipt of, or as a substitute for, personalized investment advice from CMG. Please remember to contact CMG, in writing, if there are any changes in your personal/financial situation or investment objectives for the purpose of reviewing/evaluating/revising our previous recommendations and/or services, or if you would like to impose, add, or to modify any reasonable restrictions to our investment advisory services. Unless, and until, you notify us, in writing, to the contrary, we shall continue to provide services as we do currently. CMG is neither a law firm, nor a certified public accounting firm, and no portion of the commentary content should be construed as legal or accounting advice.
No portion of the content should be construed as an offer or solicitation for the purchase or sale of any security. References to specific securities, investment programs or funds are for illustrative purposes only and are not intended to be, and should not be interpreted as recommendations to purchase or sell such securities.
This presentation does not discuss, directly or indirectly, the amount of the profits or losses realized or unrealized, by any CMG client from any specific funds or securities. Please note: In the event that CMG references performance results for an actual CMG portfolio, the results are reported net of advisory fees and inclusive of dividends. The performance referenced is that as determined and/or provided directly by the referenced funds and/or publishers, has not been independently verified, and does not reflect the performance of any specific CMG client. CMG clients may have experienced materially different performance based upon various factors during the corresponding time periods. See in links provided citing limitations of hypothetical back-tested information. Past performance cannot predict or guarantee future performance. Not a recommendation to buy or sell. Please talk to your advisor.
Information herein has been obtained from sources believed to be reliable, but we do not warrant its accuracy. This document is general communication and is provided for informational and/or educational purposes only. None of the content should be viewed as a suggestion that you take or refrain from taking any action nor as a recommendation for any specific investment product, strategy, or other such purposes.
In a rising interest rate environment, the value of fixed-income securities generally declines, and conversely, in a falling interest rate environment, the value of fixed-income securities generally increases. High-yield securities may be subject to heightened market, interest rate, or credit risk and should not be purchased solely because of the stated yield. Ratings are measured on a scale that ranges from AAA or Aaa (highest) to D or C (lowest). Investment-grade investments are those rated from highest down to BBB- or Baa3.
NOT FDIC INSURED. MAY LOSE VALUE. NO BANK GUARANTEE.
Certain information contained herein has been obtained from third-party sources believed to be reliable, but we cannot guarantee its accuracy or completeness.
In the event that there has been a change in an individual’s investment objective or financial situation, he/she is encouraged to consult with his/her investment professional.
Written Disclosure Statement. CMG is an SEC-registered investment adviser located in Malvern, Pennsylvania. Stephen B. Blumenthal is CMG’s founder and CEO. Please note: The above views are those of CMG and its CEO, Stephen Blumenthal, and do not reflect those of any sub-advisor that CMG may engage to manage any CMG strategy, or exclusively determines any internal strategy employed by CMG. A copy of CMG’s current written disclosure statement discussing advisory services and fees is available upon request or via CMG’s internet web site at www.cmgwealth.com/disclosures. CMG is committed to protecting your personal information. Click here to review CMG’s privacy policies.
See CMG Disclosures at the bottom of this page.
For more information about NDR, please visit at www.ndr.com.
NDR, Inc. (NDR), d.b.a. Ned Davis Research Group (NDRG), any NDRG affiliates or employees, or any third-party data provider, shall not have any liability for any loss sustained by anyone who has relied on the information contained in any NDRG publication. The data and analysis contained herein are provided "as is." NDRG disclaims any and all express or implied warranties, including, but not limited to, any warranties of merchantability, suitability or fitness for a particular purpose or use. NDRG's past recommendations and model results are not a guarantee of future results. This communication reflects our analysts' opinions as of the date of this communication and will not necessarily be updated as views or information change. All opinions expressed herein are subject to change without notice. NDRG or its affiliated companies or their respective shareholders, directors, officers and/or employees, may have long or short positions in the securities discussed herein and may purchase or sell such securities without notice. For NDRG's important additional disclaimers, refer to www.ndr.com/invest/public/copyright.html. Further distribution prohibited without prior permission. Copyright 2025 © NDR, Inc. All rights reserved.