November 6, 2026
By Steve Blumenthal
“There’s no chance that the iPhone is going to get any significant market share. No chance.”
That was Steve Ballmer, then CEO of Microsoft, in the spring of 2007. An intelligent man who ran one of the most profitable companies on earth. He looked at a $500 phone with no keyboard and reasoned it was a toy. What he missed was not the phone; he missed the size of the brand-new market the iPhone would create.
In its first seven years, the iPhone generated roughly $260 billion in revenue. It is the benchmark for a product that changed how we live. I want you to hold that number in your head, and we are going to come back to it in a moment.
I thought about Ballmer this week as I watched the market take a punch to the gut. On Thursday, Nvidia fell more than 9%. The Nasdaq dropped 5.5%, its worst day since the April 2025 tariff shock, Microsoft declined more than 3%, and the S&P 500 fell 4.4%. The trigger: Democrats won both chambers of Congress on Tuesday, including in states where opposition to new data centers has been building, and investors began pricing in tougher rules for the AI buildout. I spoke with a long-time client who builds data centers this afternoon. The opposition his business faces is real and complex. I learned a lot on the call and will share my notes with you next week.
The question in my mind, and I’m sure yours as well, is just how big can AI be? Like Ballmer with the iPhone, I’m not sure I fully grasp the scale and pace of the AI revolution, and what it means for the productivity of businesses and you and me. The amount of AI company debt being issued and the competition it faces (the U.S. Treasury, for example) are macro concerns. The reality is both things can be true at the same time. That is the tension I want to think through with you today.
So grab a coffee and find your favorite chair. Let’s try to make sense of the size of the prize, the cost of chasing it, and what I believe may be a much bigger plan taking shape in Washington.
Included in this week’s On My Radar:
The Size of the Prize: What Anthropic’s S-1 Tells Us
Who Pays for It: AI Debt Meets the Treasury Market
Good As Gold
Trade Signals: November 5, 2026
Personal Note: The State Playoffs
OMR is for informational and educational purposes only. No consideration is given to your specific investment needs, objectives, or tolerances.
Please see the Important Disclosures at the bottom of this page. Reminder: This is not a recommendation to buy or sell any security. My views may change at any time. The information is for discussion and educational purposes only.
If you like what you are reading, you can subscribe for free.

The Size of the Prize: Anthropic’s S-1
Anthropic (ANT), the company behind the Claude AI models, filed its S-1 with the SEC on October 26. An S-1 is the document a company files before it goes public. It lays out the business, the numbers, and the risks. Goldman Sachs and Morgan Stanley are leading the deal, which is reportedly targeting an IPO date around November 16, just before Thanksgiving. The company is looking to raise roughly $100 billion. That would make it the largest IPO in history, surpassing SpaceX’s $85 billion raise in June. Valuation talks range from $1.5 to $2 trillion.
The best discussion I found on the filing came from last week’s All-In podcast (Episode 295). David Sacks, Chamath Palihapitiya, David Friedberg, and Jason Calacanis spent the first half hour on it. I’ve pulled their key charts below, along with my own math. My goal is to explain this in a way my wife, Susan, would find interesting and useful. She is smart as can be, but she doesn’t live in the investment macro world. My hope is to keep it simple so you can explain it to your loved ones as well.
The revenue is the story. Anthropic generated $16.3 billion in revenue in the first half of 2026, about 14 times the amount in the same period a year earlier. Second-quarter revenue alone was $11.6 billion. On the podcast, Jason noted the company is projecting $100 billion in annualized revenue by year-end.
Importantly, margins are going up, not down. Gross margin is what a company keeps from each dollar of sales after paying the direct cost of delivering the product. A year ago, Anthropic kept about 12 cents. Today, it keeps about 85 cents.
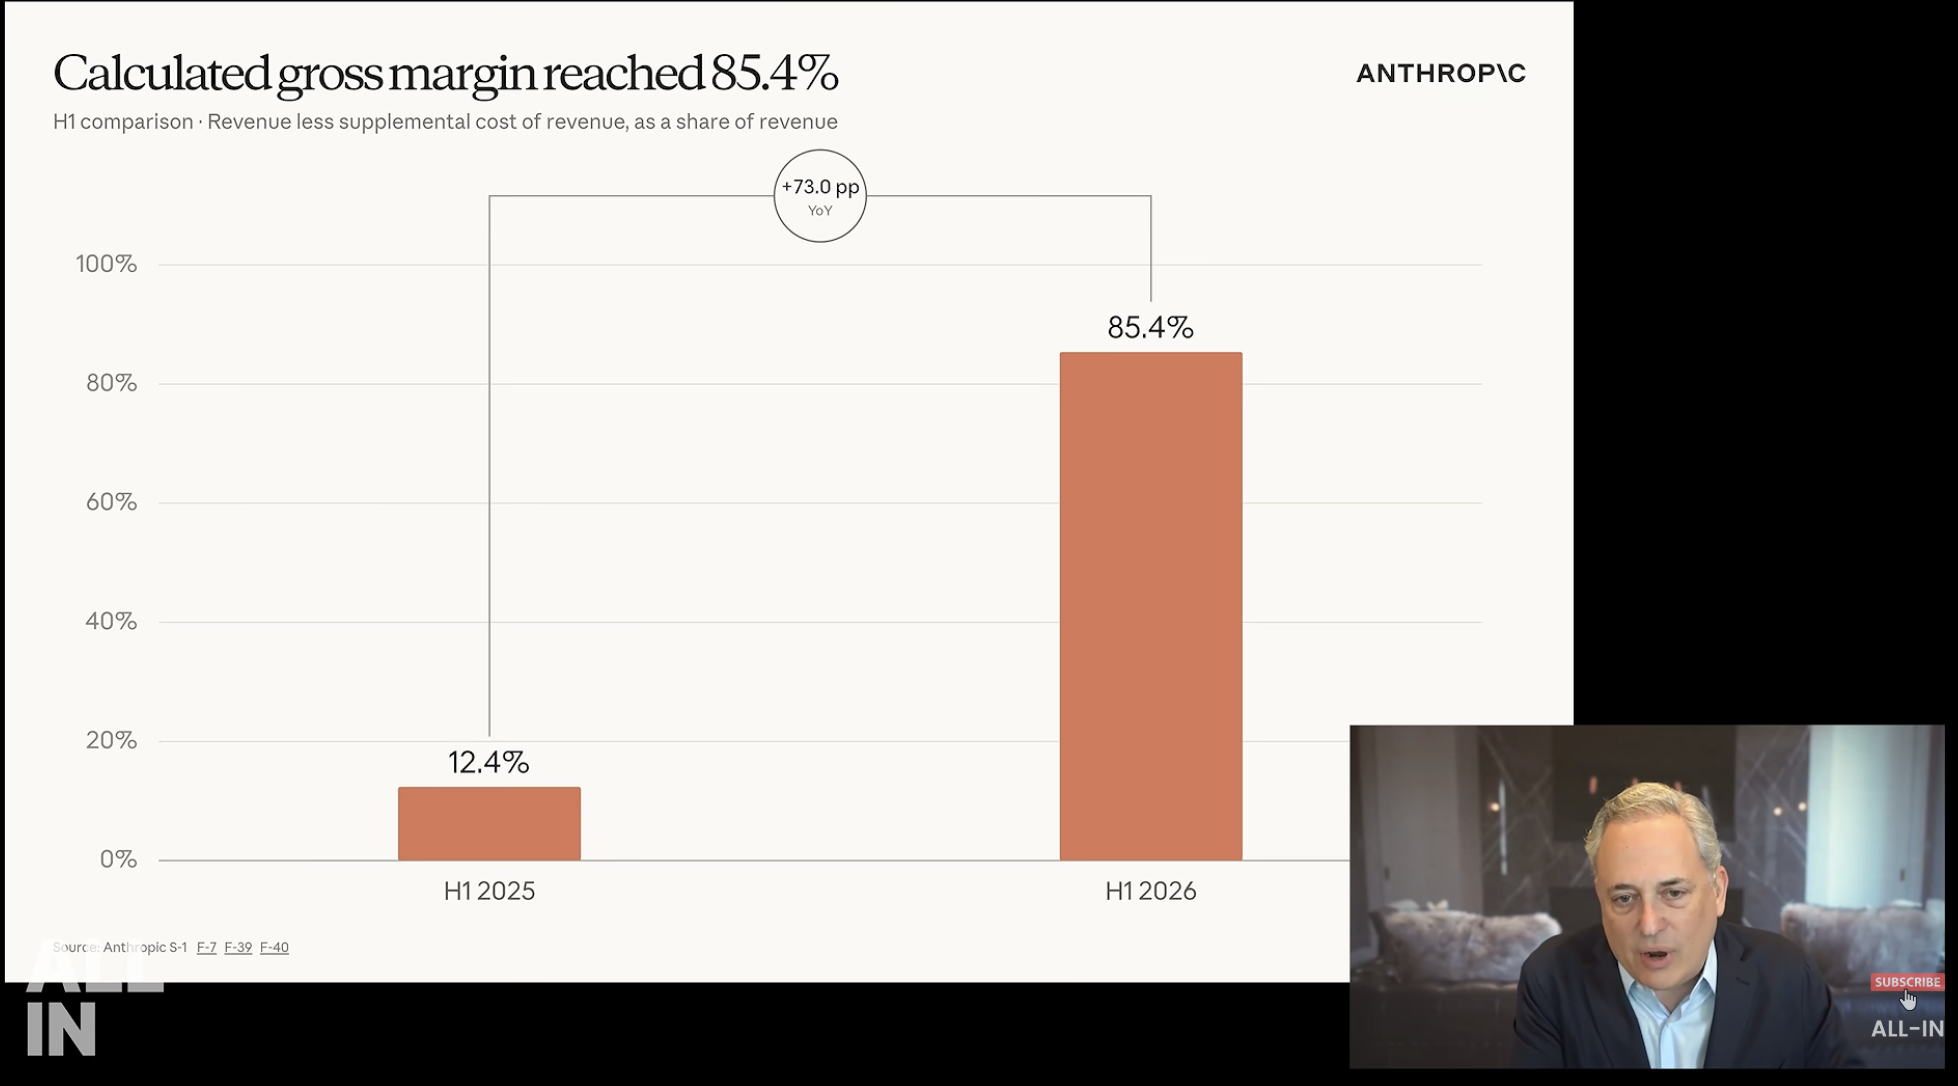
Source: All In, Anthropic’s gross margin jumped from 12.4% in the first half of 2025 to 85.4% in the first half of 2026. Source: Anthropic S-1, via All-In Podcast Ep. 295
The part I find remarkable is that they are cutting prices while still making more money. Sacks explained that Anthropic’s models get roughly ten times more efficient each year at a given task. The company passes part of that savings to customers by cutting prices and keeps the rest as margin. Anthropic calls these gains “compute multipliers”: better algorithms, better data, and better design that deliver the same answer for a fraction of the cost.
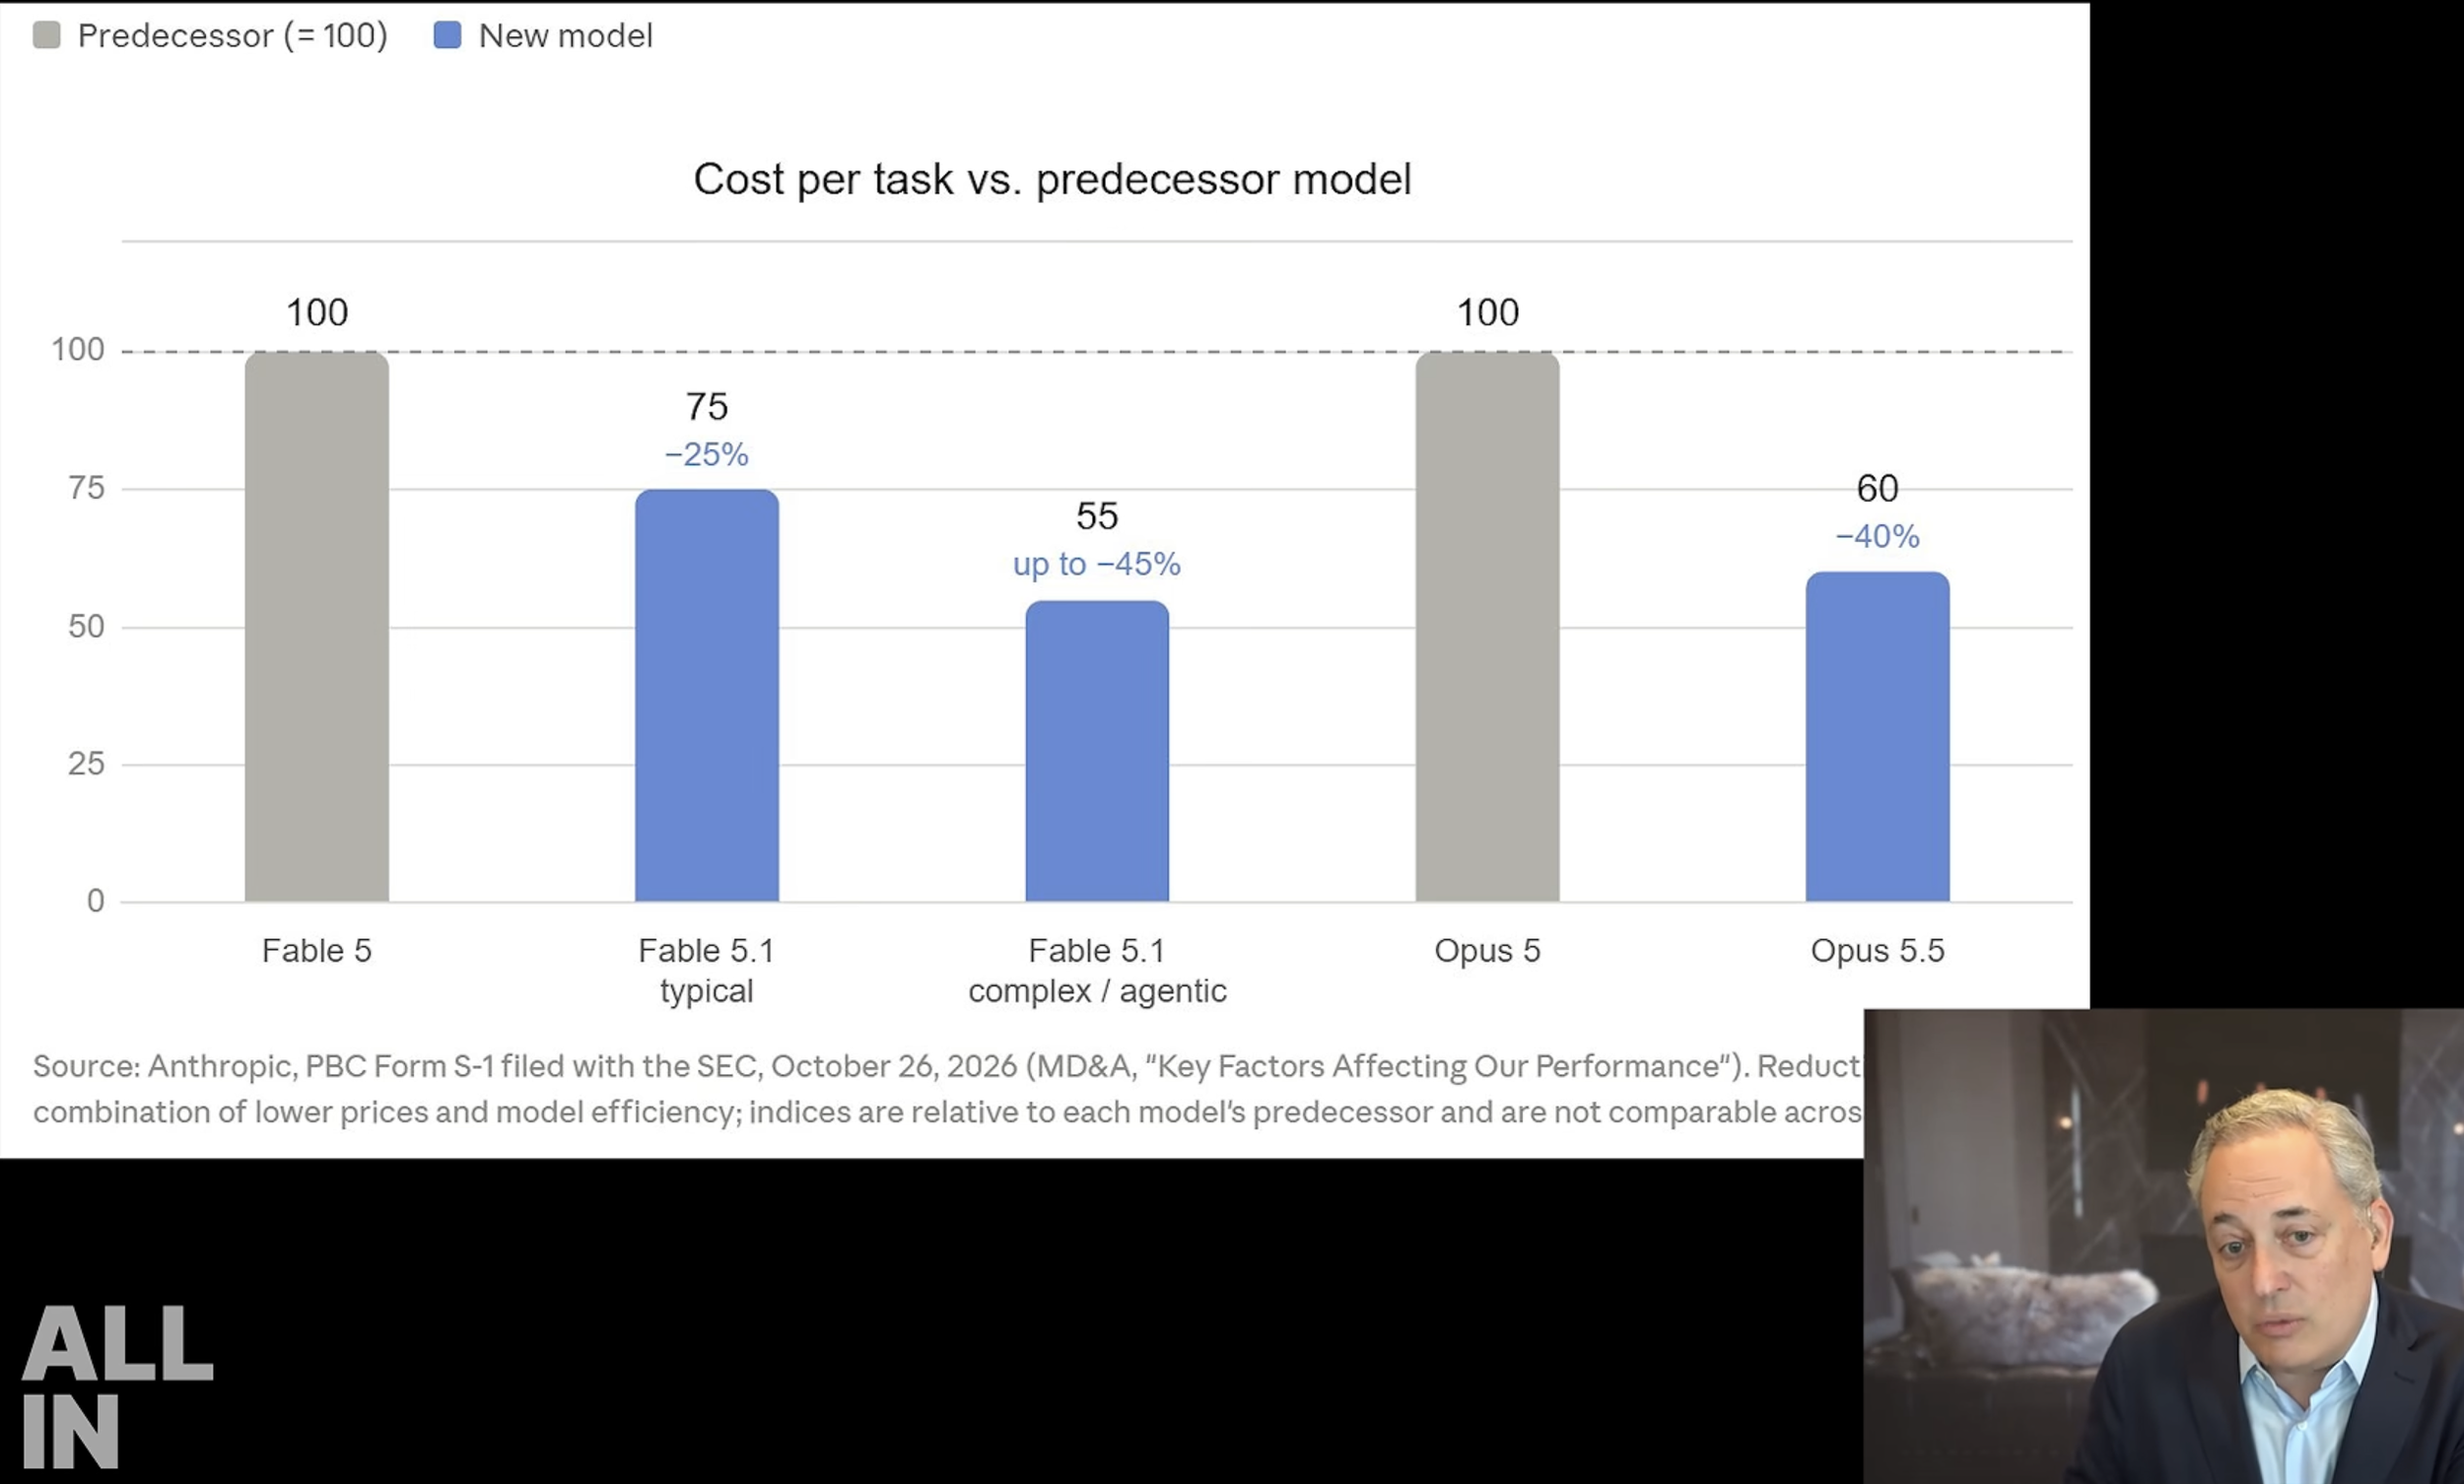
The cost to complete a task with Anthropic’s newest models fell 25% to 45% versus the prior version.
Source: Anthropic S-1 (MD&A), via All-In Podcast Ep. 295
Think of it like a restaurant that figures out how to make the same meal for a tenth of the cost. It cuts the menu price in half. Customers are thrilled, more of them are showing up, and the restaurant’s profit per plate continues to rise. Admittedly, harder to do in real life for most businesses. For Anthropic, it is a powerful competitive position. It means they have room to keep lowering prices to win market share. You’ll see why when we look at the potential revenue numbers.
Before we do, you may have seen headlines about a massive loss. Sacks explained that it came from convertible notes issued to infrastructure partners like Amazon. The media reported an “$80 billion loss,” but it wasn’t a cash loss; it was an accounting entry. As Anthropic’s valuation rose, accounting rules required those convertible notes to be marked up, and that showed up as a loss on the income statement. No cash left the building. Had the company issued stock instead, the loss would not exist. In fact, according to Sacks and Chamath, Anthropic has burned only about $9 to $10 billion in its entire history, and it entered the summer with about $125 billion in net cash. That is more cash, net of debt, than almost any company on earth.
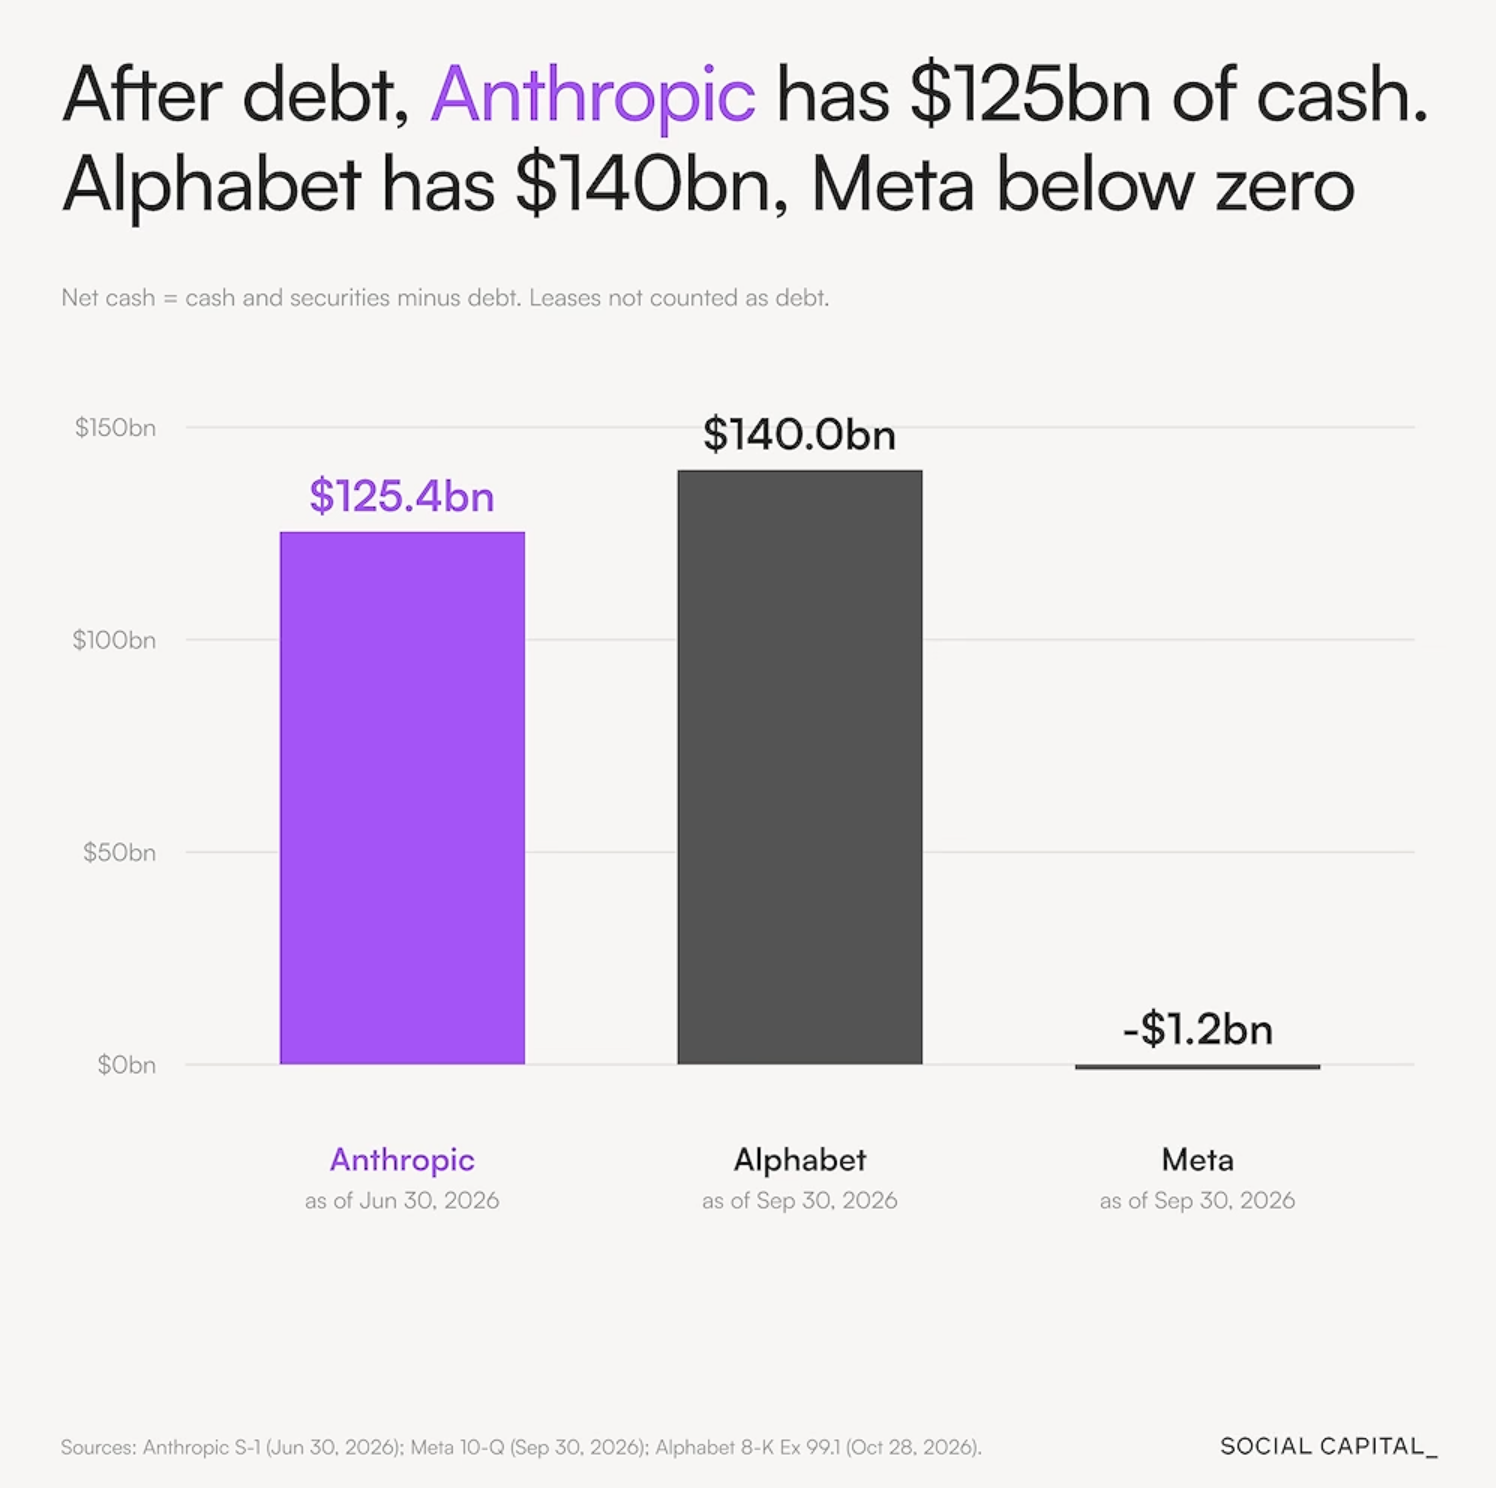
Net cash (cash and securities minus debt): Anthropic $125.4 billion, Alphabet $140.0 billion, Meta below zero.
Source: Social Capital; Anthropic S-1, Meta 10-Q, Alphabet 8-K
Here is the chart that hit me. It shows the number of customers spending $100,000 or more per year with Anthropic. The point is they have captured a very small percentage of clients. First the chart, then the explanation.
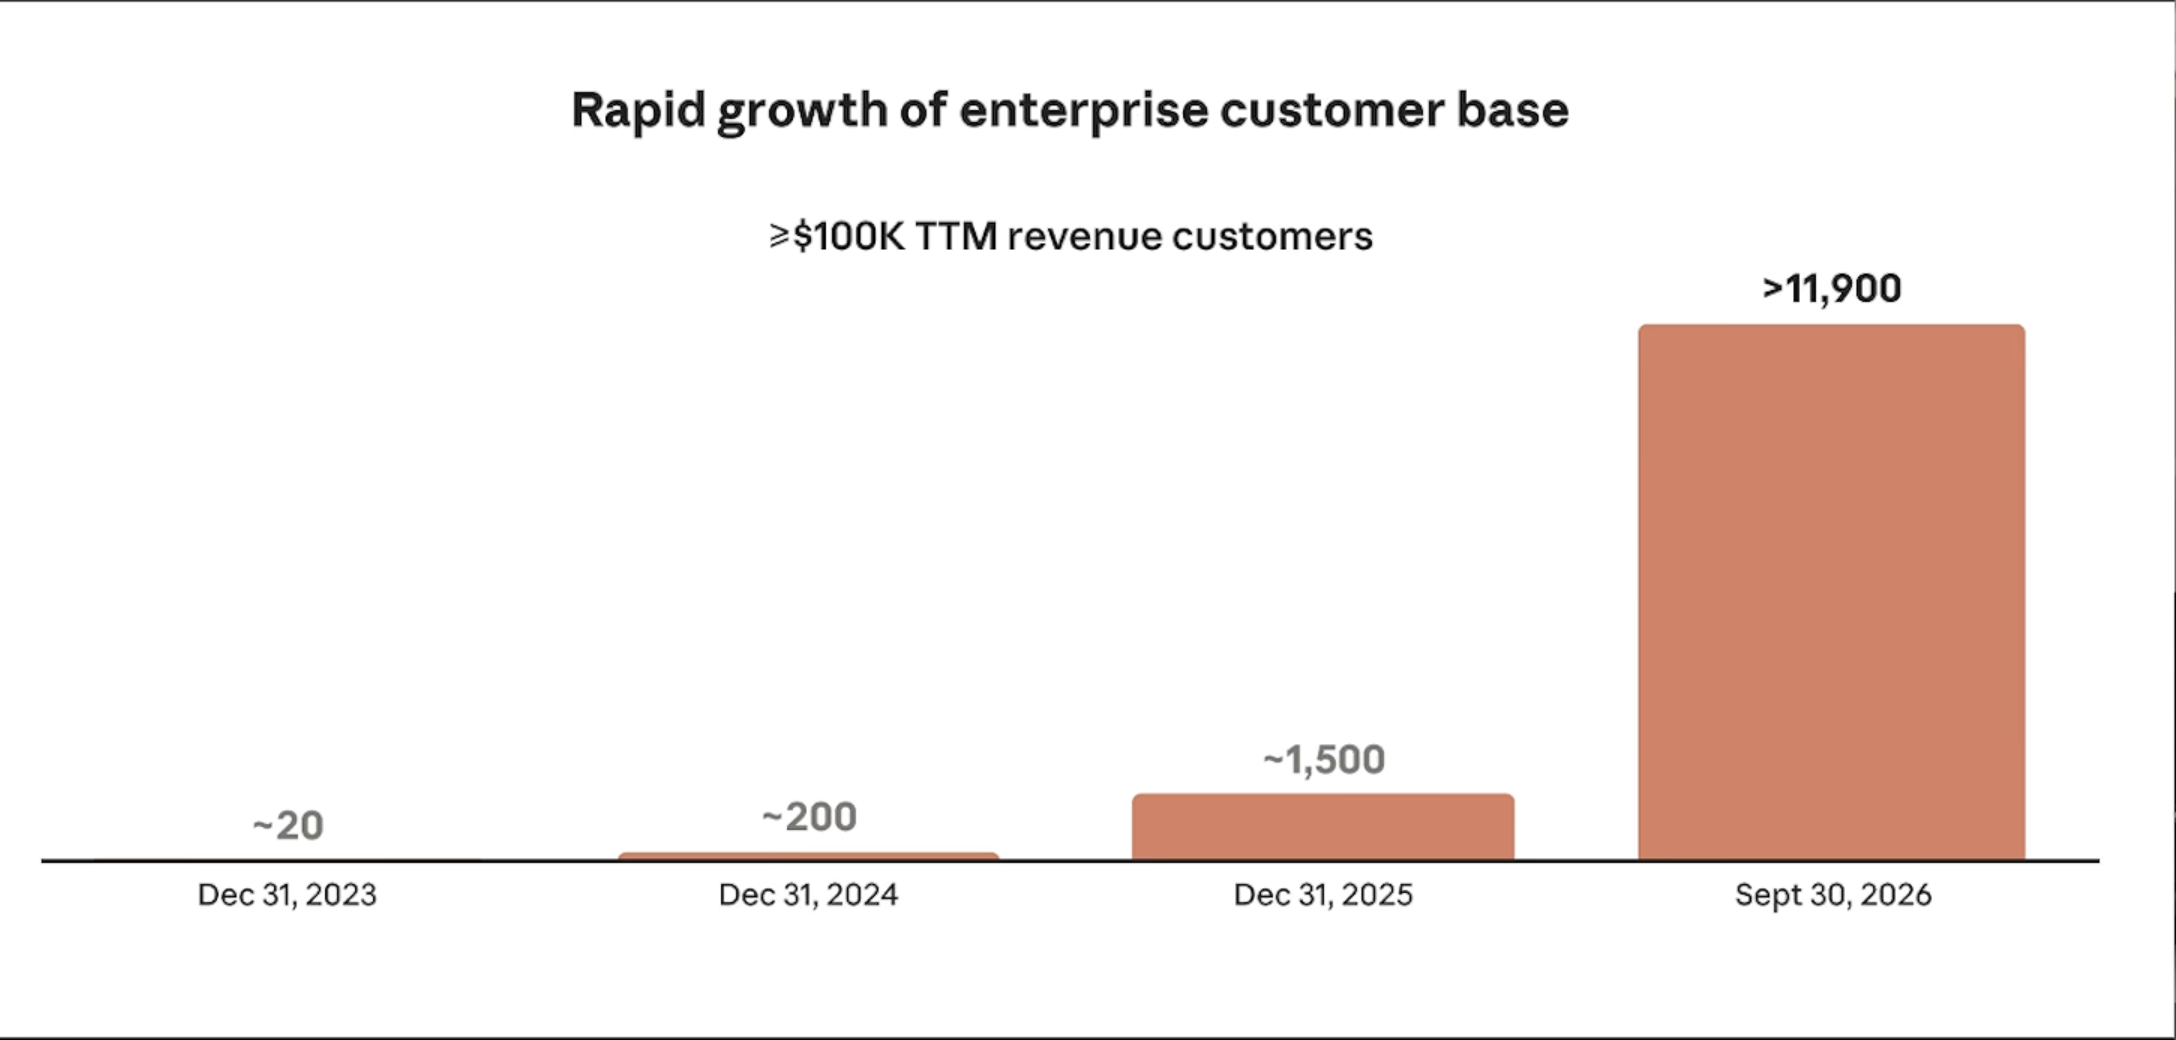
Customers spending $100,000+ per year: about 20 at the end of 2023, about 200 at the end of 2024, about 1,500 at the end of 2025, and more than 11,900 as of September 30, 2026.
Source: Anthropic S-1, via All-In Podcast Ep. 295
Friedberg asked a simple question. How many companies in the world are large enough that $100,000 a year would be less than 1% of their total annual spend? His answer: about 200,000 to 300,000 in the U.S., and a bit over one million globally. So Anthropic has penetrated roughly 1% of its natural customer base.
And the customers it does have are barely getting started. Friedberg estimates they are spending less than 10% of what they could reasonably spend. A footnote in Chamath’s chart below backs that up: in the third quarter, Fortune 500 customers’ spending with Anthropic averaged less than 0.1% of their total expenses. That’s not a typo. Less than one tenth of one percent.
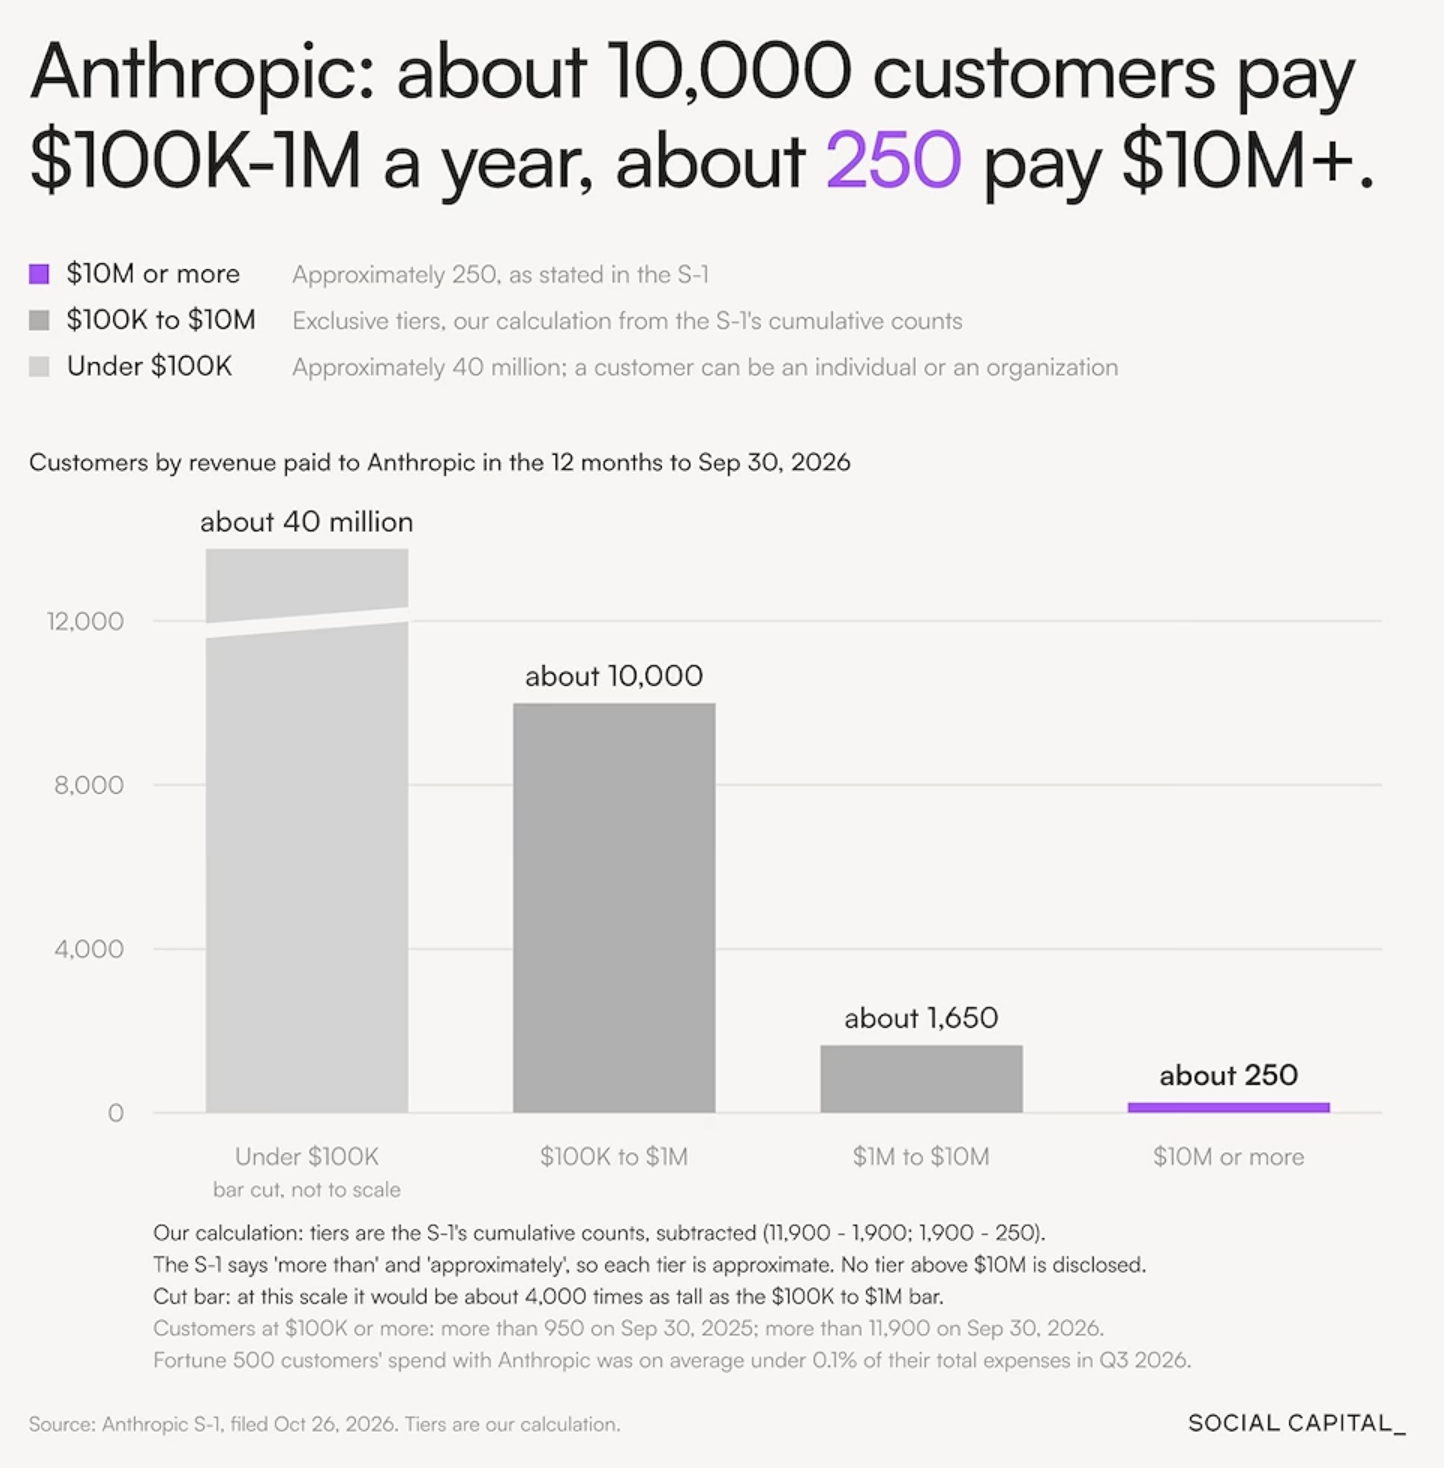
About 10,000 customers pay Anthropic $100,000 to $1 million a year; about 1,650 pay $1 million to $10 million; about 250 pay $10 million or more. Another 40 million individuals and small businesses spend less than $100,000.
Source: Social Capital; Anthropic S-1
Chamath made an important point about why the smaller deals are growing so fast. Inside large companies, budgets get pushed down to directors and VPs who each control something like a million dollars. They can experiment. I’m one of those small companies, and the lift Claude is giving to my business is fantastic.
Once a deal moves into the multi-million-dollar range, it requires a formal case for return on investment. About 1,900 companies have made that case so far, and many of those are AI-native startups. Strip them out, and you are left with perhaps a couple hundred large global companies. In his words, the return-on-investment case “is still a little speculative, but the potential is there.” Anthropic puts its potential total addressable market at $40 trillion per year. I’m not buying it, but it speaks to the size of the revenue opportunity.
My back-of-the-napkin math
I wanted to get my arms around a conservative guess at the size of this, so I asked a simple “what if.” Think of three dials:
How many customers? Today, about 11,900 large customers out of a potential one million. What if Anthropic reaches 10% of them (100,000)? What if it reaches 30% (300,000)?
How much does each one spend? Today, they spend roughly 10% of what they could. What if that rises to 50%? That is five times more usage.
What does each unit cost? What if Anthropic cuts its prices in half to win that business?
Five times the usage at half the price means each customer pays about 2.5 times what they pay today. The one number we don’t know is today’s average spend per customer, so I ran three versions. The low case assumes the typical new customer looks like the smaller accounts today ($300,000 per year). The high case uses the blended average across all Anthropic’s large customers today, which I estimate at roughly $1.2 million.

Illustrative annual revenue from large business customers only. Assumes spend per customer rises 5x and prices fall 50% (2.5x today’s spend). Excludes the 40 million smaller users. My math, not a forecast.
If I had to pick a reasonable number for 30% penetration, I would land somewhere between $225 and $450 billion a year, and that is from large businesses alone. For perspective, Microsoft generated $332 billion in revenue in its most recent fiscal year. Chamath’s own read was similar: you don’t need 100% of what’s possible, you need 25% or 30%, and that gets you to “hundreds of billions of dollars” in revenue in a three-to-seven-year time frame.
Now let me be careful, because I want to get this right. Anthropic’s S-1 cites a total addressable market of $40 trillion. U.S. GDP is about $30 trillion. It is tempting to add the two together and imagine a $70 trillion economy. That is not really how it works. The $40 trillion is better understood as the value of the work that AI could touch, so some of it already falls within today’s GDP. Anthropic may capture a meaningful slice of it. The bigger prize is the productivity gains spread across every business that uses these tools, and what that means for overall U.S. productivity (and, of course, productivity in your home country if you live outside the U.S.). That is what can grow the economy, and that is the part that matters most for the debt discussion I want to get into below. As you are well aware, I obsess over the end of the long-term debt super cycle we find ourselves in. How we might get out of it and how we, as investors, may best position our wealth.
Where the money goes
Friedberg asked a second question: is anyone actually making money? He traced a single dollar through the AI food chain, and the answer surprised me. First the chart, then the explanation.
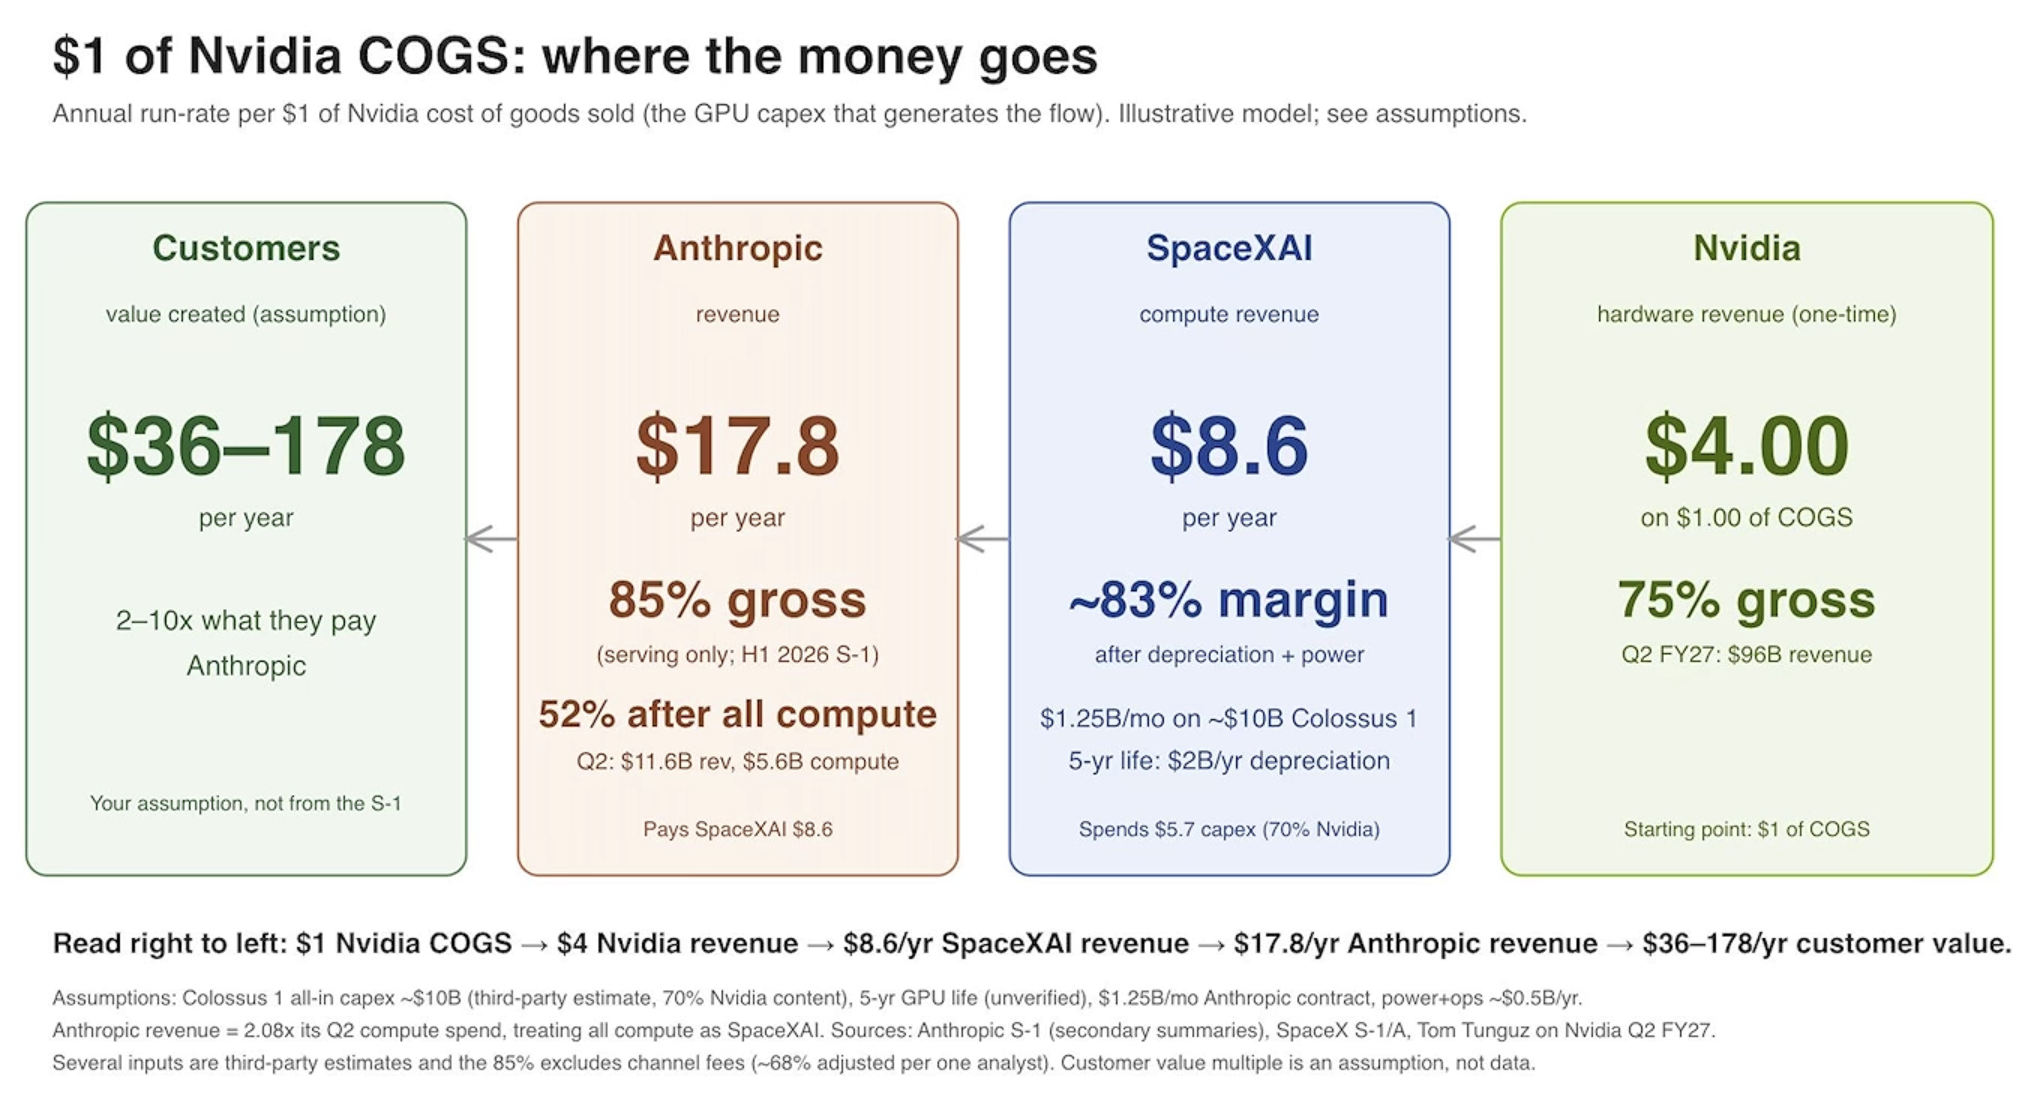
$1 of Nvidia’s production cost becomes $4 of Nvidia revenue, $8.60 per year of data-center revenue, and $17.80 per year of Anthropic revenue. The customer value on the far left is Friedberg’s assumption, not data.
Source: David Friedberg, All-In Podcast Ep. 295 (illustrative model)
Read the chart right to left. Nvidia spends $1 to make a chip and sells it for $4. The data center that buys the chip earns about $8.60 a year renting out its computing power. Anthropic turns that into about $17.80 a year of revenue. If the customer gets two to ten times the value they pay, and they keep coming back and spending more, it suggests real productivity is being created at every link in the chain. Friedberg was quick to admit that the last box is his own assumption. I appreciate the honesty. The customer growth suggests he is heading in the right direction.
Doing more with the same people
Chamath’s team put together this chart on Microsoft, and I think it is one of the most important charts in this week’s letter.
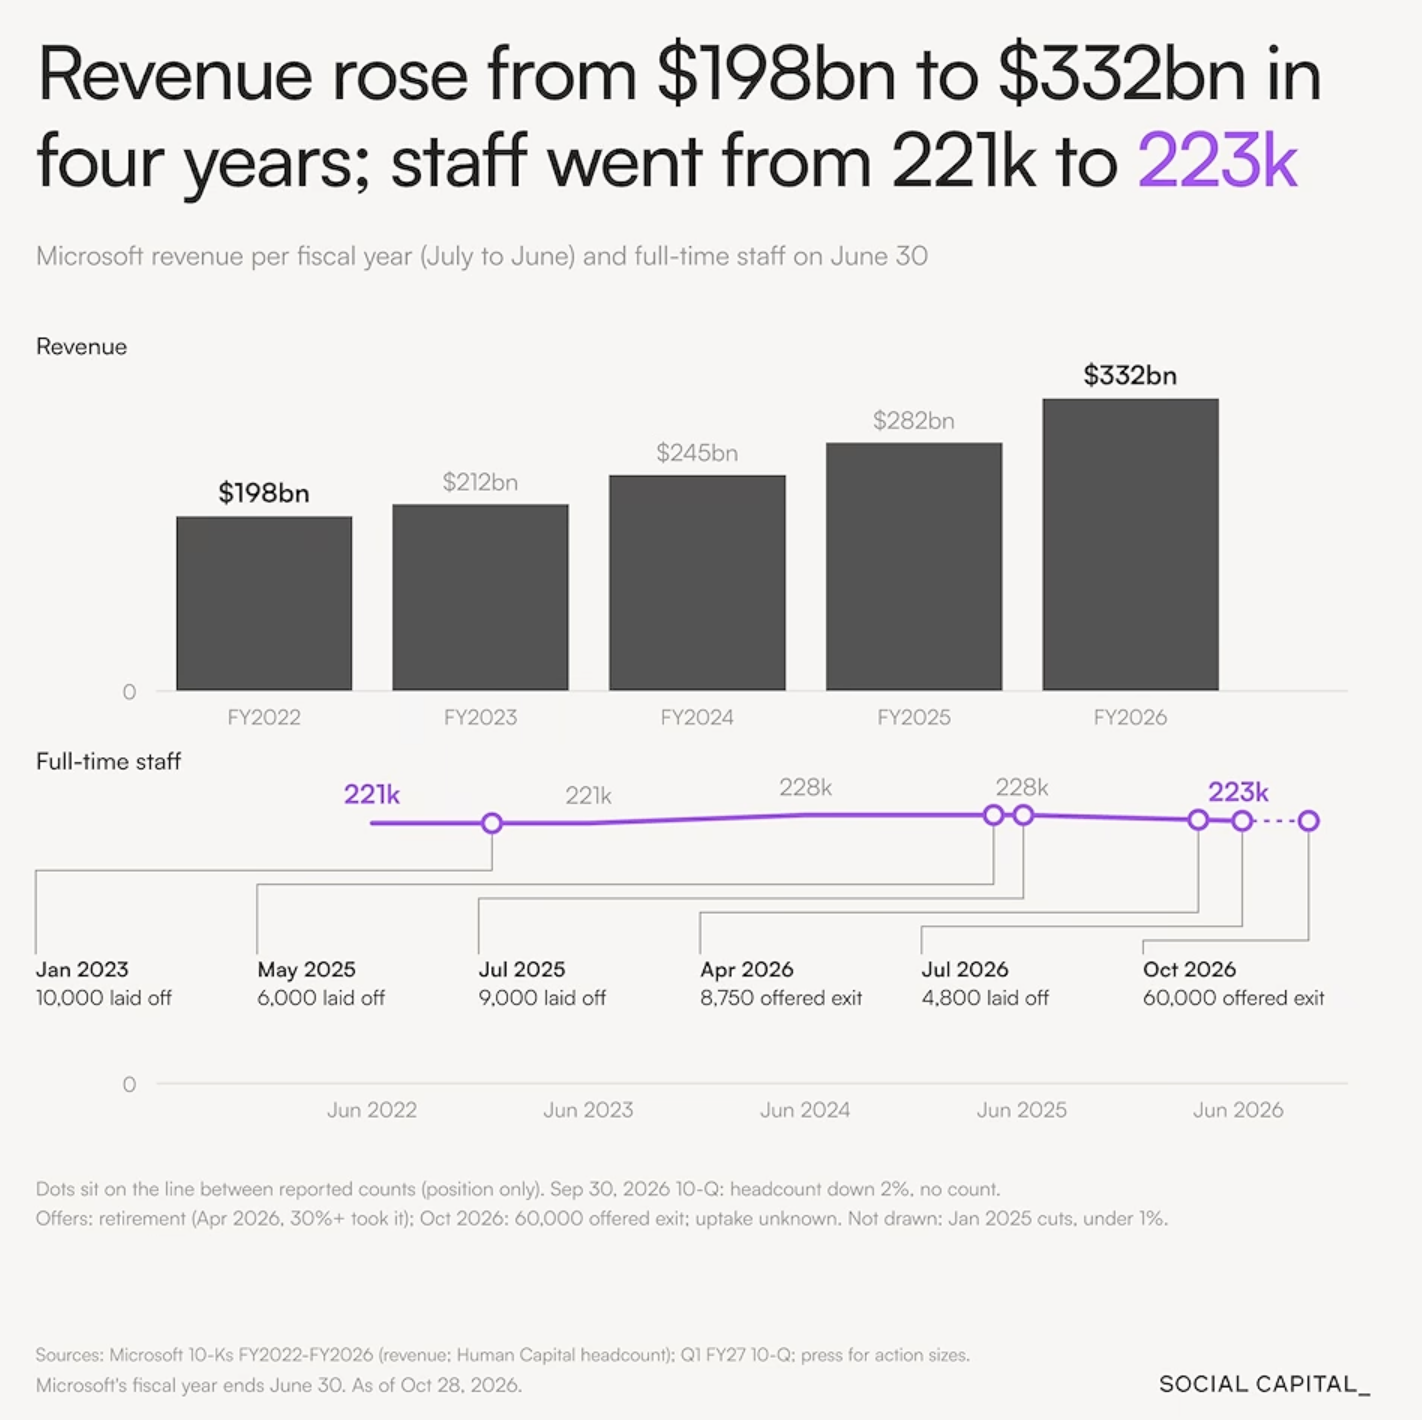
Microsoft’s revenue rose from $198 billion to $332 billion in four years, while full-time staff went from 221,000 to 223,000.
Source: Social Capital; Microsoft 10-K filings
Since June 2022, Microsoft grew revenue by about 68% while adding roughly 2,000 people. Before AI, you would have expected headcount to rise right along with sales. It didn’t. The point is that this is what productivity looks like in the real world.
It is the same output story that gives me hope on the national debt, which we’ll get to shortly.
Remember the iPhone’s $260 billion over its first seven years?
Jason shared this chart comparing that run with Anthropic’s. He also included Amazon’s and Google’s first 7 years. This may be one of the greatest business stories ever!
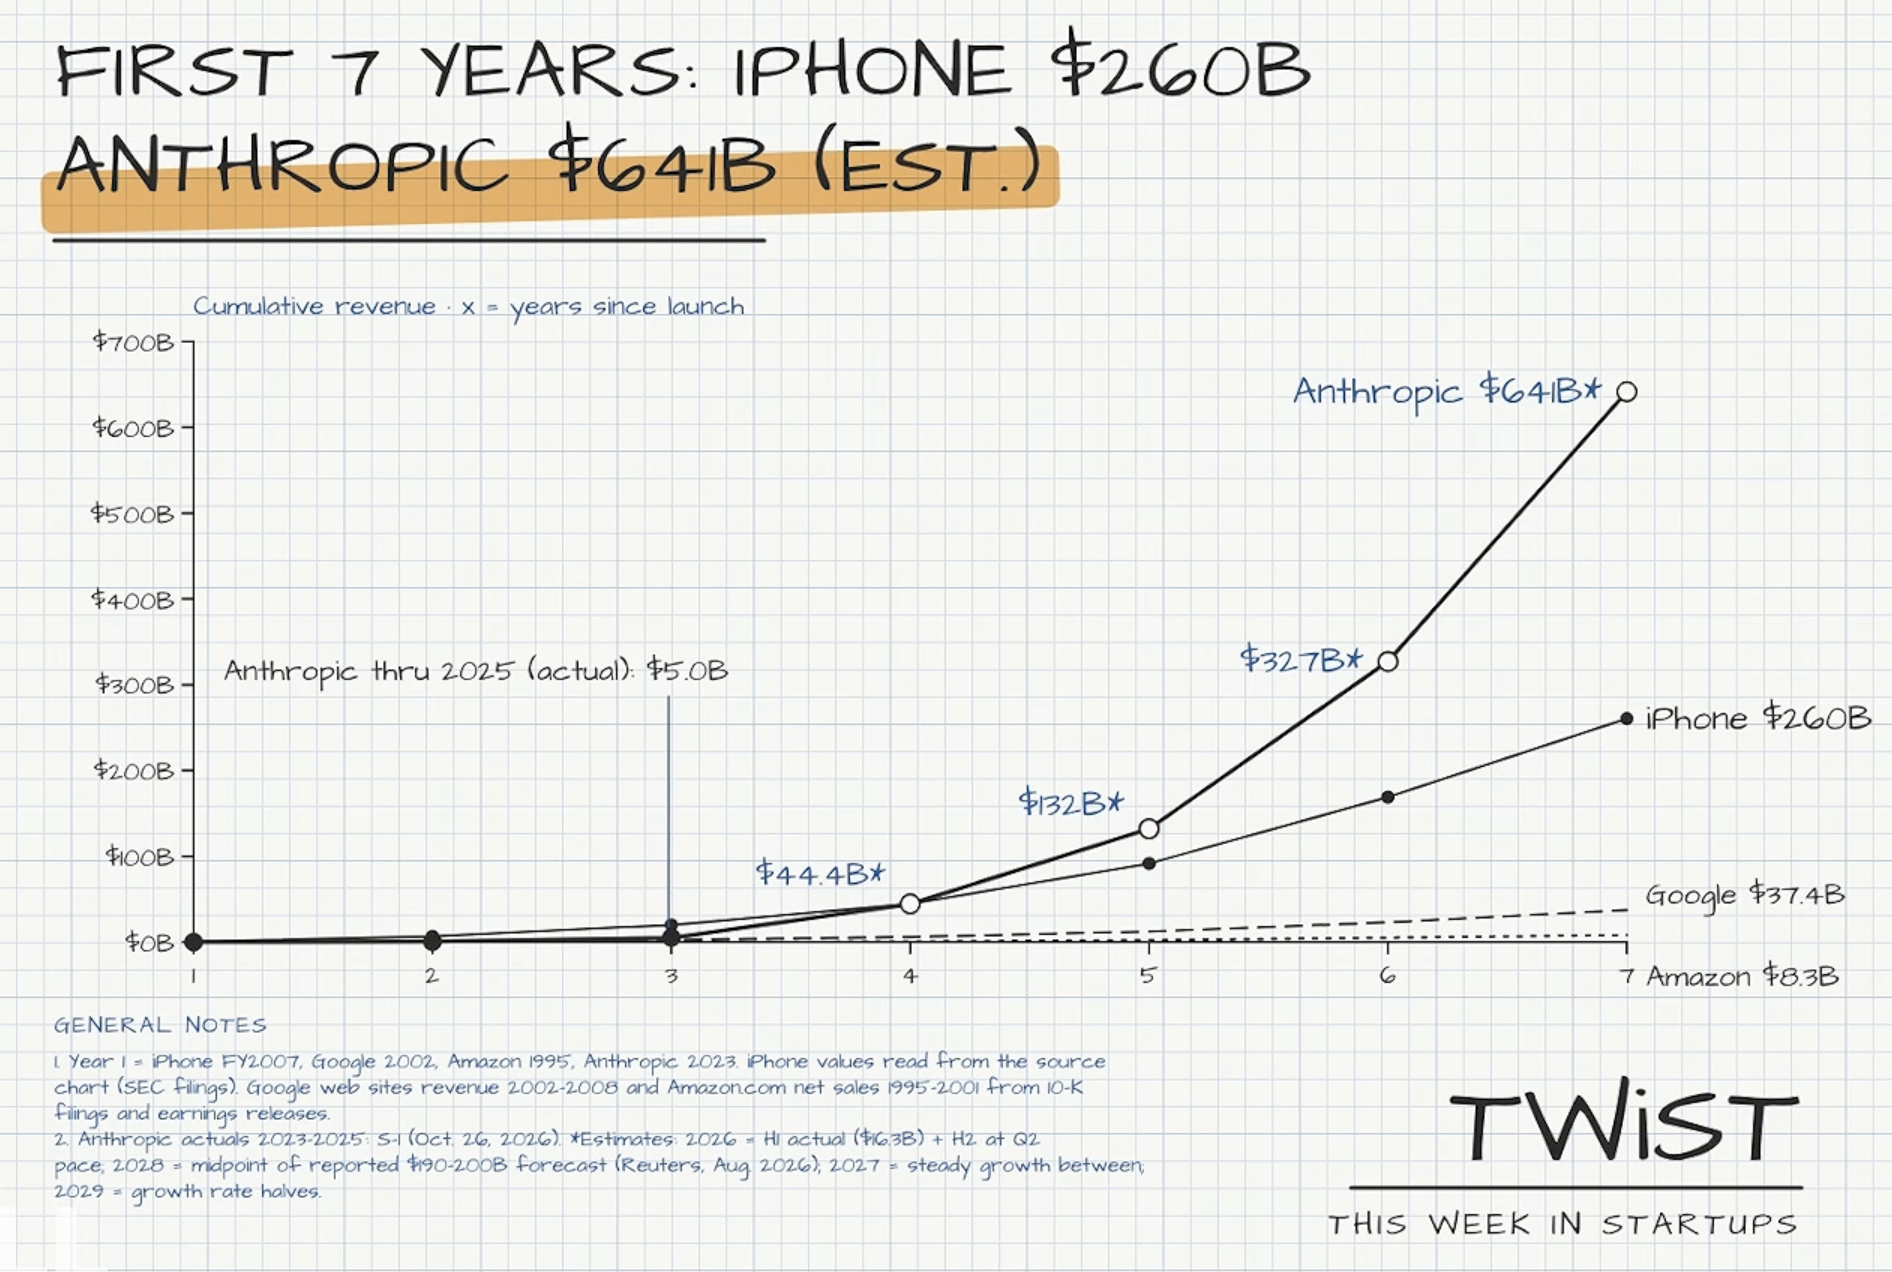
Cumulative revenue over the first seven years: iPhone $260 billion; Anthropic an estimated $641 billion.
Source: This Week in Startups; Anthropic S-1 (2023–2025 actuals), estimates for 2026–2029
The company crossed the iPhone’s cumulative line in year four. Chamath called it “the most incredible business I’ve ever seen.” He also noted that whispers suggest revenue growth moderated to around 50% in the third quarter. That’s something for us to monitor going forward.
If the IPO prices after November 11, the company will have to update the filing with third-quarter results, and we will know more. Either way, we’ll soon know.
Chamath shared some advice helpful for all of us geeks digging into company S-1 filings. He said the first thing he reads in any S-1 is the risk factors. Interestingly, he had his team count the words Anthropic devoted to each risk. Compute is number one, narrowly ahead of regulation.
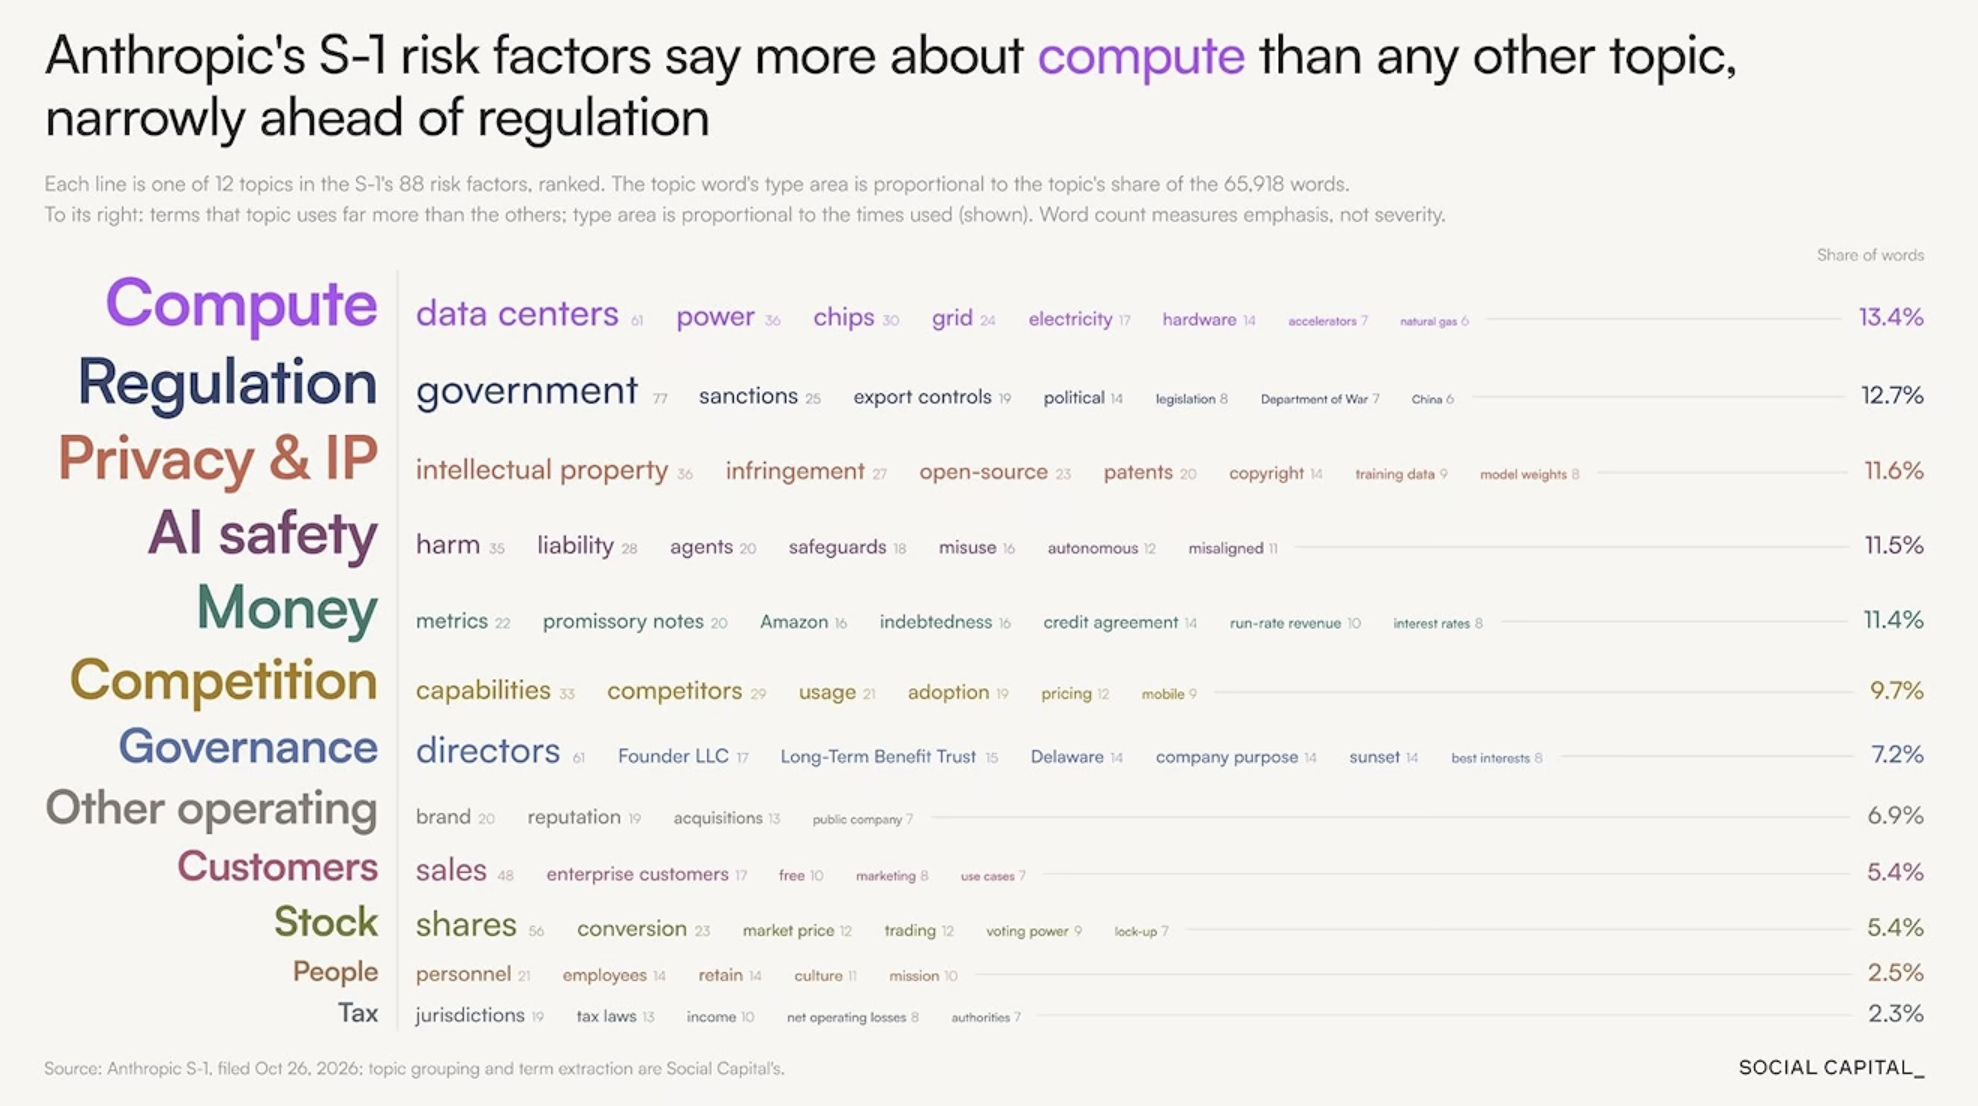
Share of words in Anthropic’s risk factors by topic: compute 13.4%, regulation 12.7%, privacy and IP 11.6%, AI safety 11.5%.
Source: Social Capital; Anthropic S-1
Then he zoomed in on compute. The biggest worry inside compute is data centers, followed by financing commitments and power.
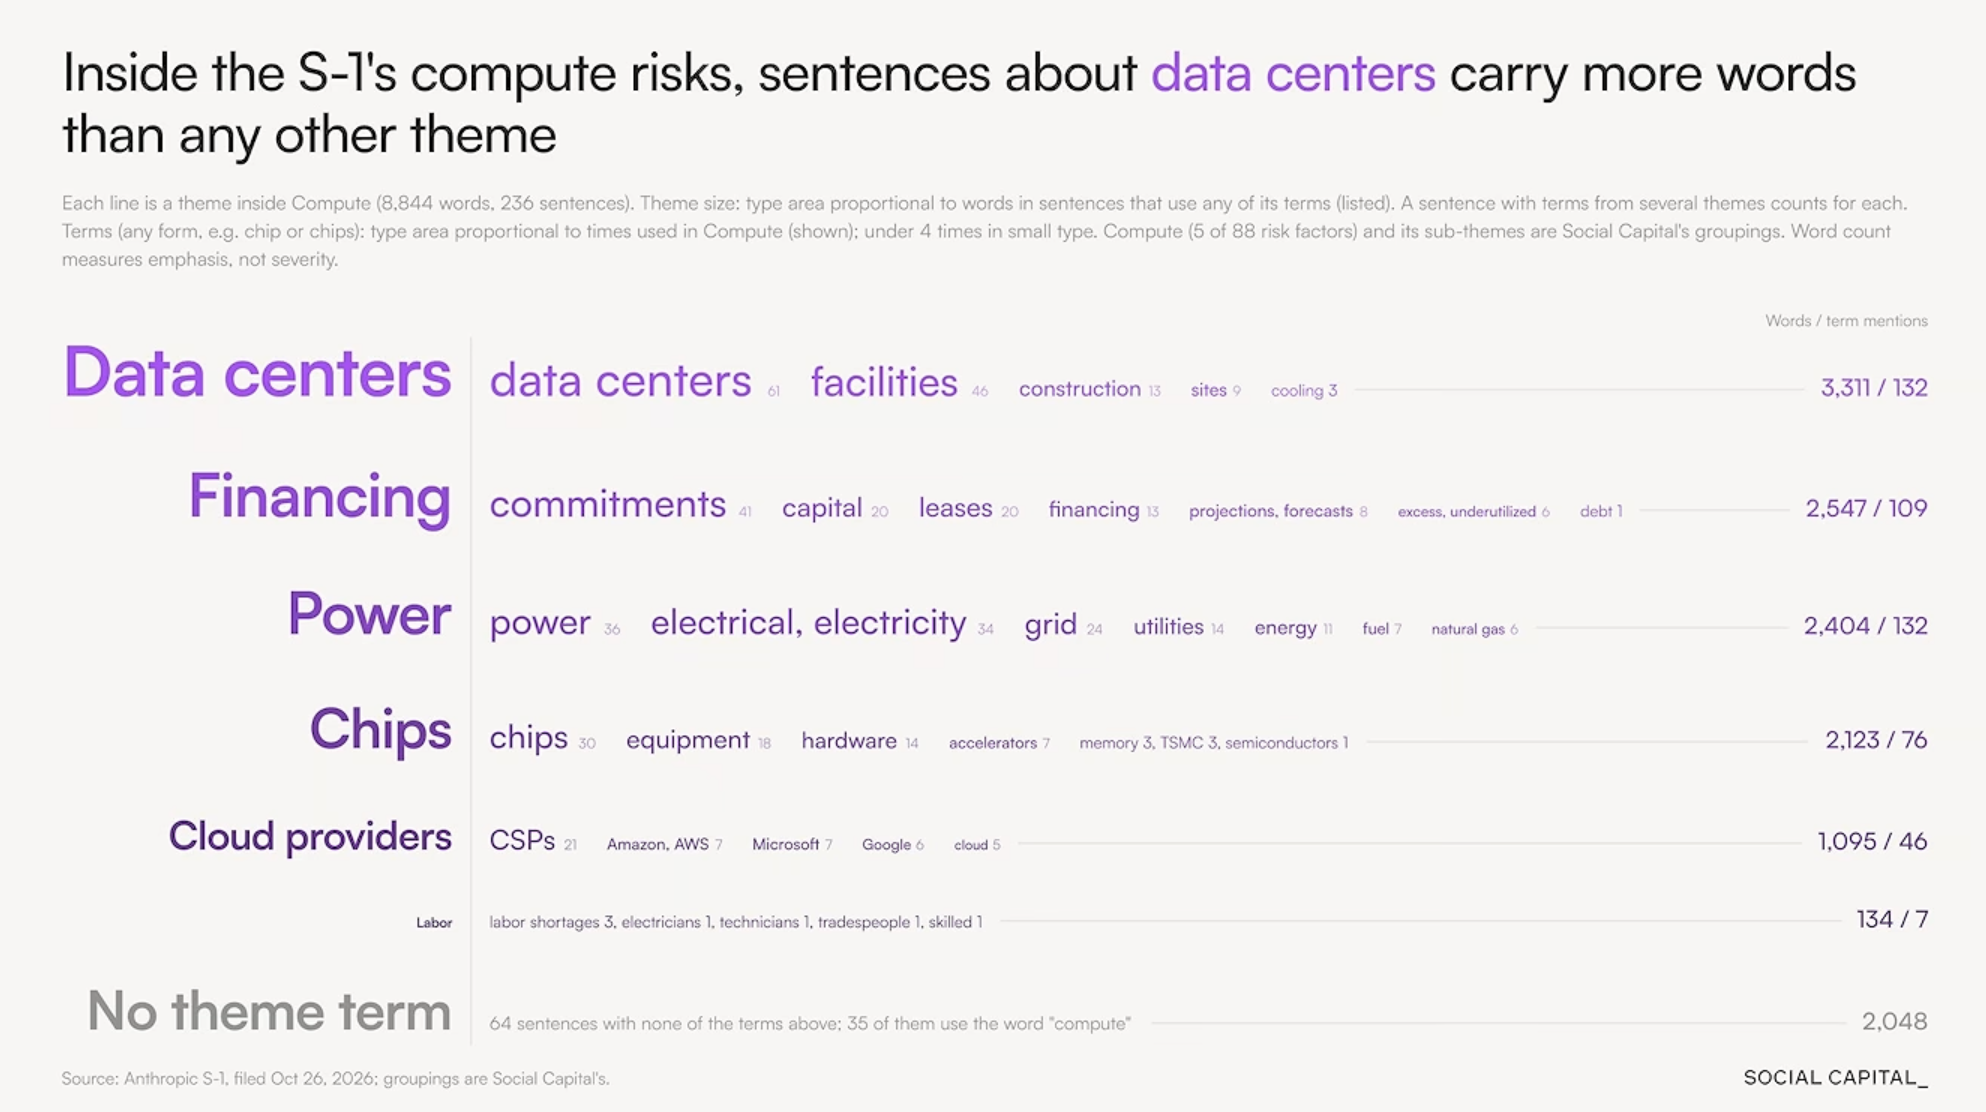
Within Anthropic’s compute risks, data centers, financing commitments, and power carry the most words.
Source: Social Capital; Anthropic S-1
Notice what Anthropic is not worried about: customers. It barely mentions them. Chamath’s takeaway is that Anthropic is emblematic of the entire AI complex. It is all about data centers, which means it is all about power. And that makes power a political issue. I think that is exactly what the market was wrestling with on Thursday.
Sacks added a striking point. The Atlanta Fed’s GDPNow estimate for third-quarter growth was about 3.7%, and AI-related capital spending is running at roughly 3% of GDP. In his view, you could say nearly all U.S. economic growth right now is coming from the AI buildout.
Chamath put it more bluntly: “The entire United States economy is levered to the AI complex. So very narrowly, we’re talking about seven or eight companies that sets the tone for the entire country. And whether we like it or not, that is where we are.” Read that again, and again.
Sources
• All-In Podcast, Episode 295 (recorded the week of October 26, 2026); charts from Social Capital, This Week in Startups, and David Friedberg as presented
• Fortune: “I am the house now” (Sept. 9, 2026)
• Moneywise via Yahoo Finance: From “I am the house” to “I can’t set the equilibrium price”
• U.S. Treasury: David Zervos named Counselor to the Secretary (Sept. 28, 2026)
• CNBC: Bessent hires Judy Shelton as adviser (Oct. 9, 2026)
• Reuters via Yahoo Finance: Nasdaq posts biggest daily drop in 19 months on fears of AI regulations
• Fortune: Current price of gold, Nov. 5, 2026
• Peter G. Peterson Foundation: Interest Costs on the National Debt
Opinions are subject to change. Not a recommendation to buy or sell any security. Provided for discussion and educational purposes only. Past performance is not indicative of future results.
Who Pays for It? AI Debt Meets the Treasury Market
Now let’s take a look at the other side of the ledger. Building this future is enormously expensive. The largest technology companies were once cash machines. They are now spending so heavily on chips and data centers that their free cash flow, the cash left over after investment, has collapsed.
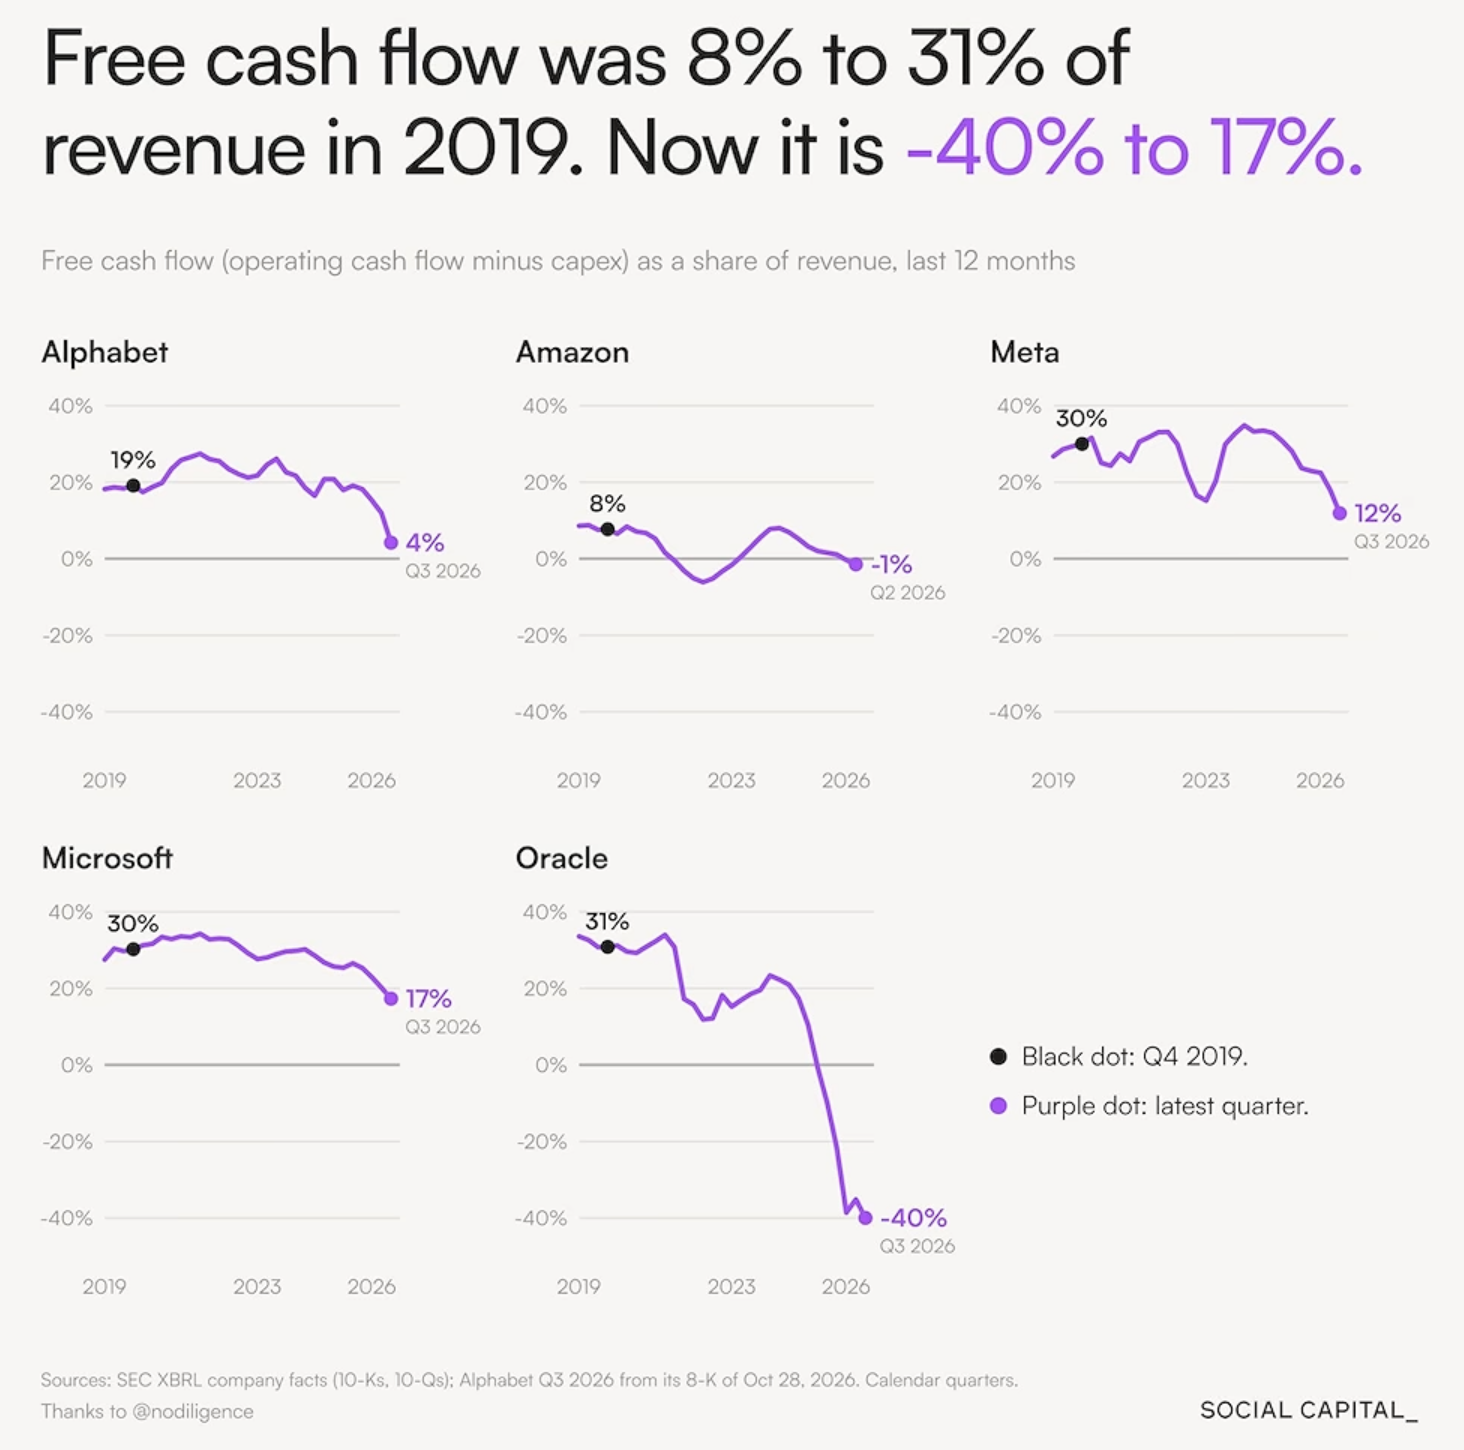
Free cash flow as a share of revenue: Alphabet 19% to 4%, Amazon 8% to -1%, Meta 30% to 12%, Microsoft 30% to 17%, Oracle 31% to -40% (Q4 2019 vs. latest quarter).
Source: Social Capital; SEC filings
When you spend more cash than you bring in, you borrow. And that’s what is happening. Chamath estimates the AI complex now owes the market $340 to $400 billion. Microsoft is the exception; Satya Nadella has cut its debt in half while others have piled it on.
Here is the problem. These companies are now competing with the U.S. government for the same pool of investor money.
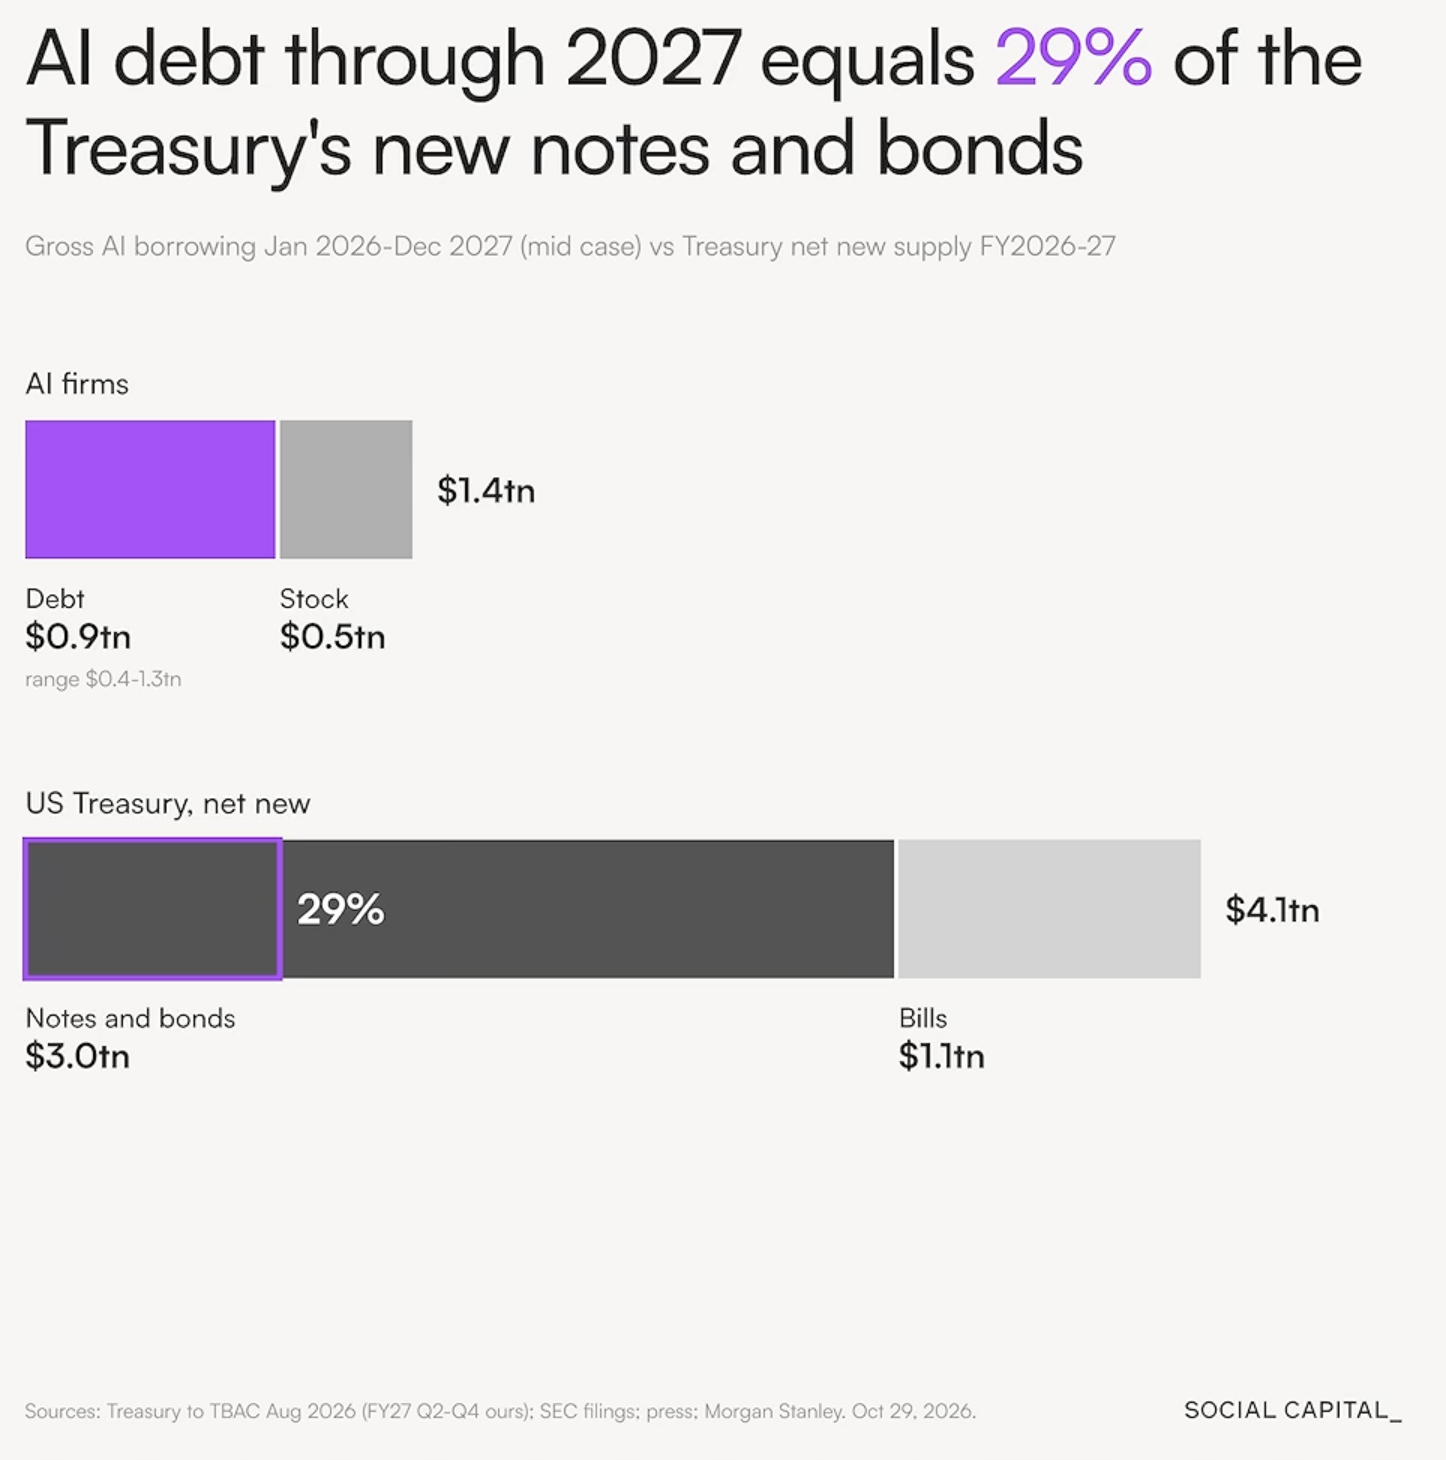
Think of the bond market as a big pool of savings. The government must dip into it constantly to pay its bills. Now seven or eight companies are lining up at the same pool, asking for an amount equal to nearly 30% of what the Treasury needs to borrow in longer-term debt over the same period. When more borrowers compete for the same dollars, the cost of borrowing rises. That price is the interest rate.
That matters for every taxpayer. Federal interest costs have already crossed $1 trillion a year, more than we spend on national defense. Higher rates on new borrowing push that number higher still. Can you see how the noose keeps getting tighter?
Friedberg took this a step further. He has never seen a handful of companies, organized around one narrow bet, effectively compete with governments for capital. His view is that governments won’t sit still for that. He expects compute capacity itself to be regulated at some point, with government deciding who gets access to how much. I hope he’s wrong. But it is worth keeping on our radar.
The three O’s and bracing for opportunity
I keep writing about the O’s: overvalued, overleveraged, and overconcentrated. It is always leverage that blows things up. (I wrote about it most recently in Margin Debt In A Late Cycle Bull Market and Pressure Points.) After Thursday’s carnage, it is still too early to expect margin calls. But it is not too early to brace for the opportunity that a forced-selling leverage unwind would present. And of course, there is the leverage in the yen carry trade, which I continue to watch closely (see The Yen Carry Trade – Part II).
I have my own buy list prepared. ANT will be added to it once it goes public. The point of the list is simple: when good businesses go on sale because leveraged investors are forced to sell, you want to know in advance what you want to own and be ready to strike.
Good As Gold
I’ve written before that I believe we are moving toward a Bretton Woods III: a restructuring of the debt and currency system. I don’t know exactly what it will look like or when it will happen. But I suspect something big is being planned, and I want to put four names on your radar: Treasury Secretary Scott Bessent, Judy Shelton, David Zervos, and Fed Chair Kevin Warsh.
“I am the house now”
On September 8, speaking at Southern Methodist University, Bessent addressed traders betting against the yen after a U.S. intervention in the currency market. “When we intervene with the Japanese yen, I have pretty good insight into what the Bank of Japan is going to do, what Japanese policymakers are going to do,” he said. “I have asymmetric information. I am the house now. You can bet against me if you want.”
Think about that for a minute. “Asymmetric information” is a polite way of saying, I know things you don’t. Then look at who he has brought into his circle. On September 28, Treasury named David Zervos, formerly Jefferies’ chief market strategist, as Counselor to the Secretary. Zervos understands the plumbing of the financial system as well as anyone I know. In October, Bessent brought on Judy Shelton as a counselor. Shelton has long advocated for gold-linked Treasury bonds. And then there is Kevin Warsh, who brings deep Fed and real-life big money investment experience to the table.
Imagine sitting across the poker table from those four. You try to read the players, the strength of their hands, and their next move. When the man running the table says, “I am the house,” I pay attention. That’s one heck of a tell.
Judy Shelton’s idea
In her 2024 book, Good as Gold: How to Unleash the Power of Sound Money, Shelton proposes a new type of U.S. Treasury security she calls Treasury Trust Bonds. Here is the idea in plain terms:
• Issue 50-year Treasury bonds backed by a promise of gold convertibility.
• At maturity, investors choose to be repaid in dollars or in a set quantity of gold.
• Use the bonds to restore confidence in the dollar without returning to a traditional gold standard.
• Compare yields on the gold-linked bonds with regular Treasuries to measure confidence in the dollar.
She originally proposed issuing them on July 4, 2026, with a maturity on July 4, 2076, America’s 300th birthday. Her proposal is for a new class of gold-convertible bonds. It is not a plan to back every outstanding Treasury with gold. But I believe it is a step towards it.
The $42 gold
Here is a number most people don’t know. The U.S. Treasury holds about 261.5 million ounces of gold, and it still carries that gold on its books at $42.22 per ounce, a price set by law in 1973. That values the hoard at about $11 billion. At Thursday’s price of roughly $4,100 per ounce, the same gold is worth about $1.08 trillion.
What if the Treasury revalued its gold and used the stronger balance sheet to support a broader dollar restructuring? What if it introduced gold-linked Treasury securities, creating an entirely new source of demand for gold? Could gold rise fivefold, to around $20,000? Tenfold? I don’t know. Those are extraordinary numbers, and they are good questions, not forecasts. For perspective, at $20,000 an ounce, U.S. gold would be worth about $5.2 trillion, still a fraction of the ~$40 trillion national debt. Ten times the number, and things are getting very real.
Two things to note: First, revaluing the gold does not, by itself, erase any debt or create spendable cash. It is an accounting change unless it is paired with something larger. Second, a gold-backed restructuring is my hypothesis. The appointments are real. The plan is my read of the tells. But if gold becomes a central part of a new monetary framework, today’s valuation models may no longer apply.
Bankruptcy or robots
My view on potential reform of government spending is that Washington cannot fix its own fiscal problems. As my dear friend and former fraternity brother told me when he decided to not pursue congressional reelection, “Blumy, the system is broken.” I believe the debt keeps growing, interest expense keeps rising, and neither party has shown the will to make the hard choices. As I see it, either we go bankrupt or we achieve exponential growth with AI and robotics. Bankruptcy or robots.
Path one is the road we are on. Debt compounds, interest costs eat up more of the federal budget, growth slows, and living standards come under pressure. Eventually the math forces a reckoning. That could mean default, debt monetization, inflation, financial repression (holding interest rates below inflation so the debt shrinks in real terms, at savers’ expense), or some mix of all four. Political instability would likely follow.
Path two is an AI and robotics productivity boom. Growth accelerates enough to make today’s debt manageable. Goods get cheaper to produce, services improve, and prosperity spreads. Rather than trying to tax or cut our way out, we grow our way out. Microsoft doing 68% more business with the same number of people is a small preview of what that may look like.
To me, this is less about left versus right and more about whether innovation can outrun the debt. I’m praying for path two. My suspicion is that we get some combination of both: a monetary restructuring to address an unsustainable debt burden, alongside an AI-driven productivity revolution that gives the economy room to grow.
I think it will take a crisis to get a Bretton Woods III legislated. Bessent’s Grand Reordering.
Here’s why. Big monetary changes have rarely come in calm times. The 1934 Gold Reserve Act emerged from the Depression. Bretton Woods itself was negotiated during a world war. Nixon closed the gold window in 1971 under pressure from a run on U.S. gold. Washington tends to act only when it has to.
So, I think it takes a crisis, but maybe not. None of this erases the massive amount of speculative leverage in the markets today and high valuations (though slightly better after Thursday’s trashing).
I do see opportunity ahead. The AI/robotics productivity outcome I’m hoping for would be massively bullish for lower interest rates, higher bond prices, exponential productivity and GDP growth, and for robotics, AI, and most businesses, you and me included. The optimist and analyst in me is getting excited. That is what I mean by “brace for opportunity.”
I continue to believe gold deserves a meaningful place in portfolios. Not simply as an inflation hedge, but as insurance against a fundamental restructuring of the global monetary system. The next several years could look very different from the last 40. The race may well be between productivity and bankruptcy, and I suspect the people sitting at the Treasury’s poker table know the stakes.
We’ll see.
Tax Mitigation - Strategies for High-Net-Worth Investors
In CMG’s newly updated white paper, Tax Mitigation Strategies for High-Net-Worth Investors, we explore how tax incentives designed to encourage investment in areas such as energy, small businesses, real estate, opportunity zones, equipment, and charitable giving can play a role in a broader wealth management strategy.
You can find the paper here.

The Yen Carry Trade and Key Data Charts
No significant changes. Risk remains high. We’ll update the charts again next week.
Opinions are subject to change. Not a recommendation to buy or sell any security. Provided for discussion and educational purposes only.
If you like what you are reading, click on the link and share it with a friend (it’s free).
CLICK HERE TO SUBSCRIBE TO ON MY RADAR
Trade Signals: November 5, 2026 Update
Market Commentary
Trade Signals is free for CMG clients and a paid subscription service for others. Selfishly, I write it for myself each week, and have for years, with the goal of staying disciplined in the markets.
Trade Signals
The Indicators Dashboard - Stocks, Investor Sentiment, Bonds, Commodities, Currencies, and Gold
Valuations and Subsequent 10-year Returns
Supporting Charts with Explanations

TRADE SIGNALS SUBSCRIPTION ACKNOWLEDGEMENT / IMPORTANT DISCLOSURES
About Trade Signals - Trade Signals is a paid subscription service that posts daily, weekly, and monthly market trends (and more). Free for CMG clients. Not a recommendation to buy or sell any security. For discussion purposes only.
The views expressed herein are solely those of Steve Blumenthal as of the date of this report and are subject to change without notice. Please note that the information provided is not recommended for buying or selling any security and is provided for discussion purposes only.
Personal Note: The State Playoffs
The regular season is over, and the Pennsylvania private school playoffs are underway. Sixteen teams earned a seed, and not every team gets that far. Game one was this afternoon.
1-0 Friars. A hard-fought win.
Eight teams remain, and the next game is Tuesday. Win and advance. It’s been so much fun watching this group of good young men. There are seven seniors on the team, and getting to know them and watching them grow over the last four years has been a real joy. There is great chemistry on this team. Despite what we see on the news, the future looks bright.
As soon as the edit team hits send, I’m off for a cold celebratory IPA with my beautiful Coach Sue. I can’t wait to talk about her halftime speech. I’m in awe of her.
Below is a short clip from last week’s game to give you a feel for the team. She has them playing a nice brand of soccer, though I did cherry-pick a great sequence of play with you. Click on the photo. The Friars are in blue.

Malvern Prep Friars - Coach Sues High School team
Wishing you a wonderful weekend.
Ever forward.
With kind regards,
Steve
CLICK HERE TO SUBSCRIBE TO ON MY RADAR - IT’S FREE
You can share this letter on X by clicking here.
You can share this letter on LinkedIn by clicking here.
Subscribe to OMR for free by clicking the photo.
Stephen B. Blumenthal
Founder and CEO
CMG Capital Management Group, Inc.
75 Valley Stream Parkway, Suite 201
Malvern, PA 19355
CMG Customer Relationship Summary (Form CRS)
Metric-Financial, LLC Customer Relationship Summary (Form CRS)

Stephen Blumenthal founded CMG Capital Management Group in 1992 and serves today as its CEO. Steve authors a free weekly e-letter entitled, “On My Radar.” Steve shares his views on macroeconomic research, valuations, portfolio construction, asset allocation and risk management. Author of Forbes Book: On My Radar, Navigating Stock Market Cycles.
Follow Steve on X @SBlumenthalCMG and LinkedIn.
IMPORTANT DISCLOSURE INFORMATION
This document is prepared by CMG Capital Management Group, Inc. (“CMG”) and is circulated for informational and educational purposes only. There is no consideration given to the specific investment needs, objectives, or tolerances of any of the recipients. Additionally, CMG’s actual investment positions may, and often will, vary from its conclusions discussed herein based on any number of factors, such as client investment restrictions, portfolio rebalancing, and transaction costs, among others. Recipients should consult their own advisors, including tax advisors, before making any investment decision. This material is for informational and educational purposes only and is not an offer to sell or the solicitation of an offer to buy the securities or other instruments mentioned. This material does not constitute a personal recommendation or take into account the particular investment objectives, financial situations, or needs of individual investors which are necessary considerations before making any investment decision. Investors should consider whether any advice or recommendation in this research is suitable for their particular circumstances and, where appropriate, seek professional advice, including legal, tax, accounting, investment, or other advice. The views expressed herein are solely those of Steve Blumenthal as of the date of this report and are subject to change without notice.
Investing involves risk.
This letter may contain forward-looking statements relating to the objectives, opportunities, and future performance of the various investment markets, indices, and investments. Forward-looking statements may be identified by the use of such words as; “believe,” anticipate,” “planned,” “potential,” and other similar terms. Examples of forward-looking statements include, but are not limited to, estimates with respect to financial condition, results of operations, and success or lack of success of any particular market, index, investment, or investment strategy. All are subject to various factors, including, but not limited to, general and local economic conditions, changing levels of competition within certain industries and markets, changes in legislation or regulation, Federal Reserve policy, and other economic, competitive, governmental, regulatory, and technological factors affecting markets, indices, investments, investment strategy and portfolio positioning that could cause actual results to differ materially from projected results. Such statements are forward-looking in nature and involve a number of known and unknown risks, uncertainties, and other factors, and accordingly, actual results may differ materially from those reflected or contemplated in such forward-looking statements. Investors are cautioned not to place undue reliance on any forward-looking statements or examples. All statements made herein speak only as of the date that they were made. Investing is inherently risky and all investing involves the potential risk of loss.
Past performance does not guarantee or indicate future results. Different types of investments involve varying degrees of risk, and there can be no assurance that the future performance of any specific investment, investment strategy, or product (including the investments and/or investment strategies recommended or undertaken by CMG), or any non-investment related content, made reference to directly or indirectly in this commentary will be profitable, equal any corresponding indicated historical performance level(s), be suitable for your portfolio or individual situation or prove successful. Due to various factors, including changing market conditions and/or applicable laws, the content may no longer be reflective of current opinions or positions. Moreover, you should not assume that any discussion or information contained in this commentary serves as the receipt of, or as a substitute for, personalized investment advice from CMG. Please remember to contact CMG, in writing, if there are any changes in your personal/financial situation or investment objectives for the purpose of reviewing/evaluating/revising our previous recommendations and/or services, or if you would like to impose, add, or to modify any reasonable restrictions to our investment advisory services. Unless, and until, you notify us, in writing, to the contrary, we shall continue to provide services as we do currently. CMG is neither a law firm, nor a certified public accounting firm, and no portion of the commentary content should be construed as legal or accounting advice.
No portion of the content should be construed as an offer or solicitation for the purchase or sale of any security. References to specific securities, investment programs or funds are for illustrative purposes only and are not intended to be, and should not be interpreted as recommendations to purchase or sell such securities.
This presentation does not discuss, directly or indirectly, the amount of the profits or losses realized or unrealized, by any CMG client from any specific funds or securities. Please note: In the event that CMG references performance results for an actual CMG portfolio, the results are reported net of advisory fees and inclusive of dividends. The performance referenced is that as determined and/or provided directly by the referenced funds and/or publishers, has not been independently verified, and does not reflect the performance of any specific CMG client. CMG clients may have experienced materially different performance based upon various factors during the corresponding time periods. See in links provided citing limitations of hypothetical back-tested information. Past performance cannot predict or guarantee future performance. Not a recommendation to buy or sell. Please talk to your advisor.
Information herein has been obtained from sources believed to be reliable, but we do not warrant its accuracy. This document is general communication and is provided for informational and/or educational purposes only. None of the content should be viewed as a suggestion that you take or refrain from taking any action nor as a recommendation for any specific investment product, strategy, or other such purposes.
In a rising interest rate environment, the value of fixed-income securities generally declines, and conversely, in a falling interest rate environment, the value of fixed-income securities generally increases. High-yield securities may be subject to heightened market, interest rate, or credit risk and should not be purchased solely because of the stated yield. Ratings are measured on a scale that ranges from AAA or Aaa (highest) to D or C (lowest). Investment-grade investments are those rated from highest down to BBB- or Baa3.
NOT FDIC INSURED. MAY LOSE VALUE. NO BANK GUARANTEE.
Certain information contained herein has been obtained from third-party sources believed to be reliable, but we cannot guarantee its accuracy or completeness.
In the event that there has been a change in an individual’s investment objective or financial situation, he/she is encouraged to consult with his/her investment professional.
Written Disclosure Statement. CMG is an SEC-registered investment adviser located in Malvern, Pennsylvania. Stephen B. Blumenthal is CMG’s founder and CEO. Please note: The above views are those of CMG and its CEO, Stephen Blumenthal, and do not reflect those of any sub-advisor that CMG may engage to manage any CMG strategy, or exclusively determines any internal strategy employed by CMG. A copy of CMG’s current written disclosure statement discussing advisory services and fees is available upon request or via CMG’s internet web site at www.cmgwealth.com/disclosures. CMG is committed to protecting your personal information. Click here to review CMG’s privacy policies.
See CMG Disclosures at the bottom of this page.
For more information about NDR, please visit at www.ndr.com.
NDR, Inc. (NDR), d.b.a. Ned Davis Research Group (NDRG), any NDRG affiliates or employees, or any third-party data provider, shall not have any liability for any loss sustained by anyone who has relied on the information contained in any NDRG publication. The data and analysis contained herein are provided "as is." NDRG disclaims any and all express or implied warranties, including, but not limited to, any warranties of merchantability, suitability or fitness for a particular purpose or use. NDRG's past recommendations and model results are not a guarantee of future results. This communication reflects our analysts' opinions as of the date of this communication and will not necessarily be updated as views or information change. All opinions expressed herein are subject to change without notice. NDRG or its affiliated companies or their respective shareholders, directors, officers and/or employees, may have long or short positions in the securities discussed herein and may purchase or sell such securities without notice. For NDRG's important additional disclaimers, refer to www.ndr.com/invest/public/copyright.html. Further distribution prohibited without prior permission. Copyright 2025 © NDR, Inc. All rights reserved.
The opinions are mine. Please know that there are no guarantees the above will prove correct, and that views are subject to change. See essential disclosures further below.