July 24, 2026
By Steve Blumenthal
“You can avoid reality, but you cannot avoid the consequences of ignoring reality.”
- Ayn Rand
For years, the yen carry trade has quietly done its job: borrow cheap in Tokyo, invest for more everywhere else, and don't ask too many questions about what happens if it ever reverses. It reversed once already in August 2024, and briefly took the stock market down with it. I think we're closer to a second act than most investors realize.
Today's OMR walks through what the yen carry trade actually is, in plain English, how it connects to margin debt and the price of oil, and the specific signals I'm watching for the moment it turns. I'll also cover the new round of tariffs that quietly took effect overnight, dressed up as something else entirely.
Grab your coffee and find your favorite chair. And save a few minutes for the personal note — there's real, credible news on age reversal, and it's worth the read.
Here's what's on my radar this week.
On My Radar:
Personal Note: David Friedberg On Age Reversal
OMR is for informational and educational purposes only. No consideration is given to your specific investment needs, objectives, or tolerances.
Please see the Important Disclosures at the bottom of this page. Reminder: This is not a recommendation to buy or sell any security. My views may change at any time. The information is for discussion and educational purposes only.
If you like what you are reading, you can subscribe for free.

The Yen Carry Trade, Margin Debt, Oil and Inflation
Monday, August 5, 2024. Tokyo’s Nikkei 225 fell 12.4% in a single session, its worst day since Black Monday in 1987. The S&P 500 dropped 3% by the close. The VIX spiked above 65. Traders spent the morning trying to figure out what had happened. Source: CNBC
The answer, it turned out, was the yen.
The Bank of Japan had raised interest rates a quarter point, a small move by any normal standard. But it was enough to spook a trade that had quietly grown into one of the largest sources of leverage in the global financial system: the yen carry trade. Within days, hedge funds and institutions worldwide were forced to unwind billions of dollars of borrowed yen, and every asset that money had funded, US tech stocks included, got sold to help pay for it.
I bring this up because we are, in some ways, watching the sequel. Different actors, same script, and this week the yen is back at the center of my radar.
What Is the Yen Carry Trade? (In Plain English)
Here is the simplest way I can explain it.
Japan has kept interest rates near zero for the better part of three decades. If you’re a hedge fund, a bank, or frankly anyone with access to capital markets, you can borrow yen for next to nothing, convert those yen into dollars, and invest the proceeds in higher-yielding US assets: Treasury bonds, corporate credit, even stocks. You pocket the difference between what you pay to borrow and what you earn on the investment. Wall Street calls that difference the “carry.” In a low-volatility world, it is close to free money.
The trade works beautifully as long as two things hold: the interest rate gap between Japan and the US stays wide, and the yen doesn’t strengthen unexpectedly. If it does, the dollars you eventually convert back into yen buy you fewer yen than you borrowed, and the trade loses money fast.
Nobody knows exactly how large the yen carry trade is, because so much of it happens off balance sheet, through derivatives and repo markets. Estimates run into the trillions of dollars. What we do know is that when it unwinds, it unwinds fast, because everyone is trying to close the same trade through the same narrow door at the same time. That is what happened in August 2024. It is also exactly what Felix Zulauf flagged as the thing to watch this cycle, in a conversation with Jeffrey Gundlach that I summarized a few weeks ago (see: On My Radar: Zulauf – Gundlach, June 26, 2026). Zulauf’s point was that Japan’s debt problem itself is manageable, since most of it is owned domestically. The bigger risk is whether Japanese investors decide to bring their money home. “That could have major consequences globally,” he said.
Where We Stand Today
The yen closed this week near ¥163.8 to the dollar, its weakest level since December 1986. Before this year, you would have to go back nearly 40 years to find the yen this cheap against the dollar.
A few forces are pulling in opposite directions:
The Bank of Japan hiked its policy rate to 1% on June 16, the highest level since 1995, and Governor Ueda has signaled at least one more quarter-point hike by September. Japan is trying to defend its currency by making it more attractive to hold.
Japan’s Ministry of Finance has already spent an estimated $72.5 billion on direct currency intervention this year, buying yen and selling dollars. As of early July, Finance Minister Katayama has refused to name a specific defense level, saying only that Tokyo will act “at any moment,” even on US holidays. The silence, by design, is the strategy.
The US-Japan interest rate gap has narrowed to roughly 300 basis points, down from over 500 at the 2024 peak, but it remains wide enough to keep the carry trade attractive. Kevin Warsh’s hawkish debut as Fed Chair (see: On My Radar: Bravo Kevin Warsh, June 19, 2026) has, if anything, kept US rates higher for longer, which keeps the pressure on the yen.
That last point is worth being with. A tougher Fed is good news for the inflation fight at home. It is not obviously good news for Japan, as a higher Treasury yield can further weaken the yen, causing more inflation. As I explain further below, importing 95% of your energy needs (oil) with a devalued currency is a major economic problem.
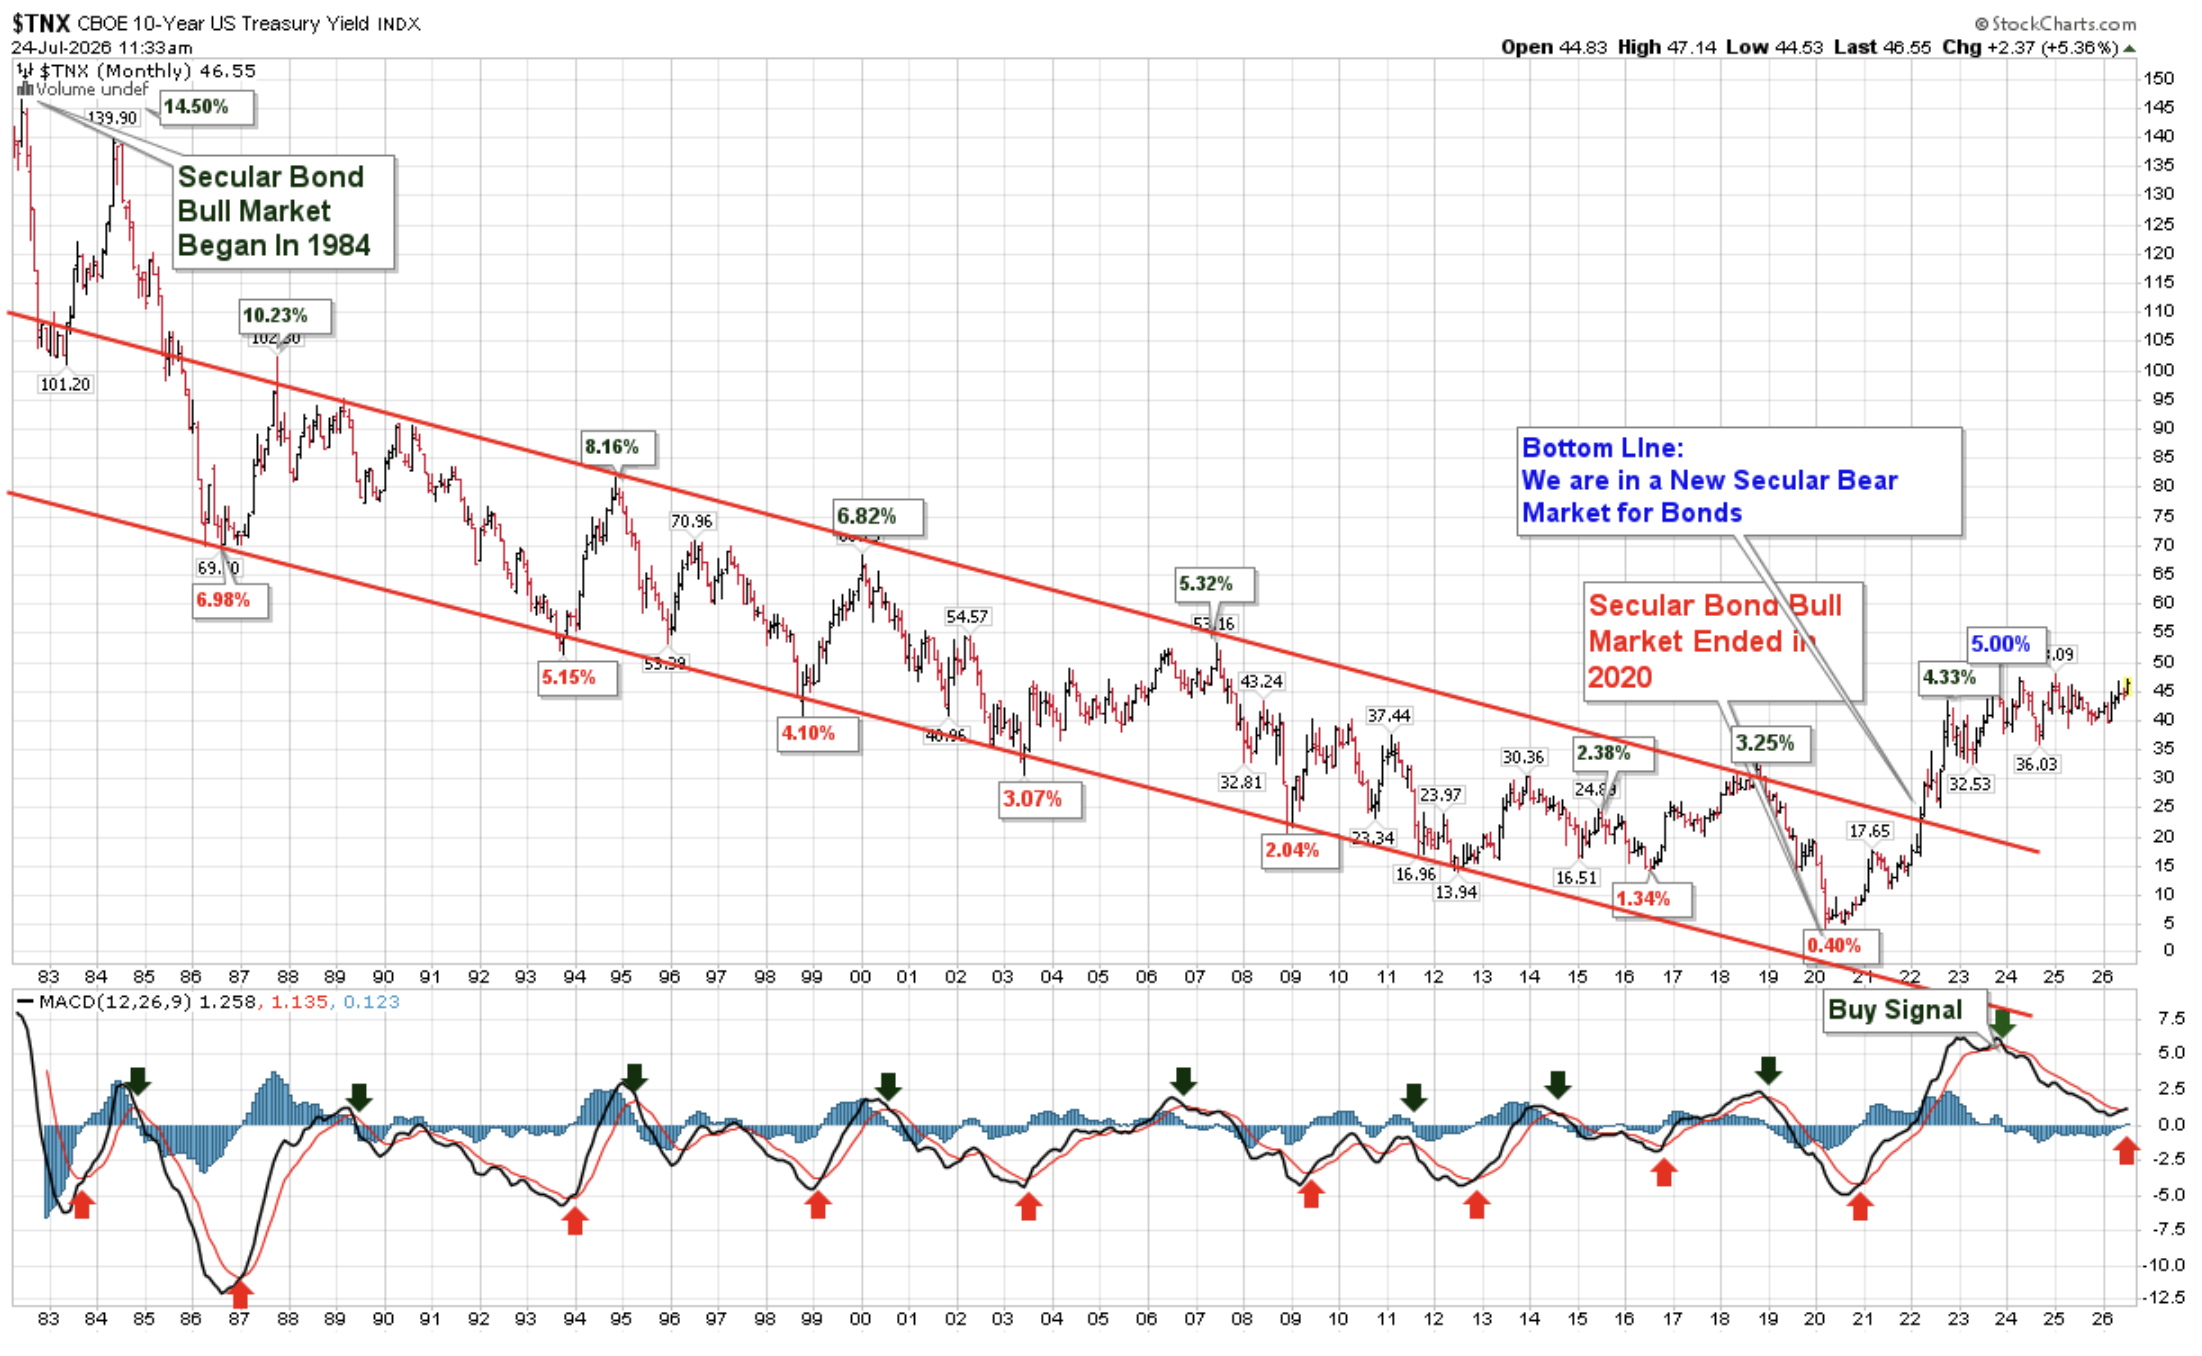
I’d also point you back to something I flagged in May (see: On My Radar: U.S. vs. China – Energy, Control, and the Global Order, May 15, 2026): Japan’s 10-year government bond yield had hit a 29-year high alongside a broader global bond bear market, with UK gilts at an 18-year high, German bunds at a 15-year high, and the US 10-year pressing 4.50%. The US 10-year yield has kept climbing and is at 4.66% at the time of this post. The JGB 10-year touched levels not seen since 1996 in early July, and the 20-year JGB hit a multi-decade high above 3.9%. This is not a US-only story. It is a developed-world government debt story, and Japan, the world’s most indebted major economy, sits at the center of it. Sources: Trading Economics, Yahoo Finance, Investing.com
The 10-Year Treasury Yield - Long-term Trend Chart
Note the red arrow bottom right in the chart.
The trend for the 10-year Treasury yield is up.
Source: StockCharts.com, CMG Investment Research annotations
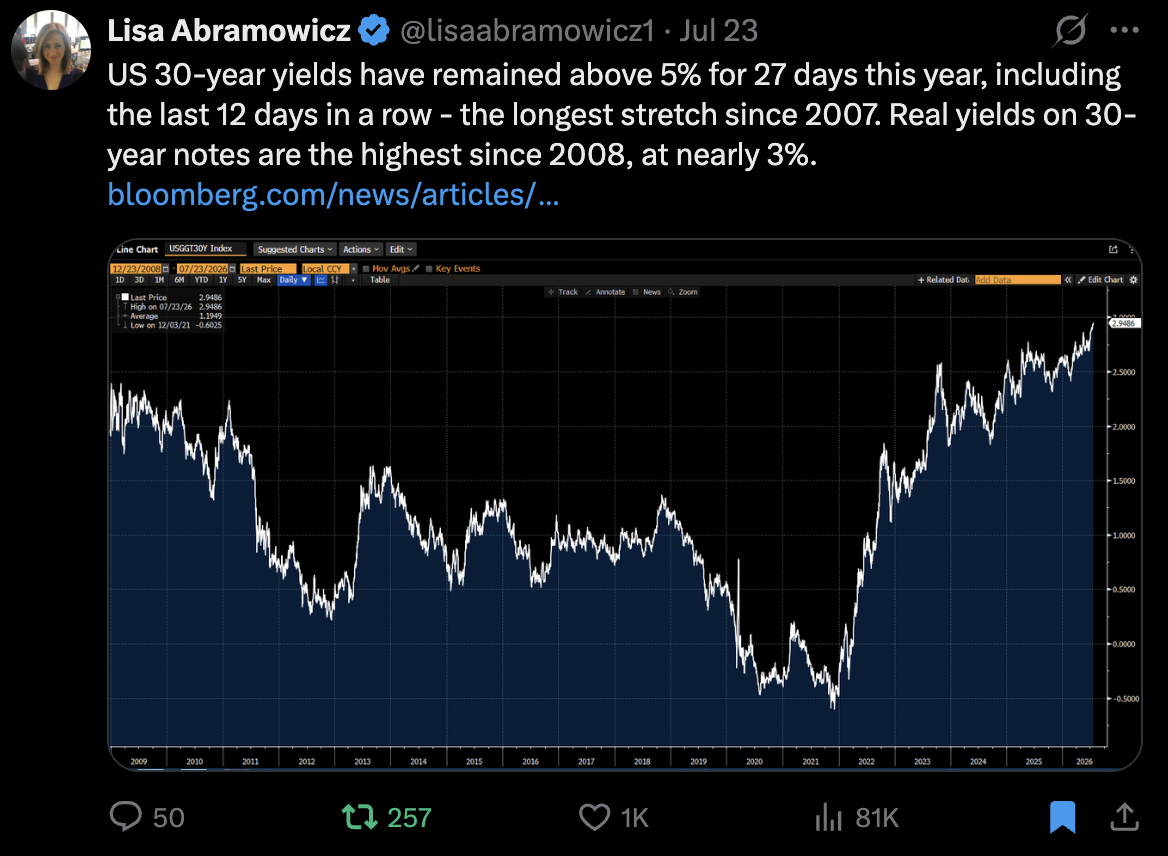
A Look at the 30-Year Treasury Yield
Source: Bloomberg
Bessent, Warsh, and Dalio Are All Watching the Same Thing
A few comments from important voices.
Treasury Secretary Scott Bessent has an almost poetic relationship with the yen. Years ago, working for George Soros, he reportedly made over $1 billion shorting it. Today, as Treasury Secretary, he is on the other side of the trade entirely, spending time in Tokyo meeting with Japan’s prime minister, central bank governor, and finance minister, working to slow the currency’s slide. In June, following a call with Finance Minister Katayama, the two sides said they were “increasingly aligned” on currency policy and prepared to take “bold” steps if needed. It is a good reminder that the same person can see a market from both sides of the table, and that today’s defender was yesterday’s attacker.
Kevin Warsh, meanwhile, is fighting a related battle. His hawkish tone at his debut Fed meeting is the kind of move that, historically, has triggered Japanese intervention, because a more hawkish Fed widens the very rate gap that makes the yen carry trade so attractive in the first place. Forbes columnist William Pesek summed it up in a headline I can’t improve on: “Kevin Warsh’s 2026 Starts Looking Very Japanese.” Warsh is fighting US inflation and, indirectly, making Japan’s currency problem harder to solve.
And Ray Dalio, who has spent years studying what he calls the long-term debt cycle, treats Japan as close to a textbook case. Since 2013, he has noted, holders of Japanese government bonds have lost roughly 60% of their value versus gold. Not because Japan defaulted; it never had to. The debt was simply devalued gradually, through a weaker currency and financial repression, rather than suddenly, through default. Dalio’s broader warning, that in a more fractured geopolitical world countries increasingly prefer hard assets like gold to holding one another’s currency or debt, is exactly the dynamic playing out in Japan right now. And, while a few years behind, the U.S. is driving down the same road.
Oil Makes It Worse
Here is the piece that ties currencies directly to your wallet. Japan imports nearly all of its oil, and that oil is priced in dollars.
When the yen weakens, Japan needs more yen to buy the same barrel of oil. It is a double hit. Global oil prices are rising in dollar terms because of the still-unsettled situation around the Strait of Hormuz (Brent traded above $100 a barrel this week for the first time in two months, up more than 13% on the week). On top of that, every barrel costs more in yen simply because the yen itself is worth less. That combination, a weak currency stacked on top of rising dollar-denominated energy prices, is one of the more underappreciated channels through which currency weakness becomes imported inflation. It is happening in Japan today. It is a smaller version of the same math that applies to any oil-importing country whose currency is falling against the dollar, and it is worth remembering the next time someone tells you oil prices don’t matter to inflation because “we produce our own.”
The ‘Not Tariffs’ Tariffs
“I understand the desire to reshore key activities like producing rare earths, pharma ingredients, etc… and the goal of making more things in the US but I just don’t get this obsession with blanket tariffs, especially as US importers and consumers are eating most of it, inflation both for consumers and business is already a major economic pain point and it’s on many things we will never make here. I’ll stop there.”
— Peter Boockvar, Boock Report July 24, 2026
You can feel Peter’s frustration. Seems to me to be an accurate description. So what happened? Yesterday, the Trump administration announced a new round of tariffs covering 60 trading partners and approximately 99.4% of all U.S. imports. They take effect today, July 24.
Here is what changed:
A 10% tariff will apply to imports from countries that have adopted, or committed to adopt, prohibitions against goods produced with forced labor.
A 12.5% tariff will apply to countries that have not made those commitments.
The 10% group includes Canada, Mexico, the United Kingdom, India, Indonesia, Malaysia, Argentina, Pakistan and several others.
China and many other trading partners fall into the 12.5% group.
Oil, natural gas, fertilizer, certain food products, raw materials, medicines and goods already subject to Section 232 tariffs are among the exemptions.
Why the unusual justification?
The Supreme Court struck down Trump’s earlier “Liberation Day” tariffs imposed under emergency-powers law. The administration temporarily replaced them with a 10% global import surcharge under Section 122, but that authority expired today.
The administration has now rebuilt essentially the same tariff wall under Section 301 of the Trade Act of 1974. Instead of saying the tariffs are needed to correct trade deficits, the stated purpose is to punish countries that fail to prohibit imports made with forced labor.
That is the “not tariffs, tariffs” part:
They are presented as a human-rights enforcement action, but economically they operate as broad-based tariffs designed to preserve the administration’s tariff revenue and trade leverage. I wonder how many late nights the lawyers spent coming up with this plan?
The important takeaway is that this is largely a replacement, not an entirely new 10%–12.5% cost layered on top of yesterday’s 10% global tariff. For many imports, the baseline moves from 10% to either 10% or 12.5%. The immediate incremental increase may therefore be modest, although the legal mechanism, country classifications, and product exemptions have changed.
Higher-for-longer inflation pressures remain. Add this into the global macro mixing pot.
What This Has to Do With Margin Debt
You may be wondering what any of this has to do with US margin debt, a topic several of you have asked me about. Here is the connection.
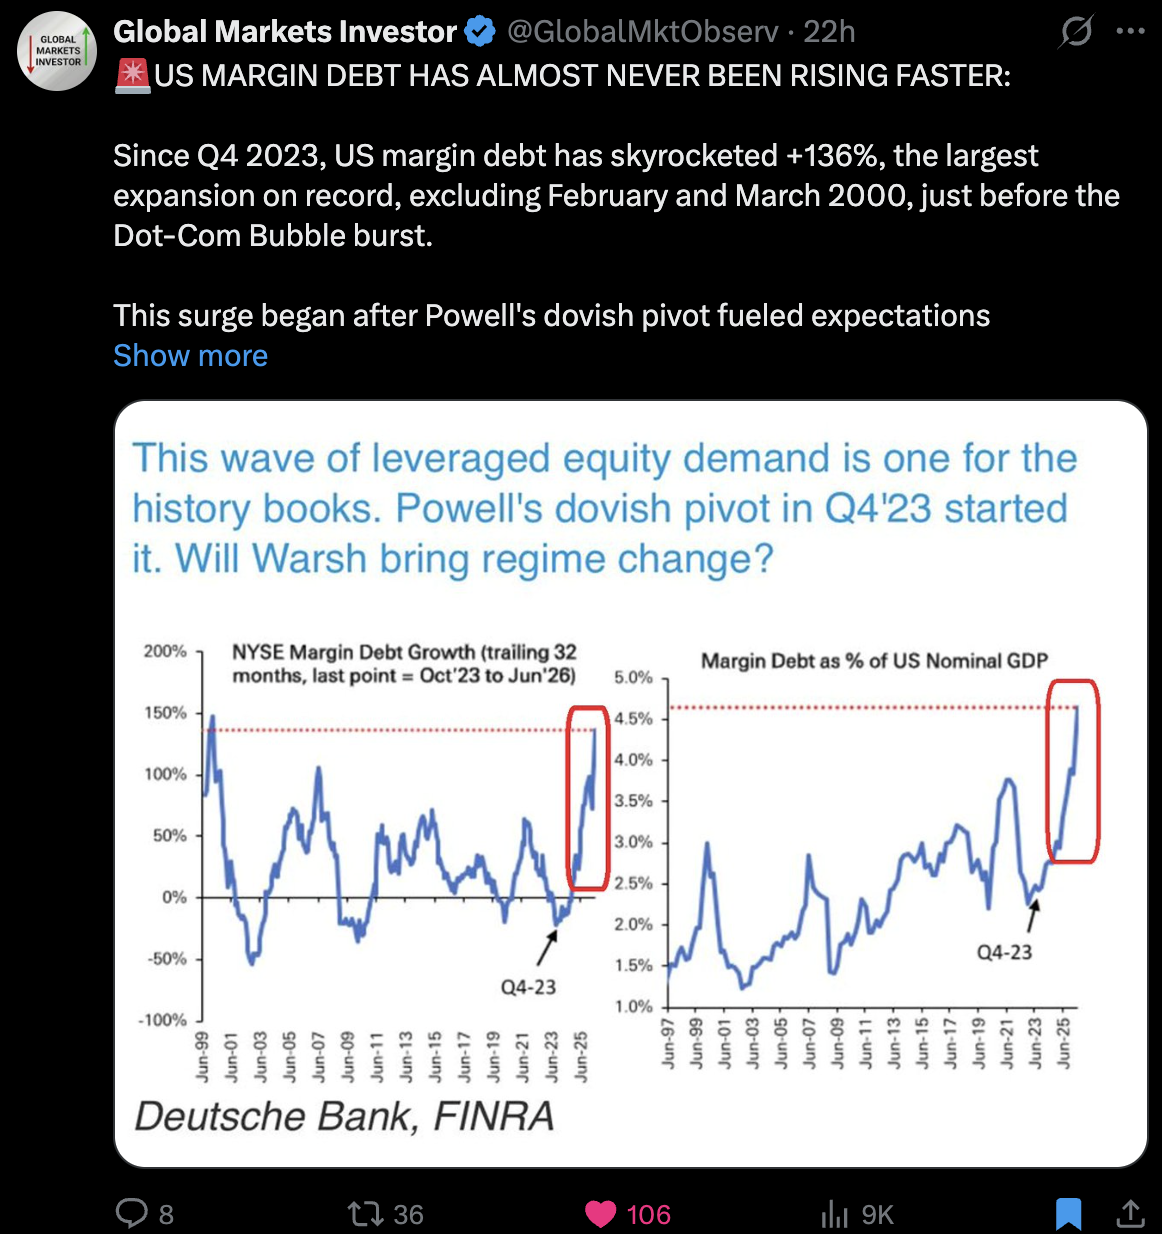
The yen carry trade is, in effect, a hidden source of global liquidity. Cheap borrowed yen doesn’t just fund Japanese investment abroad; it helps grease the wheels for leverage everywhere, including here at home. US margin debt just hit a record $1.42 trillion, up $495 billion, or 54%, over the past twelve months (see: On My Radar: Bravo Kevin Warsh, June 19, 2026). Measured against M2 money supply, a cleaner read on how leveraged the system really is, margin debt is back near the peaks that preceded the 2000 and 2007 market tops. As Lance Roberts put it in a chart I shared a few weeks back, “Borrowed money cuts both ways. It is an accelerant, not a cushion.” Here’s a similar look:
Source: @GlobalMktObserv, Deutsche Bank, FINRA
That is the connective tissue running through everything I have written about this year: an overvalued, overconcentrated, overleveraged S&P 500 (see: On My Radar: Cycles, Concentration, and Consequences, May 22, 2026), a 10-year Treasury yield I have called the match that lights the fuse (see: On My Radar: The Match, the Fuse, and 4.50%, July 17, 2026), and now a yen carry trade that has quietly become one of the largest, least visible forms of leverage in the system. These are not separate stories. They are the same story, told from three different rooms in the same house.
When leverage unwinds, whether it is margin debt, private credit, or a carry trade, it rarely announces itself in advance. August 2024 didn’t send a save-the-date card. It just happened, all at once, on a Monday morning.
Potential Signals: What to Watch
Measuring the yen carry trade directly is nearly impossible. So much of it lives off balance sheet, in derivatives, repo, and interbank lending, that no single number captures its true size. What we can do instead is watch the markets that carry trade liquidity tends to touch first, and look for cracks.
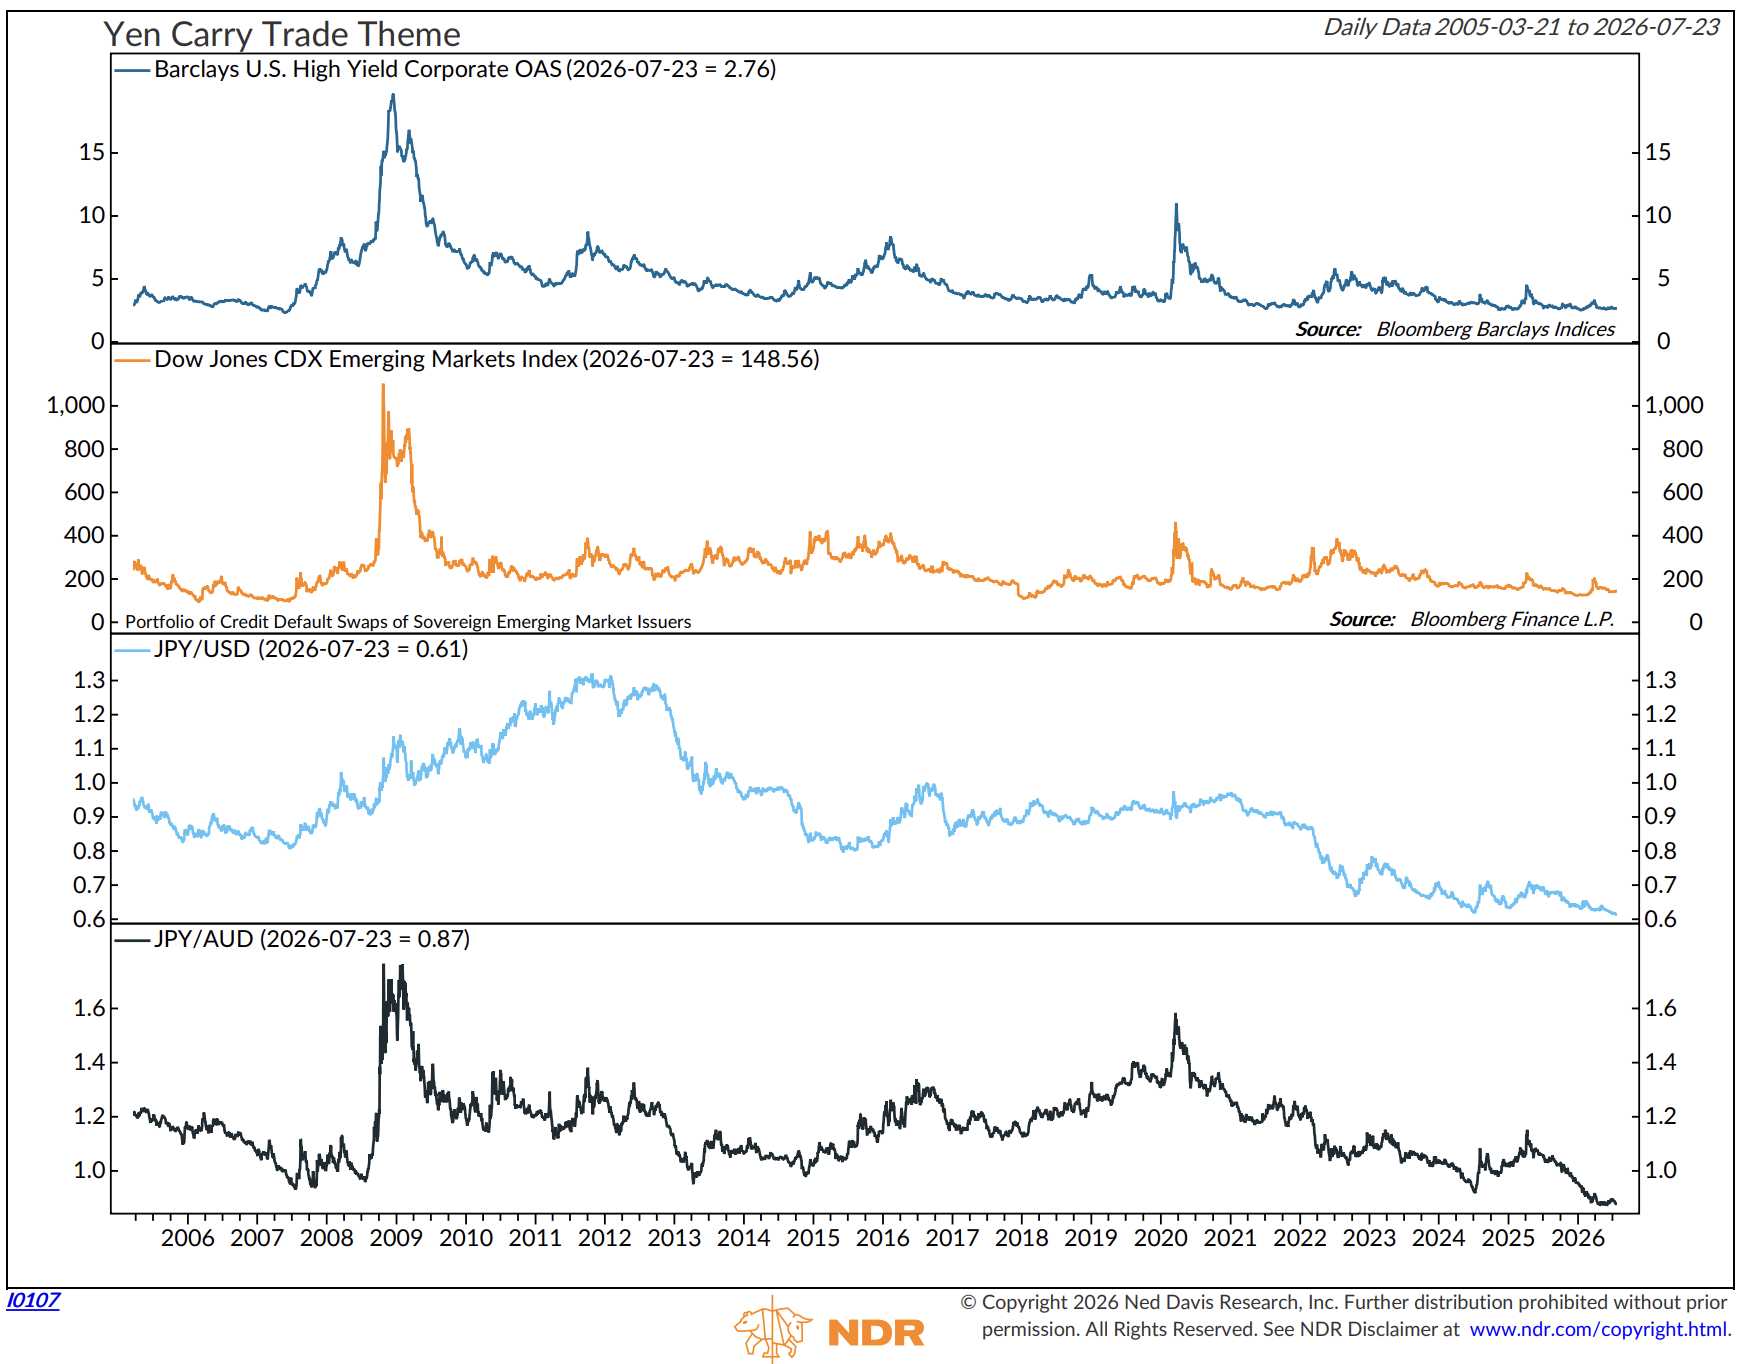
Ned Davis Research tracks exactly this in a chart worth studying closely (see below). It layers together market-derived signals that have historically moved together whenever the carry trade has come under stress:
High-yield credit spreads (Barclays U.S. High Yield Corporate OAS). This measures the extra yield investors demand to hold risky corporate debt over Treasurys. A tight, low spread means investors are comfortable taking on risk; a widening spread means the opposite: capital is pulling back and lenders want to be paid more for the risk they're taking. As of July 23, the spread sat at 2.76%, near the low end of its 20-year range. For context, it spiked above 18% in the 2008 financial crisis and above 10% in 2020. A sustained move higher is usually one of the first tells that global liquidity is draining.
Emerging market credit default swaps (Dow Jones CDX Emerging Markets Diversified Index). This measures the cost of insuring against default on emerging market sovereign and corporate debt. Carry trade capital has long found a home in higher-yielding, riskier EM bonds, so this index is sensitive to the same liquidity swings. It closed at 148.56 on July 23, well below the roughly 1,000 level it hit in 2008 and the 400-plus readings during the 2011 European debt scare, the 2015-16 China and commodity slide, and the 2020 COVID shock. A sharp rise here, especially alongside #1, is a warning sign.
The yen exchange rate itself. This is the most direct signal. When the carry trade is alive and well, the yen tends to stay weak, or get weaker, as capital keeps flowing out of Japan chasing higher yields elsewhere. When the trade unwinds, the yen snaps back fast, exactly as it did in August 2024, when it appreciated roughly 6% against the dollar in about a week. NDR's chart also tracks the yen against the Australian dollar (JPY/AUD), another classic carry-funding pair, since Australia's higher-yielding bonds have long been a popular destination for cheap yen. Both pairs are sitting near multi-decade lows right now, which tells you the carry trade is still very much intact. A sharp, sustained yen rally against either currency would be the signal that it's coming undone.
Source: NDR
What Today's Readings Are Telling Us
Here is the uncomfortable part. As of this week, all three signals sit near the calm end of their historical range: credit spreads are tight, emerging market CDX is low, and the yen is cheap against both the dollar and the Australian dollar. In other words, the market is priced for the carry trade to keep working smoothly.
That is not necessarily bearish news on its own. But it's worth remembering that every prior unwind- 2008, 2011, 2015-16, 2020, and August 2024- showed up first as calm, then as a rapid, simultaneous move across these signals within days, not months. Zulauf's warning about Japanese investors repatriating capital, and the Bessent-Warsh balancing act between fighting US inflation and keeping the yen from cracking further, are exactly the kinds of pressures that could flip this chart quickly.
My takeaway: don't watch the yen in isolation. Watch it alongside high-yield spreads and emerging market CDX. When all three start moving together, and especially when the yen starts strengthening quickly, that's the tell that the carry trade many investors are quietly relying on for liquidity is starting to come apart.
Bottom Line
I am not predicting a repeat of August 2024 on any particular date. I don’t know if the yen is the trigger this time, or the 10-year Treasury, or something else entirely. What I do know is that the yen, Japan’s bond market, and the leverage building in US markets are all connected, and all worth watching together rather than in isolation. Keep an eye on ¥163–165 and on any sign that the Bank of Japan is finally getting serious about defending its currency. When Japanese money starts coming home in size, it will matter for markets everywhere.
Opinions are subject to change. Not a recommendation to buy or sell any security. Please note that the information provided is not recommended for buying or selling any security and is provided for discussion purposes only.
Key Charts to Watch
“The last Japanese yen defense bought them days, not a bottom. USD/JPY just tagged 163.99, one print from the 164 line that previously forced Tokyo’s hand. They already burned a record ¥11.7T ($73B) earlier this year. The pair got smashed, then marched straight back to fresh 40-year highs within days. $1.09T in reserves still sits on the books. Looks comfortable until you realize the next round has to be materially larger just to leave a mark that lasts longer than a long weekend. Carry desks max-long USDJPY into the most obvious intervention zone in years are the ones exposed. They have been paid handsomely to fade every verbal warning. Actual MoF orders will reprice that assumption in one violent session. History does not repeat, but the fade after the last intervention is the only template that matters right now.”
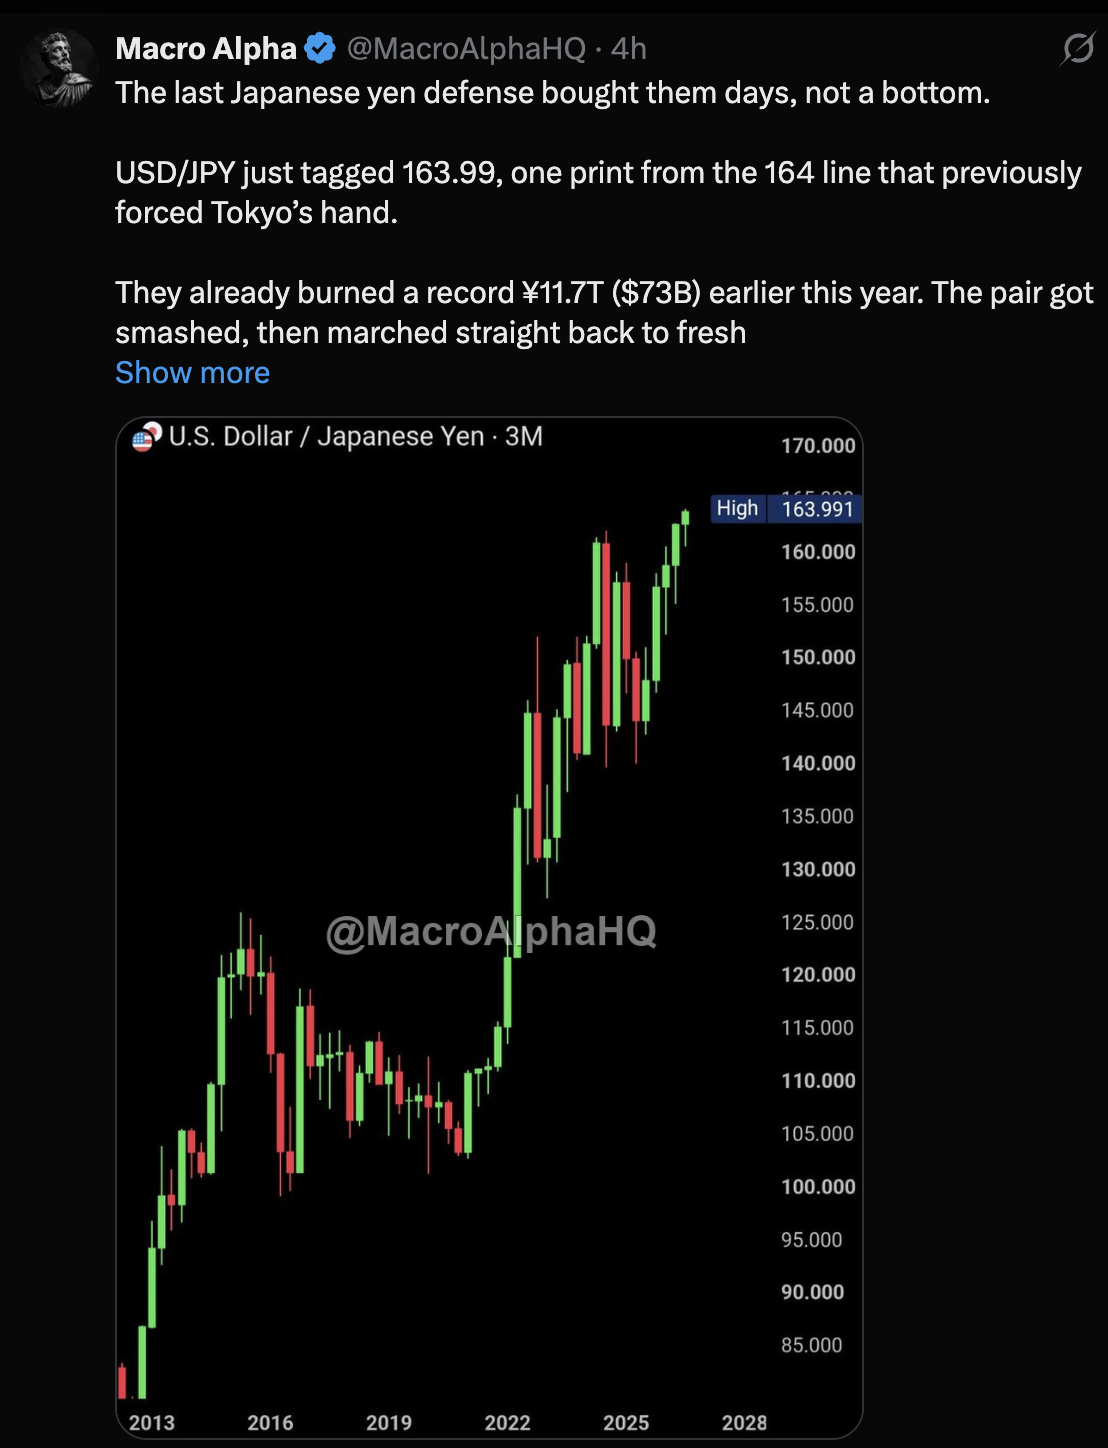
Source: @MacroAlphaHQ
You’ll find several more excellent charts on leverage in last week’s OMR. Here is the direct link to the chart section.
High Yield Junk Bonds
I like to call the high-yield bond market the Canary in the Coal Mine. It is an early warning signal for risk assets.
The first of the two HY charts that follow looks at the price of a large and popular high-yield bond fund. The bottom section plots the Monthly MACD. It is a moving-average signal that compares a shorter-term moving-average price line with a longer-term moving-average price line. Signals occur when the lines cross, indicating a trend direction.
Red arrows are downtrend signals; green are uptrend signals.
Red alert! The monthly MACD does not signal frequently - it is now in a downtrend signal.
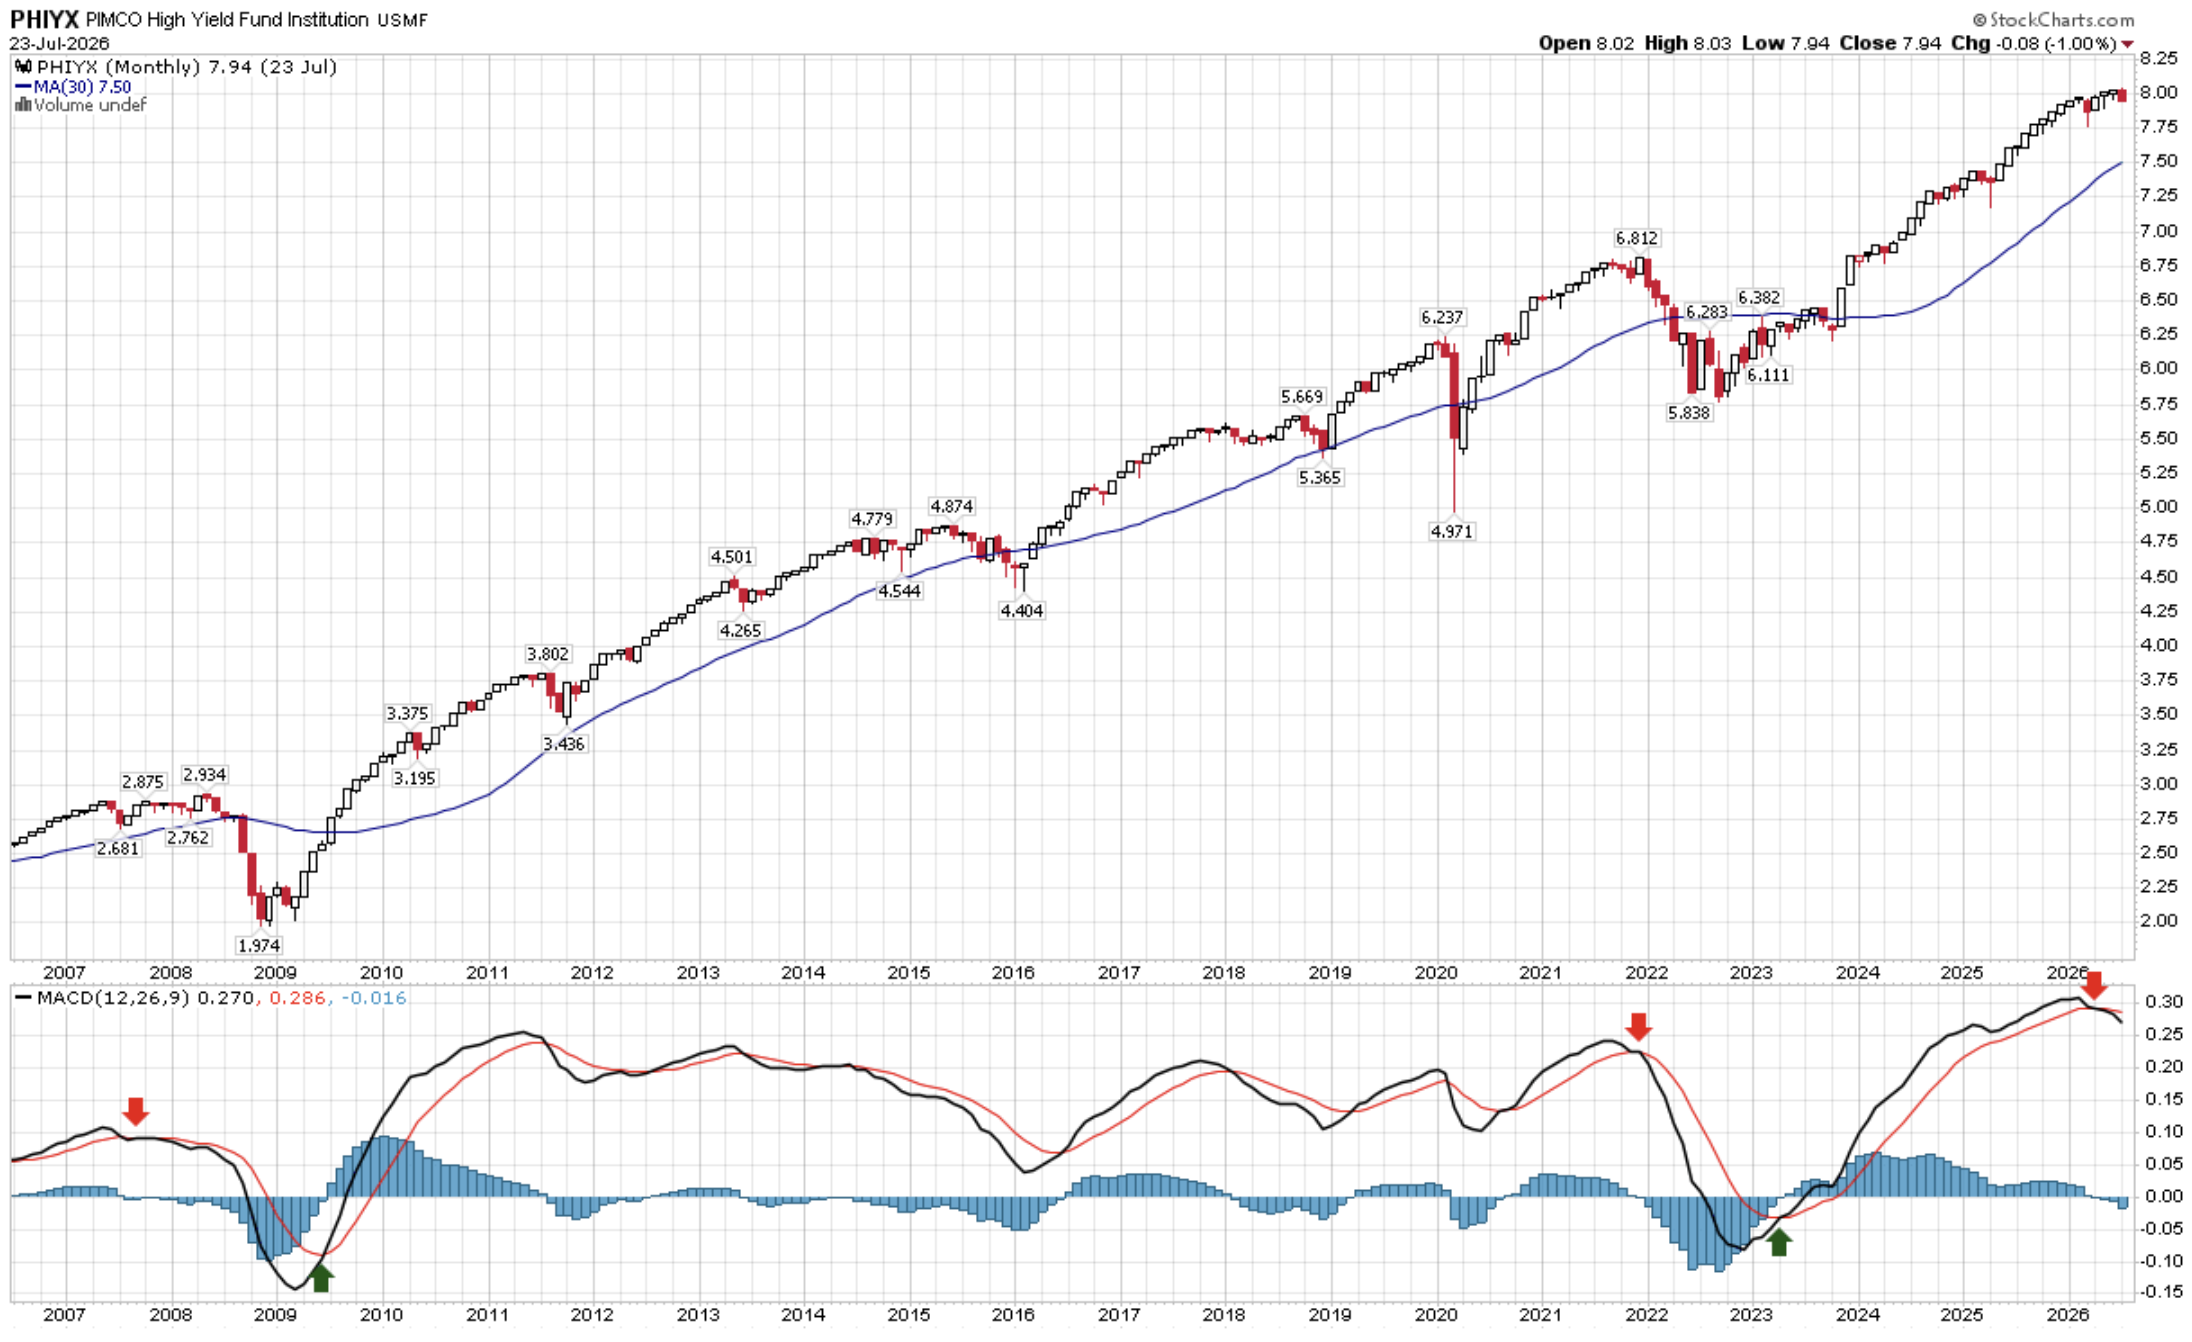
Source: Stockcharts.com, CMG Investment Research
This next chart looks at the daily price activity of the same high-yield bond mutual fund. The lower section plots the daily MACD trend signals. Also in a price downtrend.
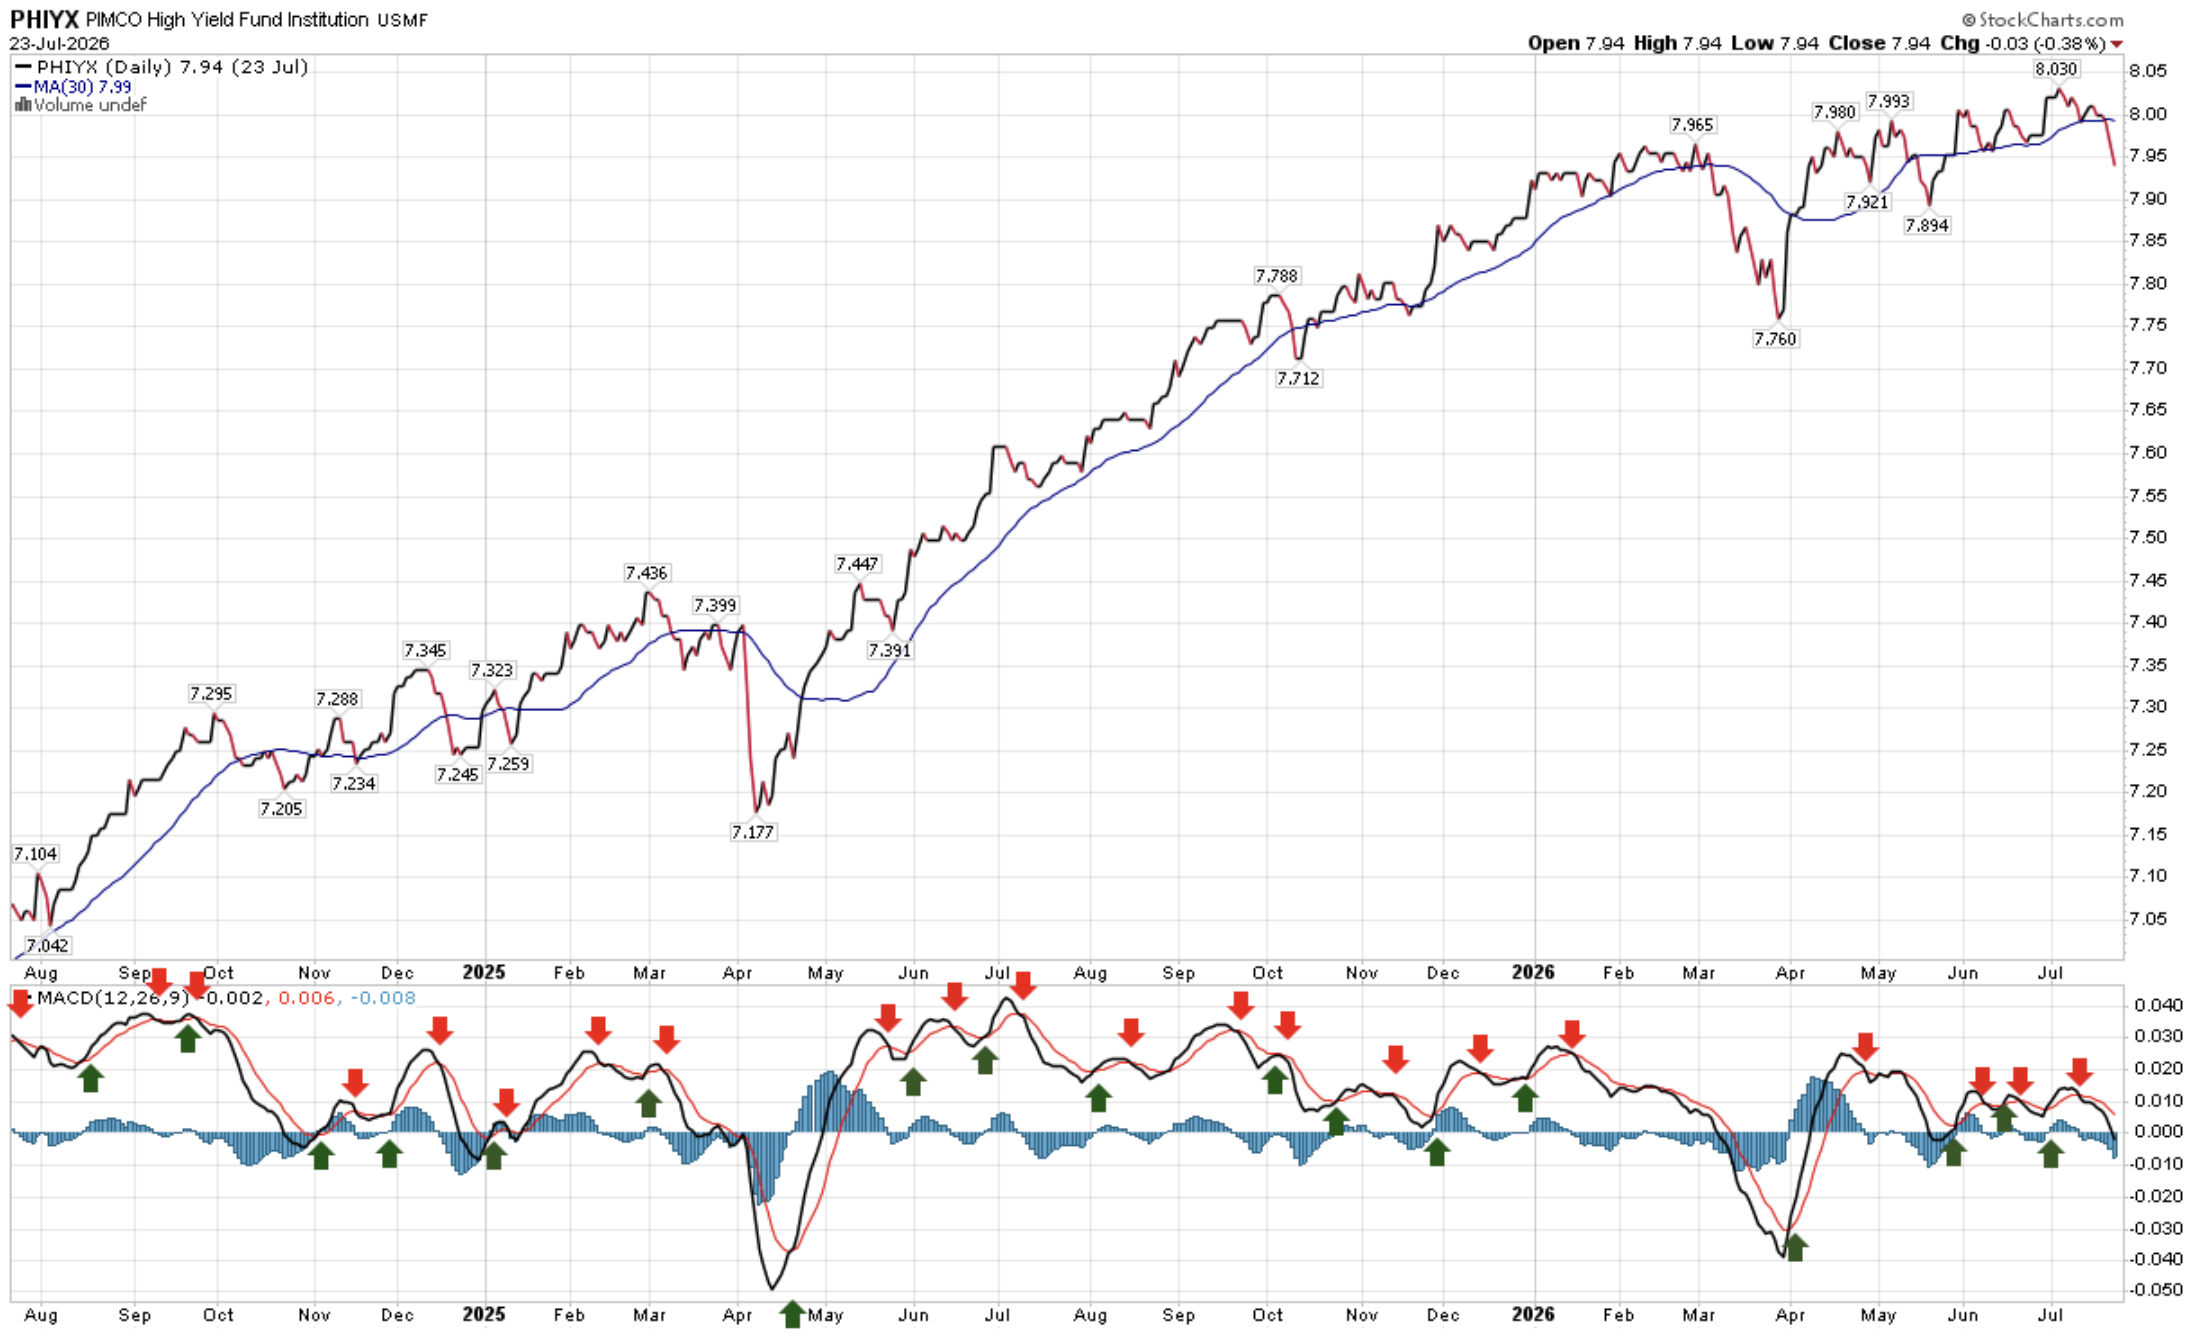
Source: Stockcharts.com, CMG Investment Research
Here is another chart I keep my eye on. It’s been bullish for months and is now in a neutral signal. Same idea as above: measuring current price vs. a moving average. When both the price of the S&P 600 index (small cap stocks) and the number of stocks in the S&P 600 index advancing in price vs declining in price fall below a smoothed moving average price line, it is historically bearish for risk assets. The current signal is mixed.
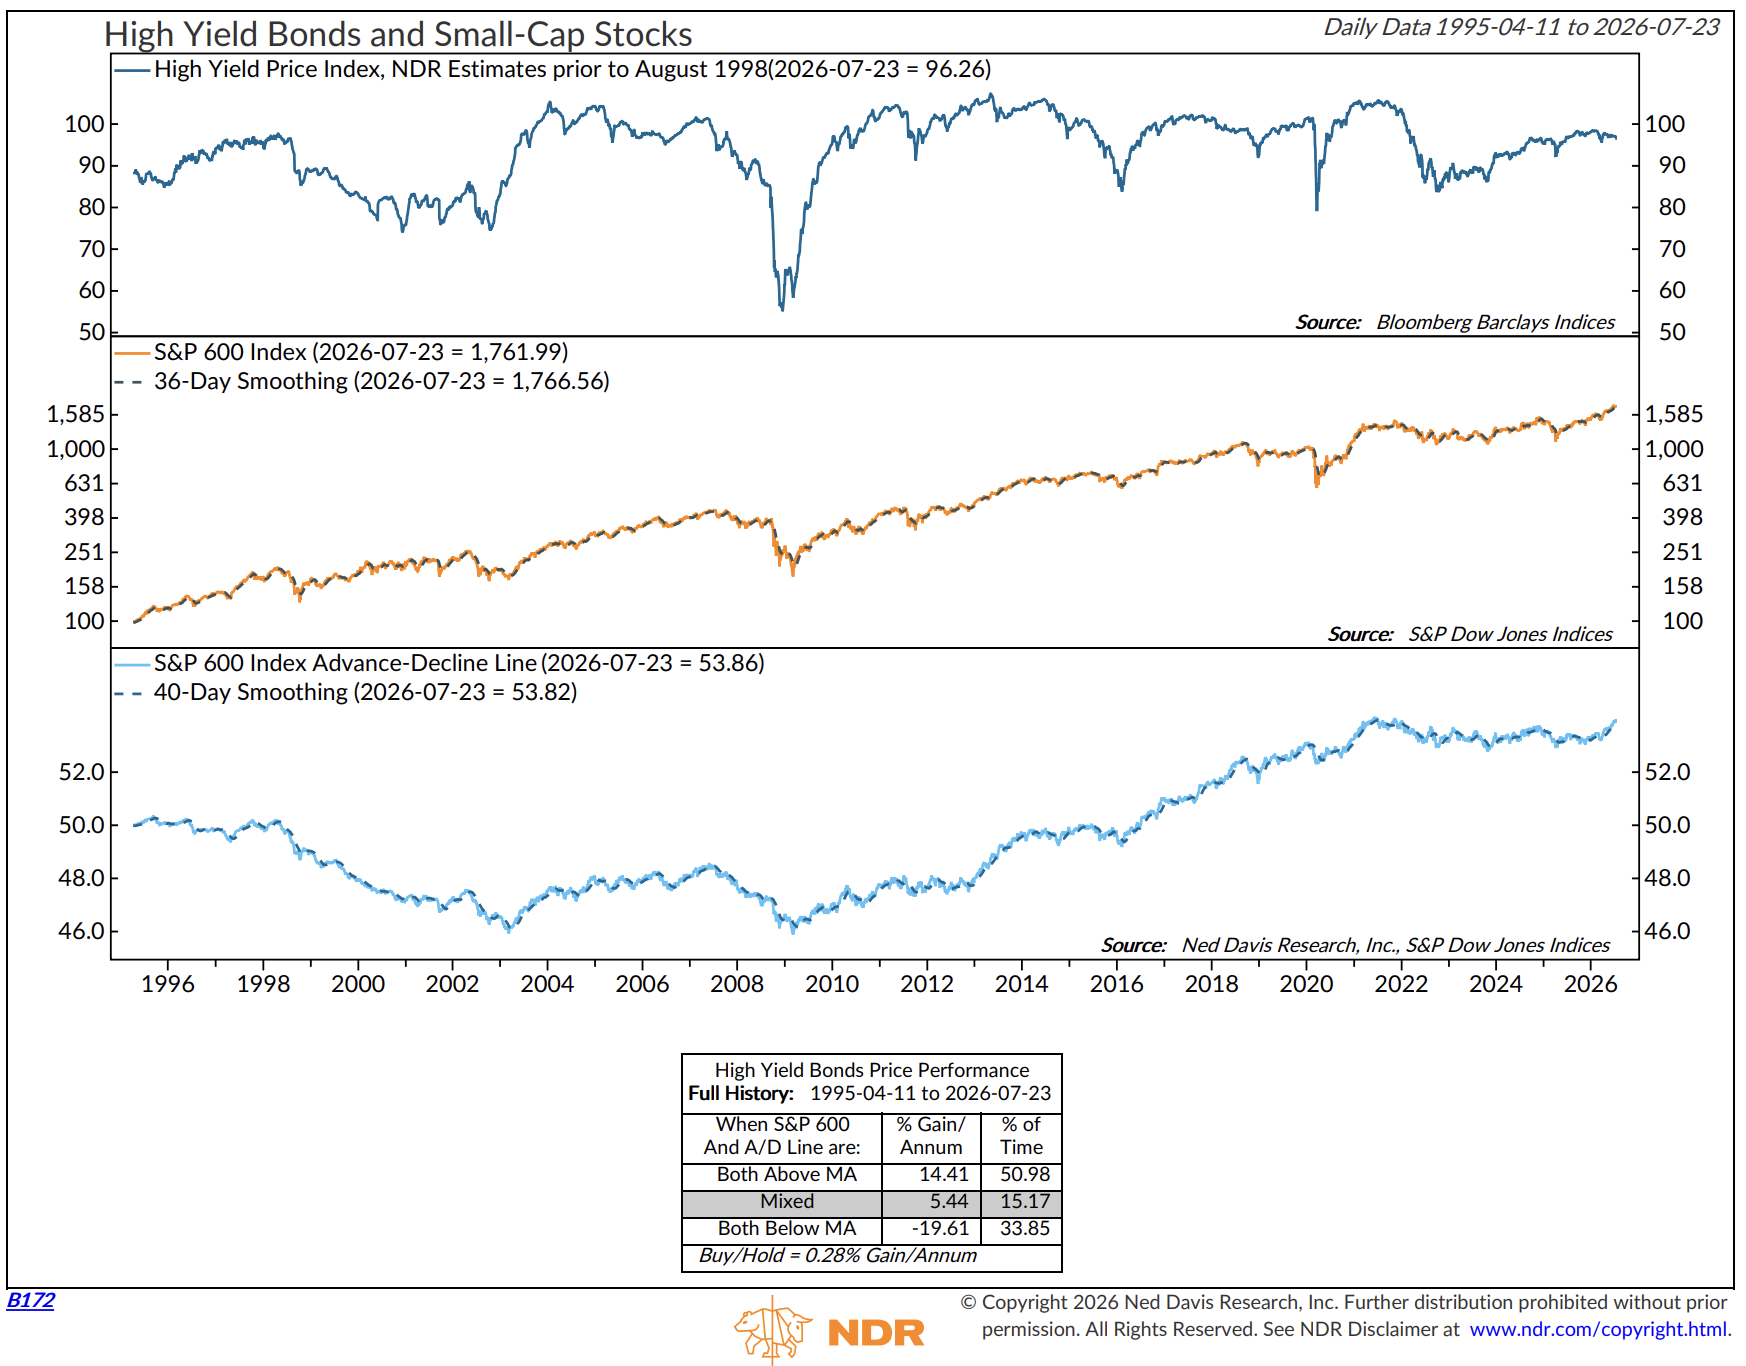
Source: NDR
Households Are “All-In”
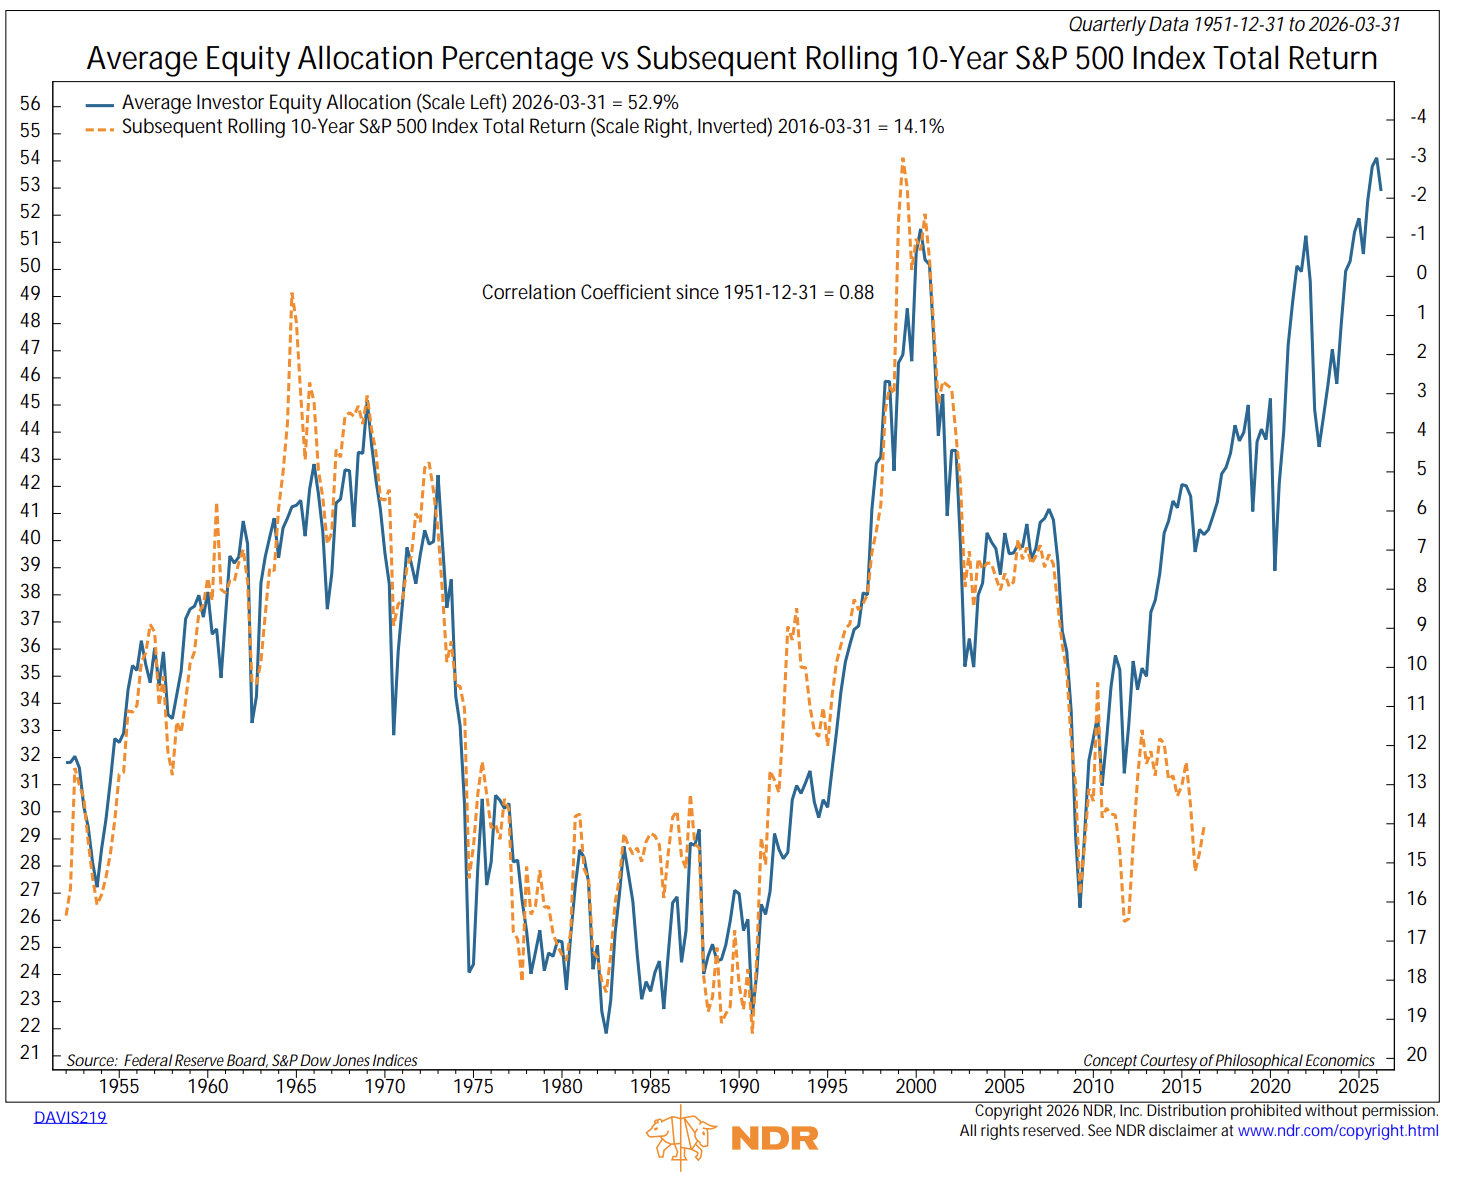
Not only is the S&P 500 index extremely overvalued, but investors, as measured by the Average Investor Equity Allocation Percentage, are all-in.
Note the high correlation with “Average Equity Allocation Percentage” and “Subsequent Rolling 10-Year S&P 500 Index Total Return.”
The current level suggests a -2% outcome ten years from now. A 0% return for the S&P 500 index over the next ten years is my base case.
Bottom line: There are other areas to consider. Look for out-of-favor high and growing dividend stocks - it appears to be a similar setup to 1999. Commodities are unloved, and look to where the major money is flowing: infrastructure, natural resources, energy, aerospace and defense, robotics, quantum computing, AI, of course. NOT A SPECIFIC RECOMMENDATION FOR YOU TO BUY OR SELL ANYTHING. SPEAK WITH YOUR ADVISOR. All INVESTING INVOLVES RISK.
Source: NDR
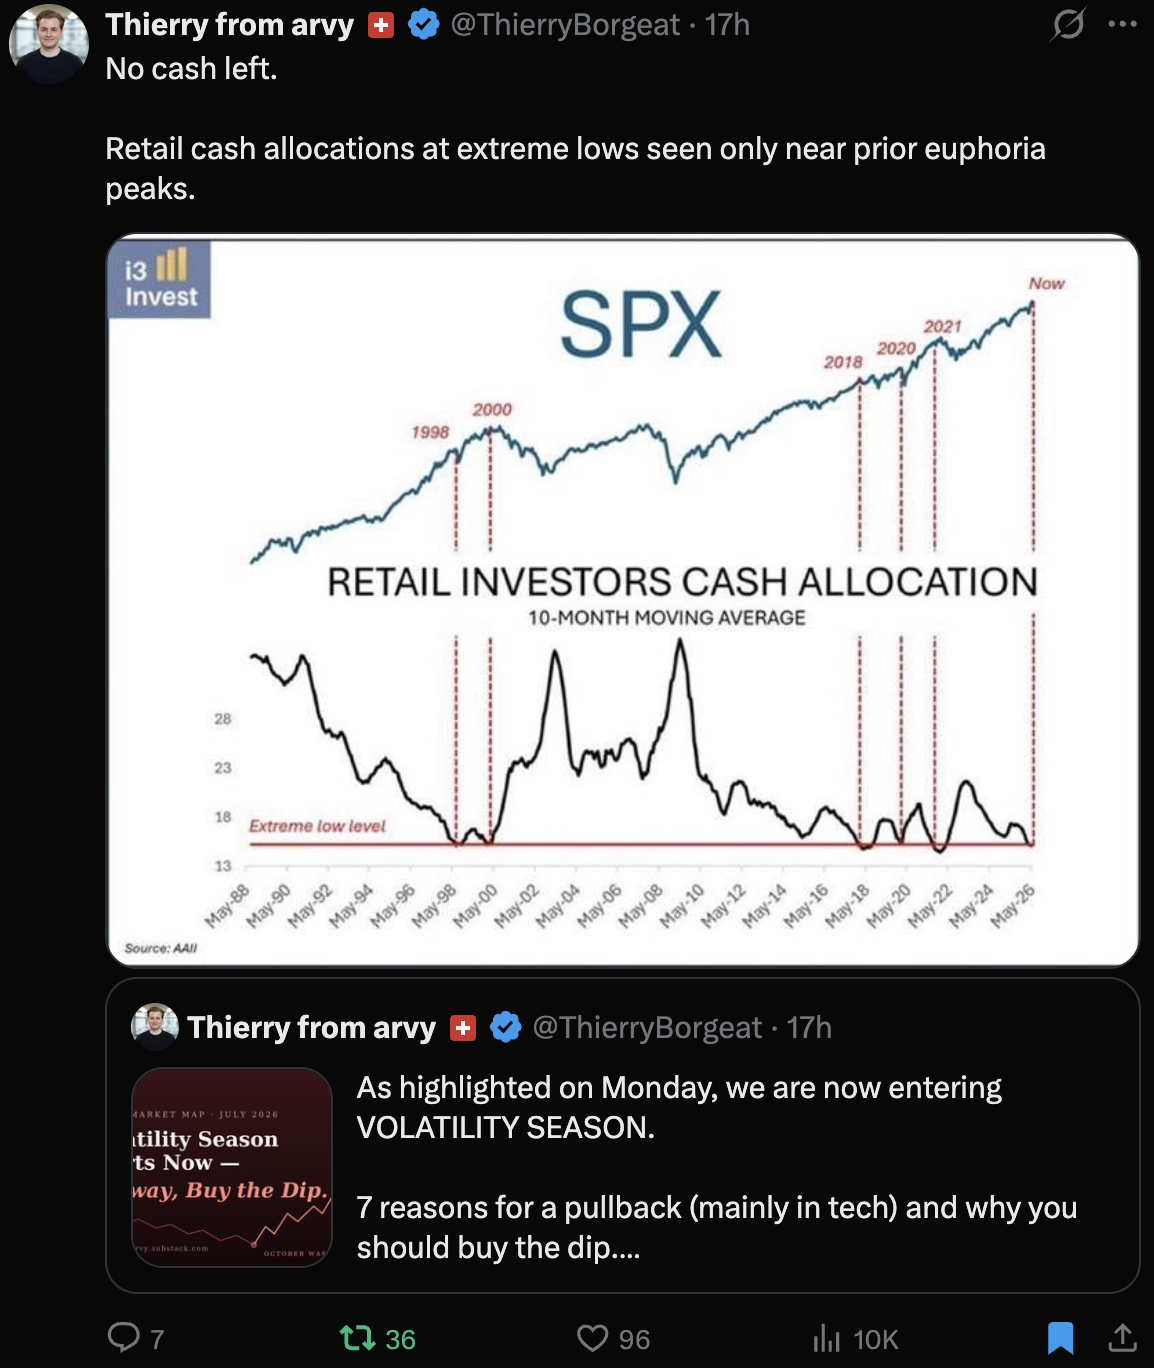
And finally, investor cash allocations are near other market peaks. Another sign of investors being “all-in.”
Source: @ThierryBorgeat
Share this letter on X by clicking here.
Opinions are subject to change. Not a recommendation to buy or sell any security. Please note that the information provided is not recommended for buying or selling any security and is provided for discussion purposes only.
If you like what you are reading, click on the link and share it with a friend (it’s free).
CLICK HERE TO SUBSCRIBE TO ON MY RADAR
Trade Signals: July 23, 2026 Update
Trade Signals
The Indicators Dashboard - Stocks, Investor Sentiment, Bonds, Commodities, Currencies, and Gold
Valuations and Subsequent 10-year Returns
Supporting Charts with Explanations

TRADE SIGNALS SUBSCRIPTION ACKNOWLEDGEMENT / IMPORTANT DISCLOSURES
About Trade Signals - Trade Signals is a paid subscription service that posts daily, weekly, and monthly market trends (and more). Free for CMG clients. Not a recommendation to buy or sell any security. For discussion purposes only.
The views expressed herein are solely those of Steve Blumenthal as of the date of this report and are subject to change without notice. Please note that the information provided is not recommended for buying or selling any security and is provided for discussion purposes only.
Personal Note: David Friedberg On Age Reversal
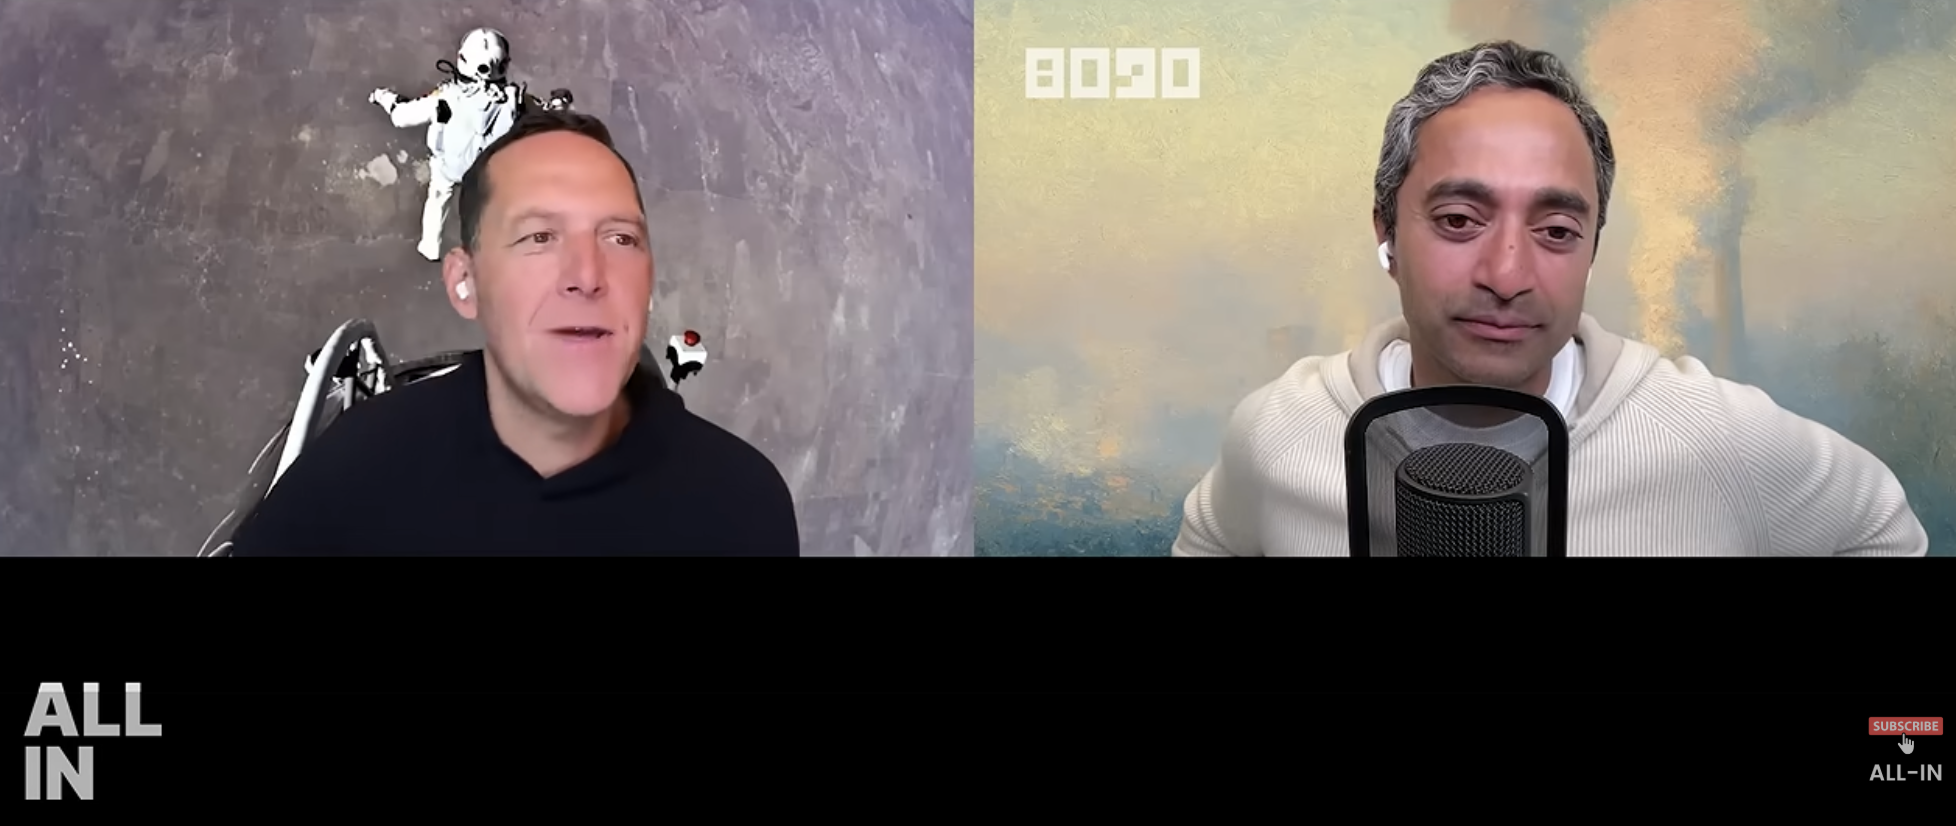
One of the exciting parts of my day job is diligencing and investing in venture capital-type opportunities. I have deep connections and understanding of biopharma and bioagriculture. The following short video clip caught my attention - David Friedberg’s All-In Podcast “Science Corner.”
David discusses new data on reversing aging! Yes, really…
Click on the image to watch the short video. Exciting stuff!
Source: All In Podcast
Dinner in Chicago, August 19, 2026
I’ll be hosting a dinner for clients and OMR readers in Chicago on Wednesday, August 19, 2026. If you are interested in joining, please email Amy@cmgwealth.com to reserve a spot (space is limited).
Vacation
There will be no On My Radar next week. Susan and I are heading to the Jersey Shore (Stone Harbor) for a long weekend. Some much-needed downtime. I’ll be reading my dear friend Tom Giachetti’s new book, The Ladder. Tom became my SEC attorney after a chance meeting at a Washington, D.C. conference in 1992. He was seated next to my father and struck up a conversation. Tom excused himself, and moments later he was presenting on stage. When he sat back down, Dad said, “Tom, we need to talk.”
I sure do love and appreciate him, and I hope you enjoy his book. I’ve hot-linked the book cover if you are interested.

I know I packed a lot into this week's letter. No need to read it all in one sitting; take it in chunks and come back to a section later if it's useful. I do the same thing with pieces I want to absorb.
Thanks for reading.
Tonight, raise a glass — let's toast to age reversal!
Kind regards,
Steve
CLICK HERE TO SUBSCRIBE TO ON MY RADAR - IT’S FREE
You can share this letter on X by clicking here.
You can share this letter on LinkedIn by clicking here.
Subscribe to OMR for free by clicking the photo.
Stephen B. Blumenthal
Executive Chairman & CIO
CMG Capital Management Group, Inc.
75 Valley Stream Parkway, Suite 201,
Malvern, PA 19355
CMG Customer Relationship Summary (Form CRS)
Metric-Financial, LLC Customer Relationship Summary (Form CRS)

Stephen Blumenthal founded CMG Capital Management Group in 1992 and serves today as its Executive Chairman and CIO. Steve authors a free weekly e-letter entitled, “On My Radar.” Steve shares his views on macroeconomic research, valuations, portfolio construction, asset allocation and risk management. Author of Forbes Book: On My Radar, Navigating Stock Market Cycles.
Follow Steve on X @SBlumenthalCMG and LinkedIn.
IMPORTANT DISCLOSURE INFORMATION
This document is prepared by CMG Capital Management Group, Inc. (“CMG”) and is circulated for informational and educational purposes only. There is no consideration given to the specific investment needs, objectives, or tolerances of any of the recipients. Additionally, CMG’s actual investment positions may, and often will, vary from its conclusions discussed herein based on any number of factors, such as client investment restrictions, portfolio rebalancing, and transaction costs, among others. Recipients should consult their own advisors, including tax advisors, before making any investment decision. This material is for informational and educational purposes only and is not an offer to sell or the solicitation of an offer to buy the securities or other instruments mentioned. This material does not constitute a personal recommendation or take into account the particular investment objectives, financial situations, or needs of individual investors which are necessary considerations before making any investment decision. Investors should consider whether any advice or recommendation in this research is suitable for their particular circumstances and, where appropriate, seek professional advice, including legal, tax, accounting, investment, or other advice. The views expressed herein are solely those of Steve Blumenthal as of the date of this report and are subject to change without notice.
Investing involves risk.
This letter may contain forward-looking statements relating to the objectives, opportunities, and future performance of the various investment markets, indices, and investments. Forward-looking statements may be identified by the use of such words as; “believe,” anticipate,” “planned,” “potential,” and other similar terms. Examples of forward-looking statements include, but are not limited to, estimates with respect to financial condition, results of operations, and success or lack of success of any particular market, index, investment, or investment strategy. All are subject to various factors, including, but not limited to, general and local economic conditions, changing levels of competition within certain industries and markets, changes in legislation or regulation, Federal Reserve policy, and other economic, competitive, governmental, regulatory, and technological factors affecting markets, indices, investments, investment strategy and portfolio positioning that could cause actual results to differ materially from projected results. Such statements are forward-looking in nature and involve a number of known and unknown risks, uncertainties, and other factors, and accordingly, actual results may differ materially from those reflected or contemplated in such forward-looking statements. Investors are cautioned not to place undue reliance on any forward-looking statements or examples. All statements made herein speak only as of the date that they were made. Investing is inherently risky and all investing involves the potential risk of loss.
Past performance does not guarantee or indicate future results. Different types of investments involve varying degrees of risk, and there can be no assurance that the future performance of any specific investment, investment strategy, or product (including the investments and/or investment strategies recommended or undertaken by CMG), or any non-investment related content, made reference to directly or indirectly in this commentary will be profitable, equal any corresponding indicated historical performance level(s), be suitable for your portfolio or individual situation or prove successful. Due to various factors, including changing market conditions and/or applicable laws, the content may no longer be reflective of current opinions or positions. Moreover, you should not assume that any discussion or information contained in this commentary serves as the receipt of, or as a substitute for, personalized investment advice from CMG. Please remember to contact CMG, in writing, if there are any changes in your personal/financial situation or investment objectives for the purpose of reviewing/evaluating/revising our previous recommendations and/or services, or if you would like to impose, add, or to modify any reasonable restrictions to our investment advisory services. Unless, and until, you notify us, in writing, to the contrary, we shall continue to provide services as we do currently. CMG is neither a law firm, nor a certified public accounting firm, and no portion of the commentary content should be construed as legal or accounting advice.
No portion of the content should be construed as an offer or solicitation for the purchase or sale of any security. References to specific securities, investment programs or funds are for illustrative purposes only and are not intended to be, and should not be interpreted as recommendations to purchase or sell such securities.
This presentation does not discuss, directly or indirectly, the amount of the profits or losses realized or unrealized, by any CMG client from any specific funds or securities. Please note: In the event that CMG references performance results for an actual CMG portfolio, the results are reported net of advisory fees and inclusive of dividends. The performance referenced is that as determined and/or provided directly by the referenced funds and/or publishers, has not been independently verified, and does not reflect the performance of any specific CMG client. CMG clients may have experienced materially different performance based upon various factors during the corresponding time periods. See in links provided citing limitations of hypothetical back-tested information. Past performance cannot predict or guarantee future performance. Not a recommendation to buy or sell. Please talk to your advisor.
Information herein has been obtained from sources believed to be reliable, but we do not warrant its accuracy. This document is general communication and is provided for informational and/or educational purposes only. None of the content should be viewed as a suggestion that you take or refrain from taking any action nor as a recommendation for any specific investment product, strategy, or other such purposes.
In a rising interest rate environment, the value of fixed-income securities generally declines, and conversely, in a falling interest rate environment, the value of fixed-income securities generally increases. High-yield securities may be subject to heightened market, interest rate, or credit risk and should not be purchased solely because of the stated yield. Ratings are measured on a scale that ranges from AAA or Aaa (highest) to D or C (lowest). Investment-grade investments are those rated from highest down to BBB- or Baa3.
NOT FDIC INSURED. MAY LOSE VALUE. NO BANK GUARANTEE.
Certain information contained herein has been obtained from third-party sources believed to be reliable, but we cannot guarantee its accuracy or completeness.
In the event that there has been a change in an individual’s investment objective or financial situation, he/she is encouraged to consult with his/her investment professional.
Written Disclosure Statement. CMG is an SEC-registered investment adviser located in Malvern, Pennsylvania. Stephen B. Blumenthal is CMG’s founder and CEO. Please note: The above views are those of CMG and its CEO, Stephen Blumenthal, and do not reflect those of any sub-advisor that CMG may engage to manage any CMG strategy, or exclusively determines any internal strategy employed by CMG. A copy of CMG’s current written disclosure statement discussing advisory services and fees is available upon request or via CMG’s internet web site at www.cmgwealth.com/disclosures. CMG is committed to protecting your personal information. Click here to review CMG’s privacy policies.
See CMG Disclosures at the bottom of this page.
For more information about NDR, please visit at www.ndr.com.
NDR, Inc. (NDR), d.b.a. Ned Davis Research Group (NDRG), any NDRG affiliates or employees, or any third-party data provider, shall not have any liability for any loss sustained by anyone who has relied on the information contained in any NDRG publication. The data and analysis contained herein are provided "as is." NDRG disclaims any and all express or implied warranties, including, but not limited to, any warranties of merchantability, suitability or fitness for a particular purpose or use. NDRG's past recommendations and model results are not a guarantee of future results. This communication reflects our analysts' opinions as of the date of this communication and will not necessarily be updated as views or information change. All opinions expressed herein are subject to change without notice. NDRG or its affiliated companies or their respective shareholders, directors, officers and/or employees, may have long or short positions in the securities discussed herein and may purchase or sell such securities without notice. For NDRG's important additional disclaimers, refer to www.ndr.com/invest/public/copyright.html. Further distribution prohibited without prior permission. Copyright 2025 © NDR, Inc. All rights reserved.