November 20, 2026
By Steve Blumenthal
“The trouble with late-cycle markets is that everything can look reasonably stable right up until it isn't. Debt builds slowly. Leverage increases. Valuations stretch. Investors grow comfortable taking more risk. And then something changes.”
— Steve Blumenthal, On My Radar, Pressure Points - October 30, 2026
I followed that with: “We don’t know what that something will be, or when it will arrive.”
In November, it arrived.
For months, we’ve been writing about a market that is overvalued, overconcentrated, overowned and overleveraged. Record margin debt. Valuations near historic highs. And an index, and increasingly an economy, leaning on a handful of technology companies to keep delivering. When that much weight rests on so few shoulders, it doesn’t take much to tip things over.
What tipped it was something no one saw coming. On November 12, Jensen Huang resigned as Nvidia’s CEO. Nvidia sits at the center of the AI boom, and when the center shook, everything built around it shook too.
Below is a two-year chart of Nvidia’s stock. It’s back where it was two years ago, down about 45% from its October high. The spike in trading volume (red arrow, bottom-right) reflects panic selling. Margin calls? To a degree, I suspect.
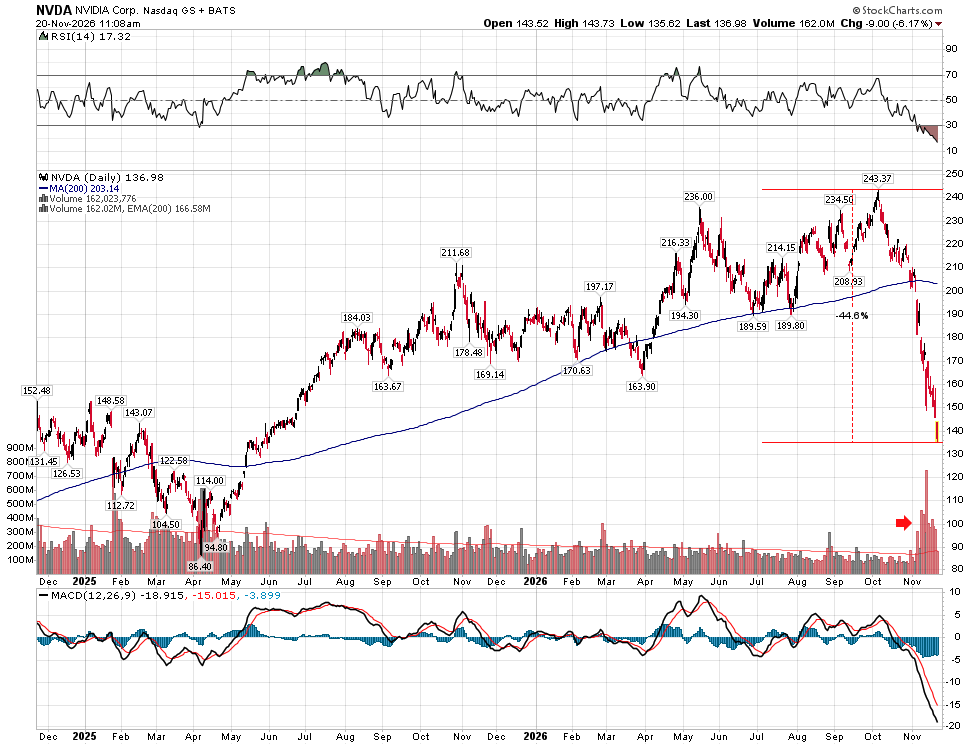
Source: StockCharts.com, CMG annotations
Timing the bottom is almost as difficult as timing the top. Perhaps a little easier, as they tend to happen quickly and tend to form a V-shaped bottom due to forced liquidations of brokerage accounts tied to margin calls. Overall, investing is a game of probabilities, not a game of perfection. In the short term, it is a betting game; in the long term, it’s about finding businesses that can generate high free cash flow and grow.
Fear is rising; it is a good time to remember the late-great Charlie Munger. As he put it, “I think the record shows the advantage of a peculiar mind-set, not seeking action for its own sake, but instead combining extreme patience with extreme decisiveness.” With many big-name tech stocks down 20-50% or more, we are getting closer to an extreme decision point.
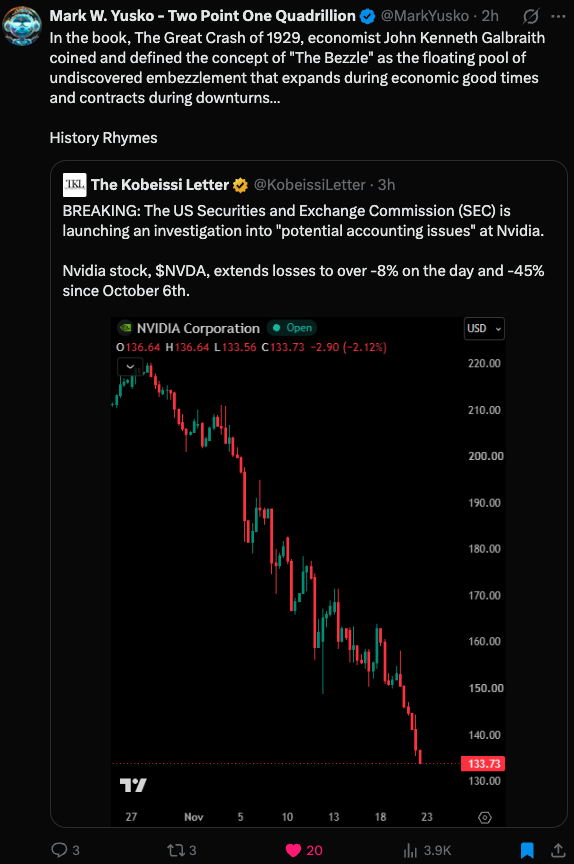
We’ll touch on that today in the VIX section below. The VIX can be a helpful tool for measuring periods of extreme fear.
The Biggest IPO in History
On Wednesday, Anthropic, the maker of Claude, priced its IPO at $83 a share, well above the $70 to $78 range it had been marketing. That values the company at roughly $1.5 trillion, making it the first major frontier AI lab to go public. The demand was enormous - orders reportedly came in at about six times the shares on offer.
The IPO raised about $68.5 billion, and a private placement priced at the same $83 added another $26 billion for a total of ~ $94.5 billion. It topped SpaceX’s $85.7 billion raise from just five months ago, which makes it the largest IPO ever.
I think you’ll find the chart below interesting. It puts into perspective what a year 2026 has been for mega IPOs. It’s the busiest since 2021, when Coinbase, Roblox and Robinhood came to market. Amazing, actually. I wonder how much of the current selling was to meet margin call needs and how much to reposition some capital to ANT (Anthropic’s really great ticker).
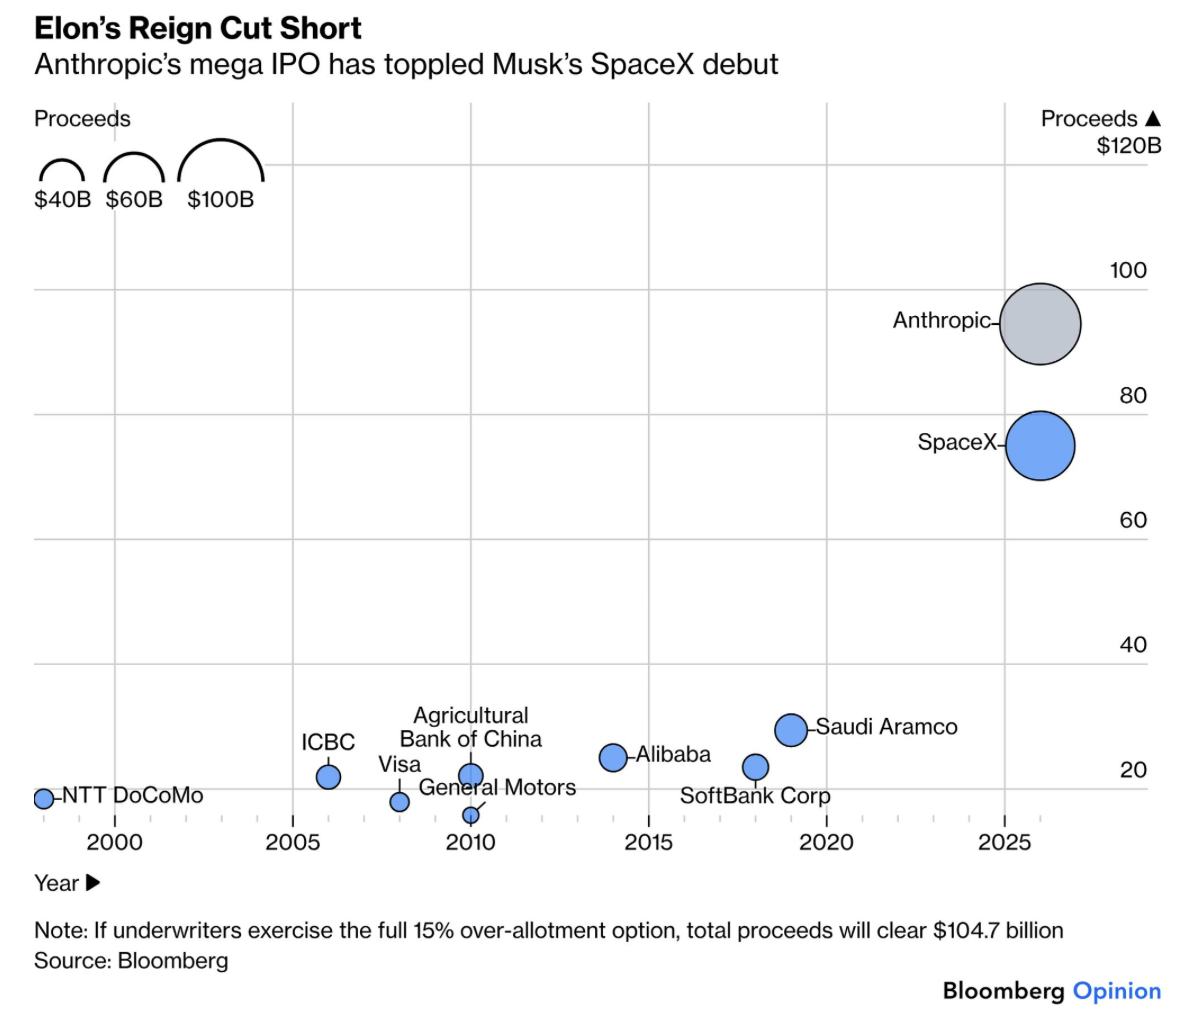
What is clear is that the enthusiasm for AI is real and so is the flood of capital chasing it. At the $83 offering price, investors paid about 18 times Anthropic’s $81 billion annualized revenue run rate. By Thursday’s close, they were paying closer to 22 times. That’s a multiple on revenue, not earnings. For a valuation like that to work, earnings have to grow very fast for a very long time. Maybe they will, but history suggests we stay humble about it.
The markets tumbled on Thursday and were down again today. The S&P 500 index dropped 3.70%, the NASDAQ 5.28%, and the Russell 2000 2.76%. Nvidia plunged 14%. It was the worst week of the year. The Dow had its worst week since March 2020. Source: CNBC, Yahoo Finance.
Pressure is starting to come out of the system, and the largest IPO in history landed right in the middle of it.
Grab that coffee and find your favorite chair. I explain what the VIX is and how to read it (in plain English), look at margin debt and why I’m cautious about using forward P/E as a valuation measure, highlight some important macro points to keep top of mind, and revisit the yen carry trade to see if there is evidence of the leverage in it unwinding.
Included in this week’s On My Radar:
The VIX Explained
Leverage and Valuations Matter
Macro Data
The Yen Carry Trade Watch
Trade Signals: November 19, 2026
Personal Note: Thanksgiving, West Palm Beach and Austin, TX
OMR is for informational and educational purposes only. No consideration is given to your specific investment needs, objectives, or tolerances.
Please see the Important Disclosures at the bottom of this page. Reminder: This is not a recommendation to buy or sell any security. My views may change at any time. The information is for discussion and educational purposes only.
If you like what you are reading, you can subscribe for free.

The VIX Explained
What is the VIX?
The VIX is often called Wall Street’s “fear gauge.” It measures how much movement investors expect in the S&P 500 over the next 30 days, based on the prices they pay for S&P 500 options. When investors get nervous, they rush to buy protection (put options). That pushes option prices up, and the VIX rises with them.
A quick way to read the number: divide the VIX by 16 (roughly the square root of 252 trading days) to get the expected daily move. At today’s 31.7, the market is pricing in daily swings of about 2% in the S&P 500. A VIX of 13 or 14, where we were not long ago, implies less than 1% a day.
Rough ranges:
Under 15: calm, often complacent
15–20: normal
20–30: elevated worry
Above 30: fear
Above 40: panic (2008, 2020)
How traders use it:
As a contrarian signal. VIX spikes tend to come near market lows, not highs. When fear peaks, selling is often nearly exhausted. The chart below shows this: the big spikes in 2002, 2008, 2020 and 2025 all came close to major buying opportunities. Hence the saying, “When the VIX is high, it’s time to buy.”
As a warning, when it’s too low. Long stretches of very low VIX (2006–07, 2017) show complacency. Calm markets can get crowded and fragile, which can set off sharp shocks like the one in February 2018.
To time hedges. Protection is cheapest when the VIX is low. Disciplined managers buy their hedges then, not in the middle of a spike when everyone is paying up.
To size risk. Many systematic and volatility-targeting funds automatically cut their stock exposure as the VIX rises. That forced selling can make declines worse, then reverse quickly. That’s the “V” bottom pattern I write about.
The key caveat: the VIX tells you how scared investors are, not which way the market will go. A spike can mark a bottom, as in 2020, or the start of a longer grind lower, as in 2008, where the VIX stayed elevated for months. That’s why it works best alongside trend and breadth indicators, such as those in Trade Signals, rather than on its own.
On today’s chart, the monthly RSI is near 70 while the VIX is only at 32. Fear is rising quickly from a very complacent starting point. Historically, that setup has rewarded patience more than panic, but it’s worth watching whether the spike fades or keeps going.
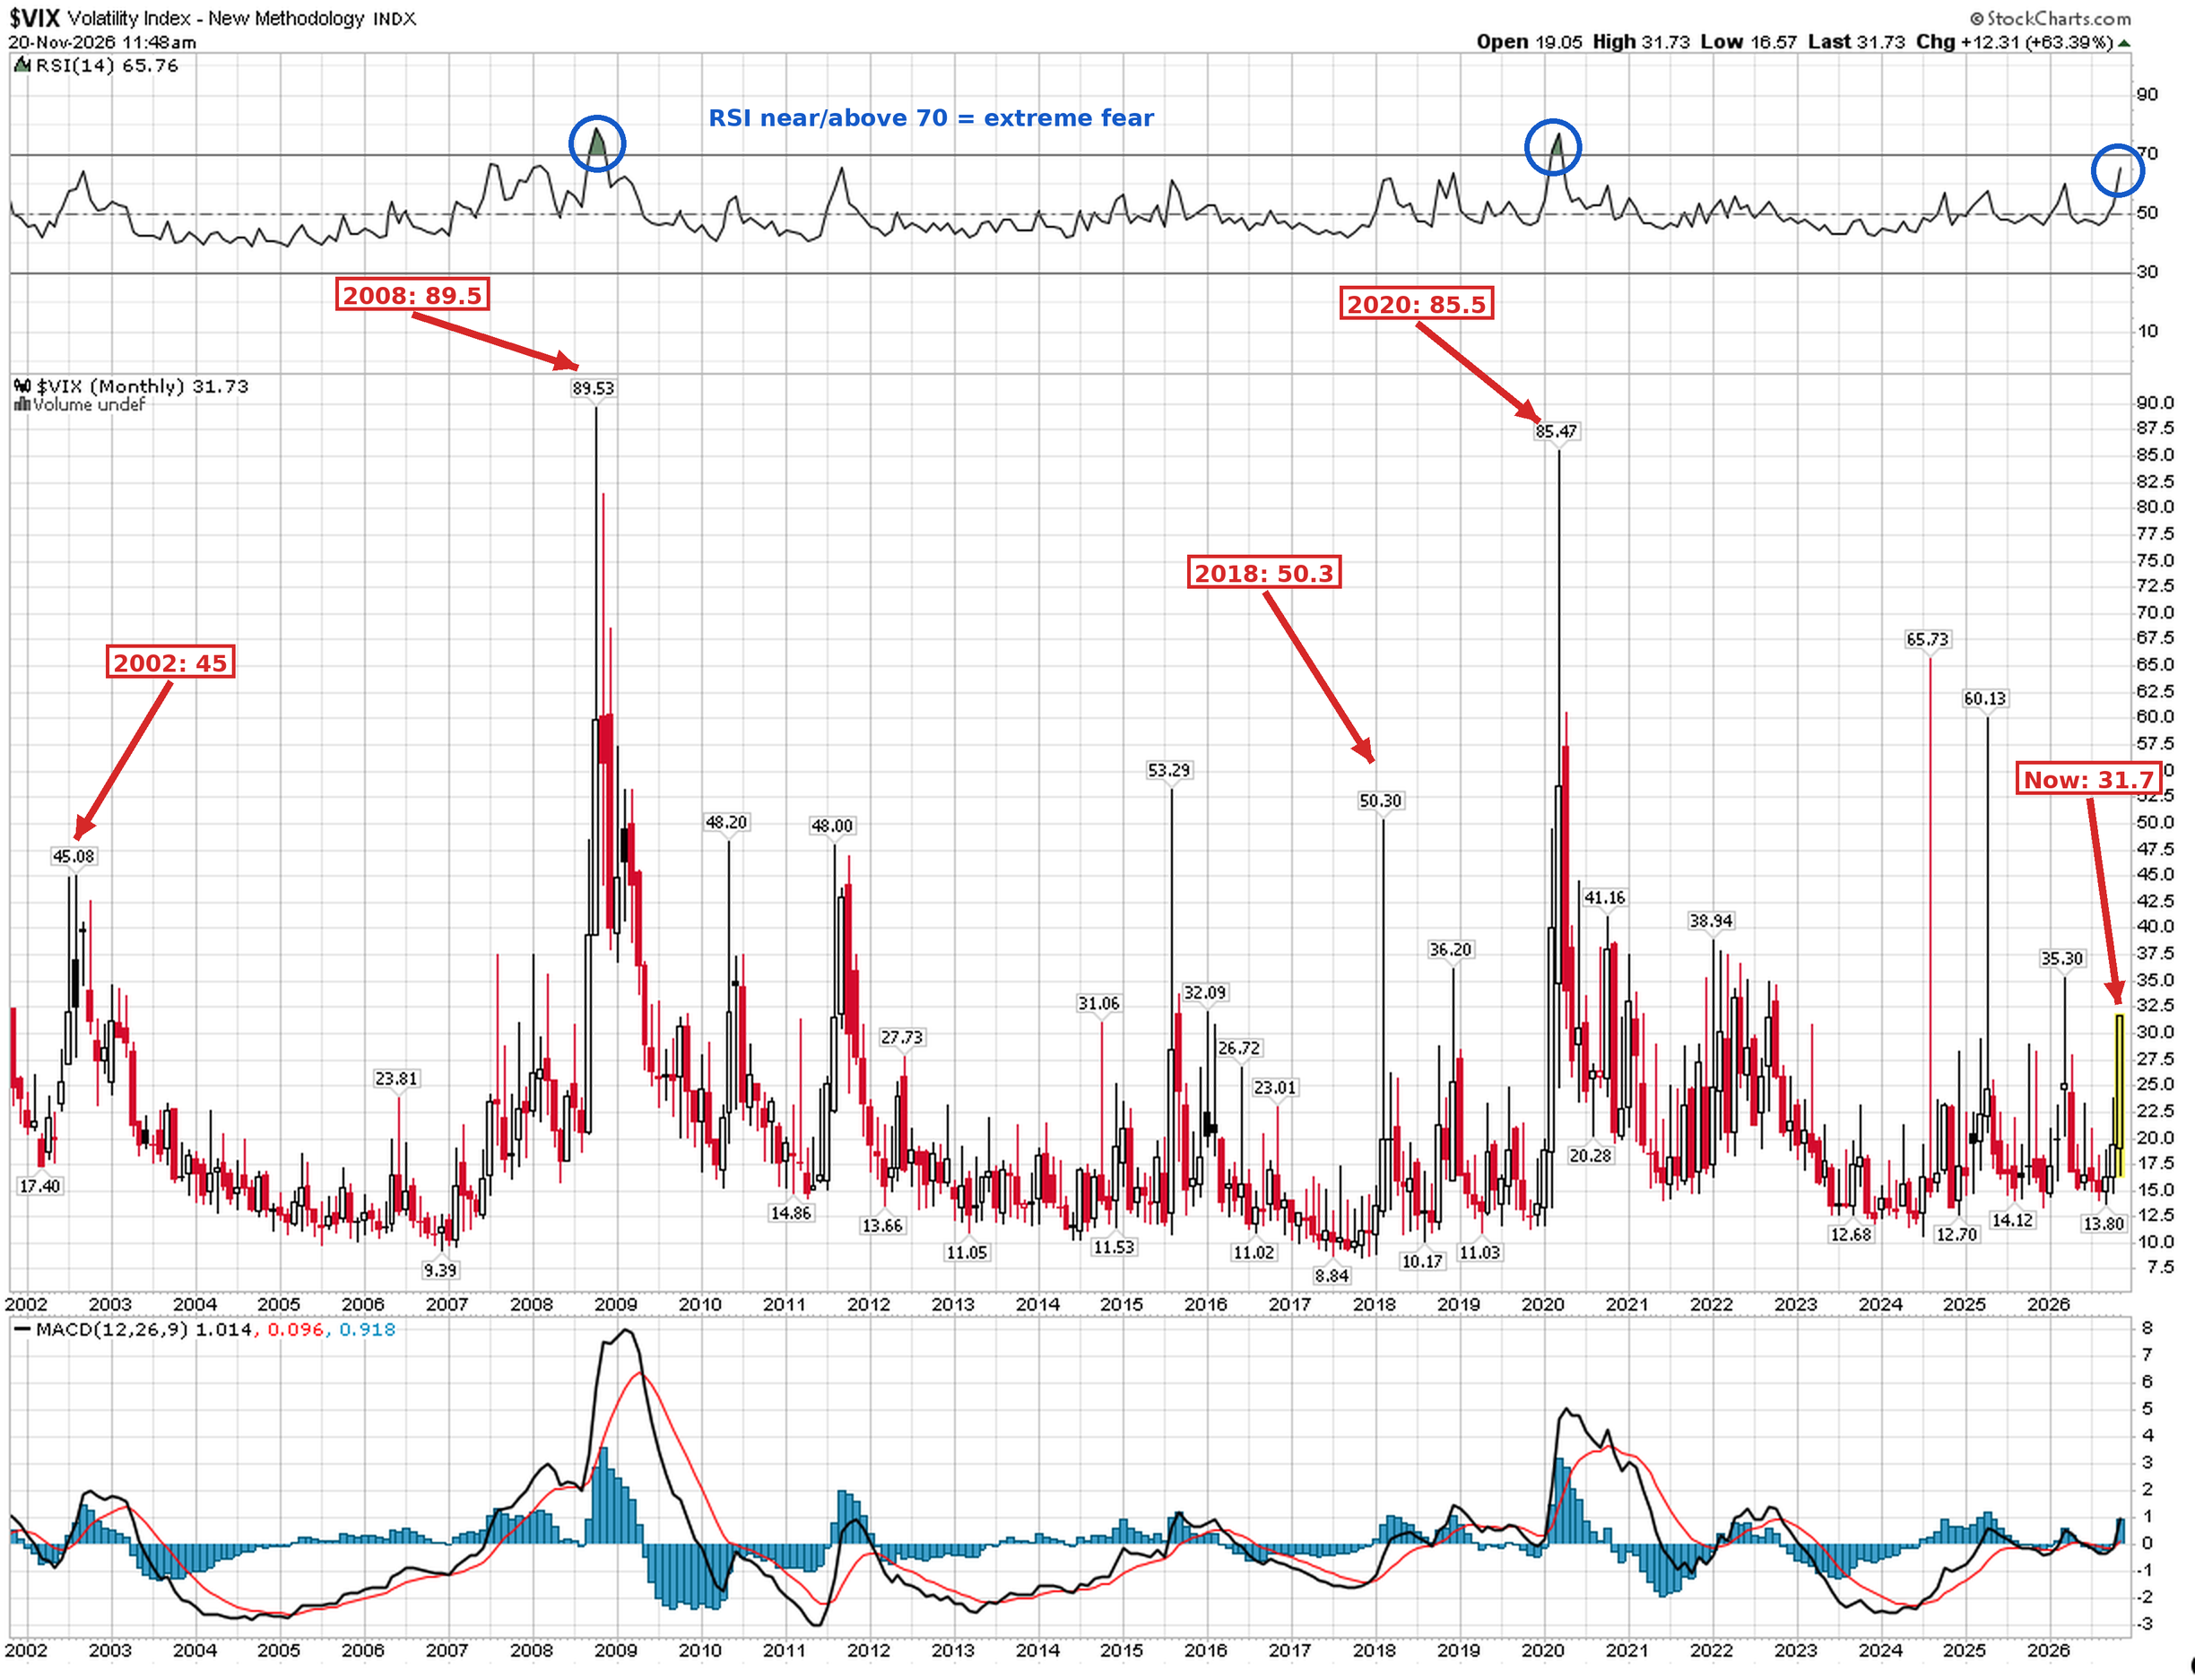
Source: StockCharts.com, CMG annotations
Nvidia’s on my shopping list and I’m beginning to get excited. For growth, I remain bullish on robotics, quantum computing, AI, energy infrastructure, gene editing, select biopharma, and blockchain. For core, I favor high free cash flow/high- and growing-dividend stocks, select absolute-return strategies, and first-lien senior secured lending. The point here is there are plenty of reasons to be bullish. Unless, of course, your broker is sending you margin calls. I do think it is time to begin to channel your inner Warren Buffett and Charlie Munger.
I don’t yet feel the extreme fear I felt when I wrote “it’s so bad it’s good” in late November 2008. And, I was early then. The extreme/extreme fear occurred on March 6, 2009. That was the low in the S&P 500 Index at 666. Who knew AIG would have to fire-sale its leveraged derivatives book because of the subprime mortgage crisis? But it was a good entry point regardless.
Opinions are subject to change. Not a recommendation for you to buy or sell any security.
Leverage and Valuations Matter
The October 2026 margin debt data is out; let’s take a look.
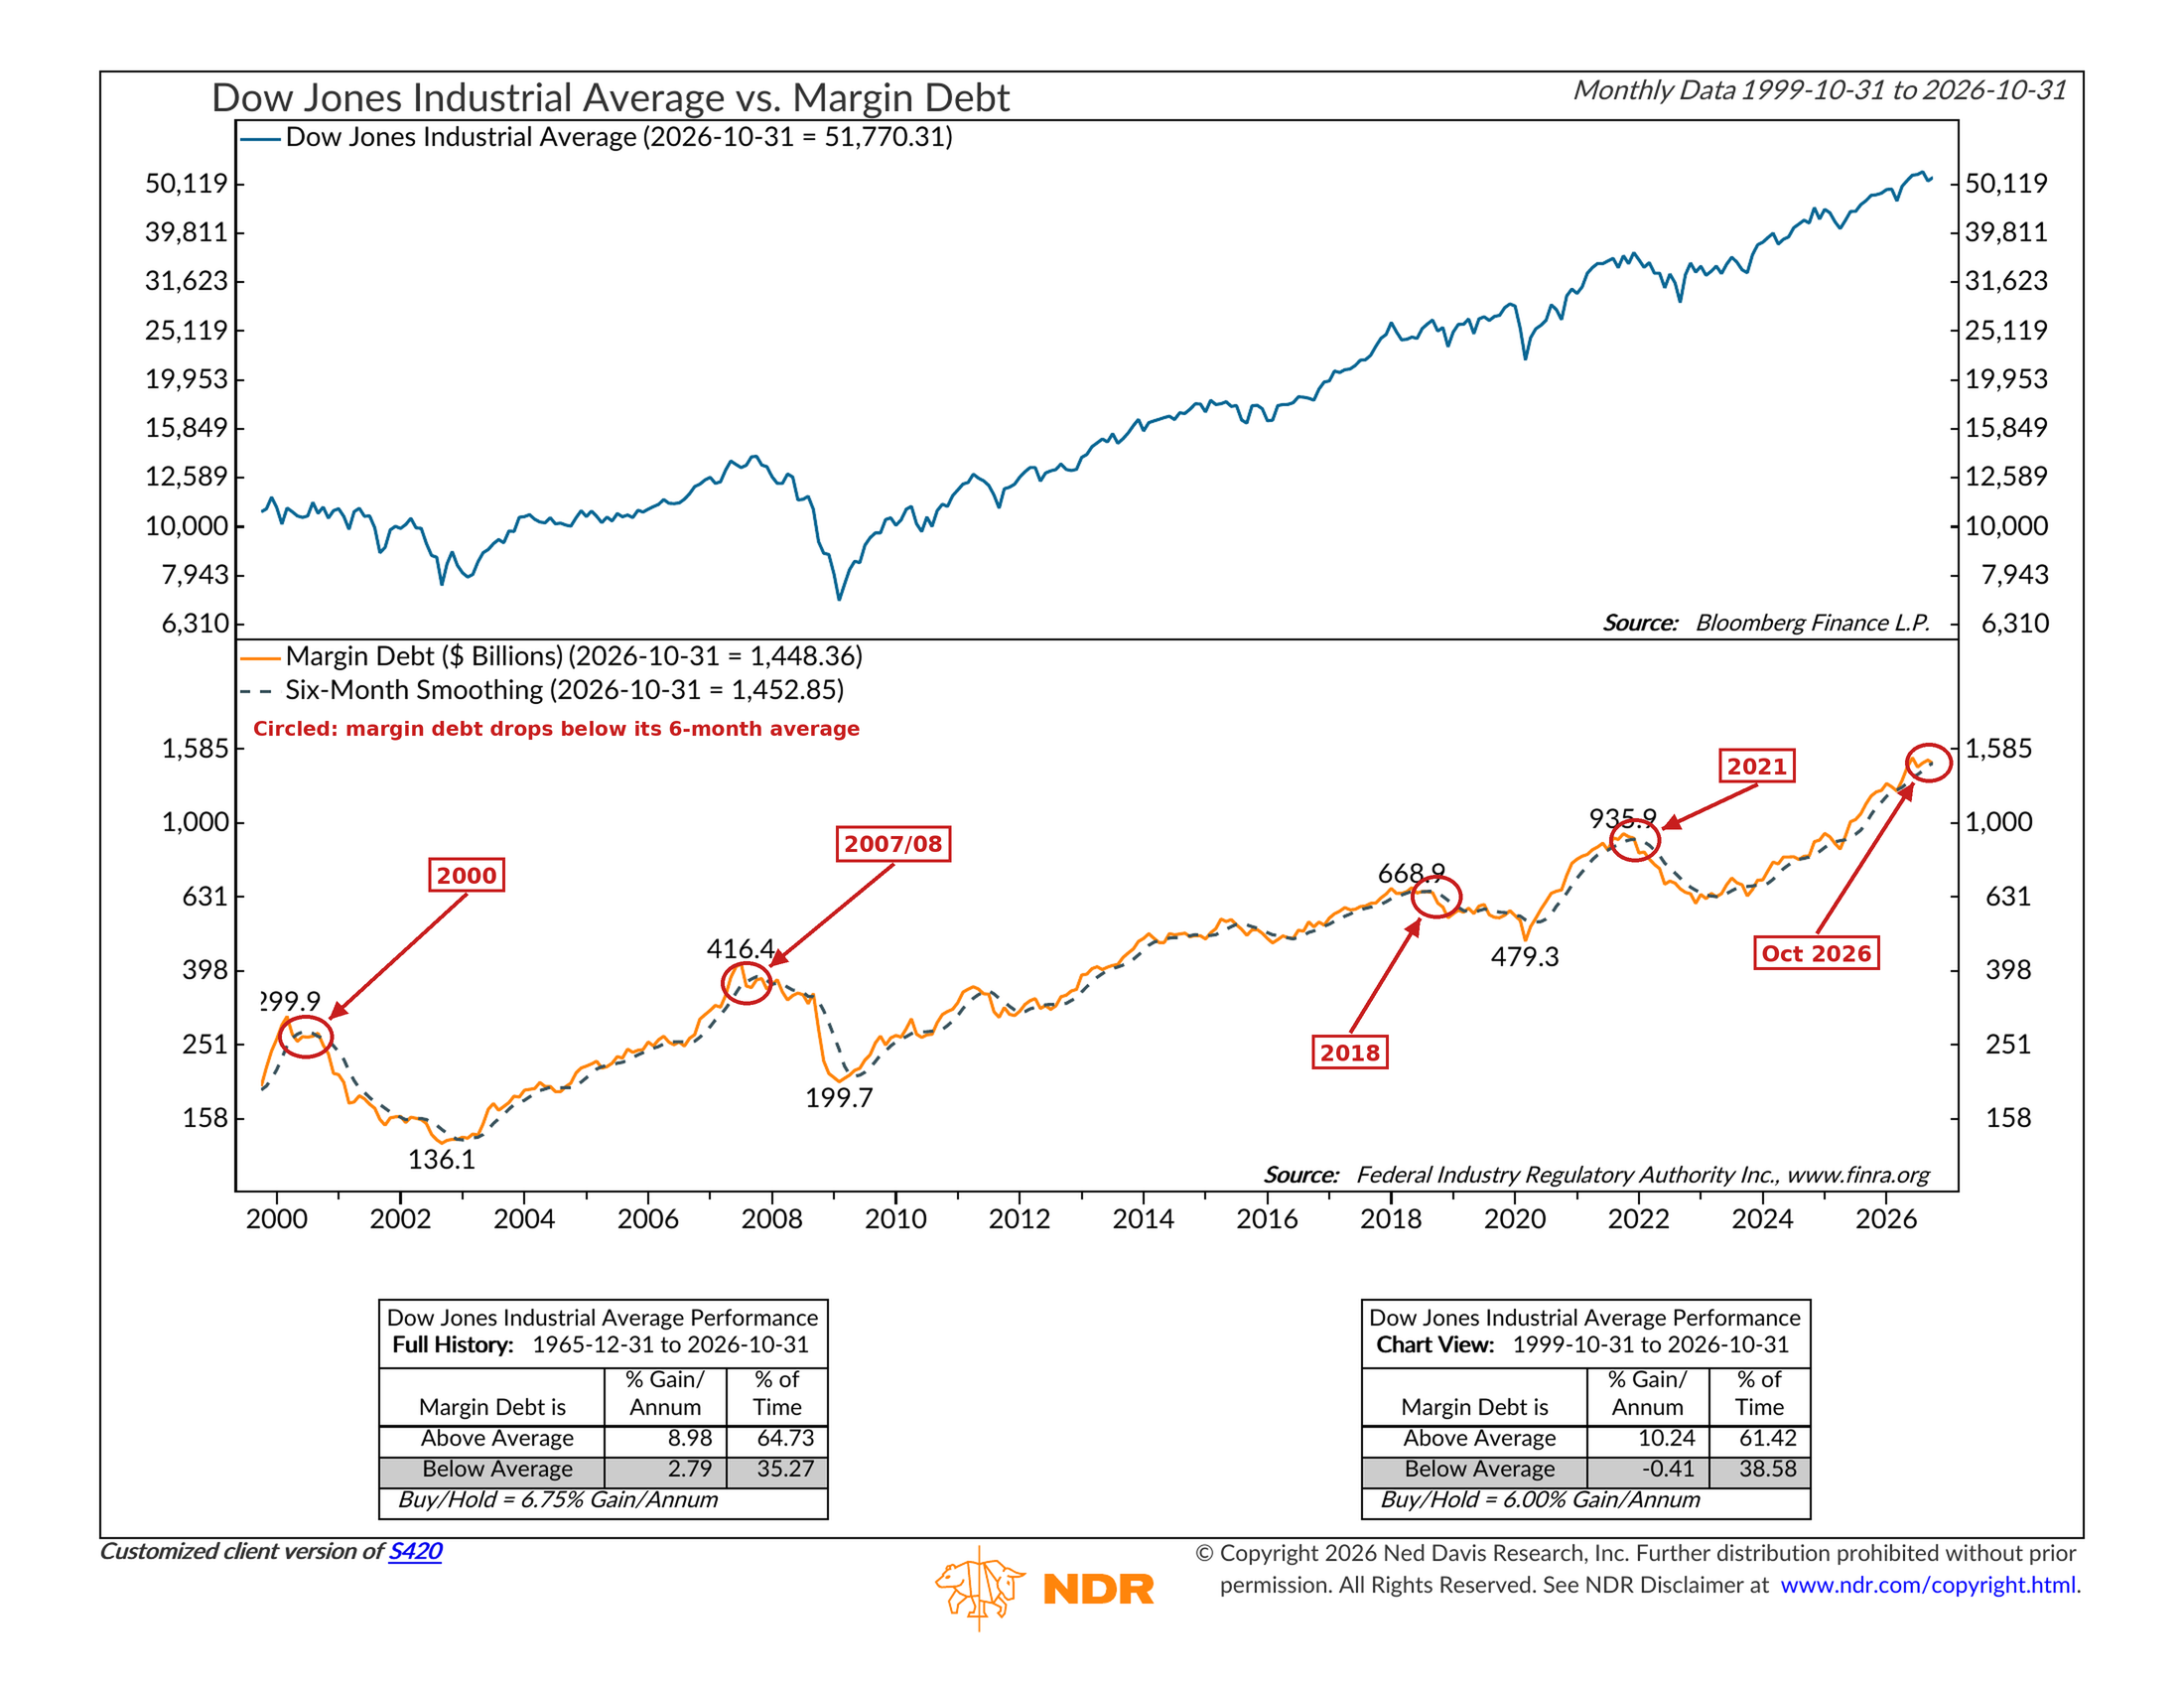
The following is an update of the margin debt chart I shared with you recently. Data is through 10-31-2026.
Here’s how to read the chart:
The orange line tracks the total outstanding Margin Debt.
The black dotted line is a 6-month smoothed moving average line.
When the orange line drops below the dotted line, it signals margin debt is declining. It is a warning signal.
Notable signals: 2000, 2007–08, 2018, 2021 and October 2026.
Source: NDR, CMG annotations
Margin debt is money investors borrow from their broker to buy stocks. In bull markets, excitement grows, and so does the borrowing.
Here’s how it works. Say you put $100,000 into Nvidia and borrow another $100,000 from your broker. You now own $200,000 of stock. If Nvidia rises 20%, your position is worth $240,000. Pay back the loan, and you’ve made $40,000 on your $100,000, a 40% gain before interest. Leverage feels great on the way up.
Now run it the other way. If Nvidia drops 40%, your $200,000 is worth $120,000. You still owe the broker $100,000, so your $100,000 is down to $20,000. If Nvidia falls 50%, you’re wiped out.
Your broker has no intention of losing money on that loan. So as the stock falls, you get a margin call: add cash, or they start selling your shares for you at whatever price the market will pay.
Now multiply that by millions of accounts. Margin debt hit a record $1.50 trillion in June. It eased to $1.45 trillion in October, still one of the highest readings on record. And borrowing isn’t cheap. Some brokers charge more than 10% on margin loans. Much of this risk sits below the surface, where we can’t see it.
Markets don’t crash because people choose to sell. They crash because people are forced to sell, all at the same time. Brokers sell at any price, buyers step back, prices fall further, and that sets off more margin calls. That’s the spiral. It’s also why crashes tend to end in a sharp V-shaped bottom. Eventually the forced selling runs out of sellers and exhausts itself.
This is the risk that comes with being overconcentrated and overleveraged, and I believe it’s what we’re starting to see. But it also creates opportunity.
That point of exhaustion creates some of the best buying opportunities an investor will ever get. It will feel so bad it’s good. Charlie Munger described his and Warren Buffett’s approach as “extreme patience combined with extreme decisiveness.” Be patient now, and be ready to act when the time comes.
A Word of Caution - The Trouble with Forward P/E
Source: @KobeissiLetter, Bloomberg
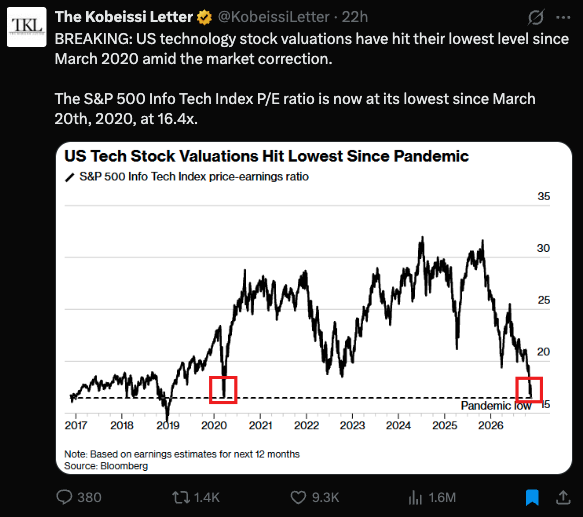
You hear forward P/E quoted constantly on financial TV and social media: “Stocks are trading at just 22 times next year’s earnings.” It sounds reassuring, but on its own, it can be misleading. In the chart above, tech stocks are trading at about 16.4 times forward earnings estimates, their lowest level since March 2020. Here’s why:
Analysts are optimistic. Historically, Wall Street has overestimated future earnings by roughly 10%, then walked the numbers down as reporting day gets closer. Inflate the “E” and stocks look cheaper than they are.
It flatters at the top. Near a market peak, projected earnings peak too, so stocks look cheap right before profit margins fall back. In a recession, it flips: estimates collapse, and a market bottom looks expensive.
Real costs get left out. Forward estimates mostly use “adjusted” (non-GAAP) earnings, which strip out real expenses like stock-based compensation and recurring restructuring charges.
It counts sentiment twice. Rising prices lead analysts to raise their estimates, which in turn justify higher prices. Both sides of the ratio move with the mood, so it behaves more like a momentum gauge than a measure of value.
It’s no timing tool. Forward P/E has almost no relationship to how stocks perform over the following year. Wall Street loves it; I don’t like it.
Bottom line: forward P/E is one input, not an answer. When someone uses it to tell you to “buy the dip,” ask them what earnings they’re assuming and how much risk you’d be taking on. I favor actual reported earnings.
Macro Data
We are fortunate to have access to a great deal of research, and the geek in me loves taking it in. I particularly like how Howard Marks thinks about risk/reward probabilities - tickets in a fish bowl. Are there more winning tickets in the bowl or are there few? A month ago, there were few. After the recent corrections, the odds are a little better today.
Last week, I shared my notes from an interview with Michael Howell of CrossBorder Capital here. I also listened to Meb Faber’s interview with Vincent Deluard and intended to share as well, but the letter got too long. I found it valuable and thought I'd share my summary notes with you this week.
Vincent Deluard: Macro Insights in Plain English
Vincent Deluard, director of global macro strategy at StoneX, is one of the most creative data minds in the business. He recently joined Meb Faber on The Meb Faber Show. Vincent has been bullish on stocks and on nominal growth since COVID. He recently turned bearish. I highlight in bold what stood out to me.
The market under the surface
• The index says bull but most stocks say bear. (Remember this interview was before the current sell-off). The S&P 500 (was) at an all-time high, yet more than 70% of U.S. stocks trade below their 200-day moving averages. A handful of giants are carrying the index. Divergences like this get resolved one of two ways: the laggards catch up, or the leaders catch down. (We are now watching the leaders catch down.)
• The "Shadow VIX" is near 40. The VIX, the market's fear gauge, looks calm. That's only because stocks have stopped moving together. The average stock's correlation with the index is about 5%, which is unprecedented. About a third of stocks are actually moving in the opposite direction to the market. Using a normal correlation of 50%–60%, Vincent calculates the VIX would be around 40, which is crisis territory. Meanwhile, the bond market's fear gauge, the MOVE index, is at all-time highs. Stocks rarely rally with the VIX above 20. (SB, an interesting “Shadow VIX” approach.)
• Rotation without conviction. Leadership has jumped from refiners to tobacco to chips and back to AI. To Vincent, that signals a tired story with nothing ready to replace it. Energy and healthcare look good, but they're too small a share of the index to carry the market. In his words, "you don't get a bull market with refiners."
• A circular argument. He thinks the AI story can keep the juices flowing until the Anthropic IPO and the midterms. After that, his line is that the only justification left for the bull market is the bull market itself. (SB, I guess he didn’t know Nvidia's CEO might resign, either.)
The economy: a "K" within a "K"
• He follows tax receipts, not GDP. Vincent trusts tax collections more than GDP or surveys, because they show real income in real time. Personal income tax receipts grew 8%–9% early this year. Now they're growing closer to 5%, which is about where he thinks true inflation is. That means most people are no longer getting ahead.
• Real wages have fallen four months in a row. Consumers have kept spending by pulling money out of investment accounts and 401(k)s. JPMorgan and Vanguard data show withdrawals rising across income levels. Vincent says this looks like 2006–07, when $100+ oil and rising rates were masked by people borrowing against their homes. The savings rate is at a generational low. That can't last.
• The top of the "K" is splitting too. A very small group tied to AI is booming. Meanwhile, the rank-and-file tech and white-collar workers who were the economy's hidden strength are starting to struggle: think Salesforce and Adobe employees rather than Anthropic employees. Credit spreads in consumer sectors are widening. That doesn't fit the story that yields are rising simply because growth is strong. (SB, yields are rising because of government deficits and debt and the need to finance maturing debt which competes for money from everyone else.)
Inflation: the shock isn't the problem, the response is.
• We live in a $150–$200 oil world. WTI looks moderate, but nobody burns crude. We burn diesel, gasoline, and jet fuel. Add about $20 of refining margin and about $20 of shipping and insurance to the price paid in Asia, and the real-world cost is $150–$200. (Howell gets roughly $160 from diesel prices, so they're telling the same story.) Two cushions are also running out. The Strategic Petroleum Reserve is near its minimum, and Chinese buyers are coming back.
• China is now exporting inflation. Falling Chinese factory prices helped bring inflation down after 2022. Now, Chinese producer prices are rising by 5%–6%, and the yuan is strengthening by about 0.5% per month. Both feed through to Walmart and Amazon shelves.
• Food may be the next shock. Diesel and fertilizer costs drive farm prices. Wheat, corn, rice and soybeans are up 25%–30% this year. Add a strong El Niño, drought in Europe (France is now a grain importer) and grain stuck in the Black Sea, and the energy shock could become a food shock in 2027. Food shocks destabilize import-dependent countries quickly.
• Whatever the shock, the policy response will be inflationary. You can't raise taxes or cut spending. Tariff revenue has disappointed, and the U.S. is running about $500 billion behind the CBO's estimate. Deficits near 6% of GDP at full employment add fuel. Vincent sees 1970s parallels and doesn't expect the usual Fed or fiscal rescue over the next two years. (SB - to this point I disagree. Sadly, I see no other options but for fiscal dominance to continue. Our elected officials lack the will to cut spending and raise taxes. As I wrote in Bankruptcy or Robots, I’m praying for productivity growth (robots) but feel bankruptcy (money printing the debt away) is the more probable outcome. Which means continued inflation and higher interest rates. I fear I’m right and pray I’m wrong.)
• Deluard is wary of the official numbers. He suspects CPI understates true inflation. Bond markets may be pricing in a risk that inflation measures get "managed" lower. That would explain why breakeven inflation rates haven't moved, even as other inflation signals have risen.
Bonds are back
• Higher yields are "nature healing." The abnormal period was the decade of zero rates and QE. With inflation around 4%, real growth around 2% and AI capex near 3% of GDP, a 5% Treasury yield isn't crazy. Vincent is turning more positive on bonds, mostly because he's bearish on stocks. He likes the middle of the curve, where a 5%+ coupon cushions you even if yields rise a bit more. (SB - true but 5% barely covers the inflation problem and there are better high yielding alternatives in my view.)
Around the world
• Europe is Japan in 2011–12, only uglier. Europe faces an aging population, expensive energy, and Chinese competition that is crushing its exports. Japan eventually got out of its debt trap by letting the yen fall. Vincent expects Europe to do the same, but messily, through a sequence of crises. France checks every box for a sovereign debt crisis: high debt, a big deficit, foreign financing, a currency it can't print, slow growth and unpopular politicians. He thinks the euro could eventually fall toward 0.80 against the dollar.
• Asia is getting richer. South Korea and Taiwan run current-account surpluses of about 25% of GDP, and Samsung reportedly earns about $1 billion a day. That flood of money will eventually push up their currencies and interest rates. He likes the Korean won and the Japanese yen. The yen also acts as a hedge if stocks fall.
• Japan has escaped its debt trap. Japanese tax revenue has grown about 7% a year for a decade. Growth now exceeds the cost of its debt, and money is flowing home to Japan.
• The UK may be the contrarian pick. UK pensions have cut domestic stocks from about 50% of their holdings to about 5% over 20 years. The UK is now just 2% of global market cap, less than its share of global GDP. Britain already lived through its debt scare (the Liz Truss moment) and is a little ahead of Europe in working through it. Its market is heavy in energy, healthcare and banks.
• Latin America and crypto. Local investors took profits after the political rallies in Brazil and elsewhere, but foreign buyers may be next. Some of Korea's huge surplus may be leaking into crypto: about 20% of South Koreans own it, the highest share of any country. That may help explain crypto's resilience despite rising real yields. (SB - well, crypto has been selling off aggressively in the recent mess, too.)
Bottom line: Most stocks are struggling, consumers are spending their savings, and the market's calm is an illusion. Real-world oil is far more expensive than the headline price, food may be next, and the policy response to any shock will be inflationary. His message matches Howell's and, in many areas, mine. Remain patient and brace for opportunity. It is certainly nearer than it was a month ago. And remember, markets rarely move in a straight line.
Note: the interview was recorded in early October.
Not a recommendation for you to buy or sell any security. Views are subject to change at any moment.
The Yen Carry Trade Watch
The charts are updated. In summary, the risk of unwinding remains high.
If you are a new reader, I explain the logic along with charts I’m watching next:
Interest rates are the cost of money. Everything macro is tied to the cost of money. The match that lights the fuse to the global leverage problem is rising rates. We should all be on high alert.
Tracking the potential unwinding of the yen carry trade, here is the bottom line:
Across each of the key risk assets, we are seeing red flags. Signs risk is unwinding. Risk of a disruptive event is high.
We are at a critical point: rising yields at a time of extreme system-wide leverage (the yen carry trade, government debt, global developed market debt and U.S. margin debt). I’m updating the following charts each week, as we may be near a critical inflection point.
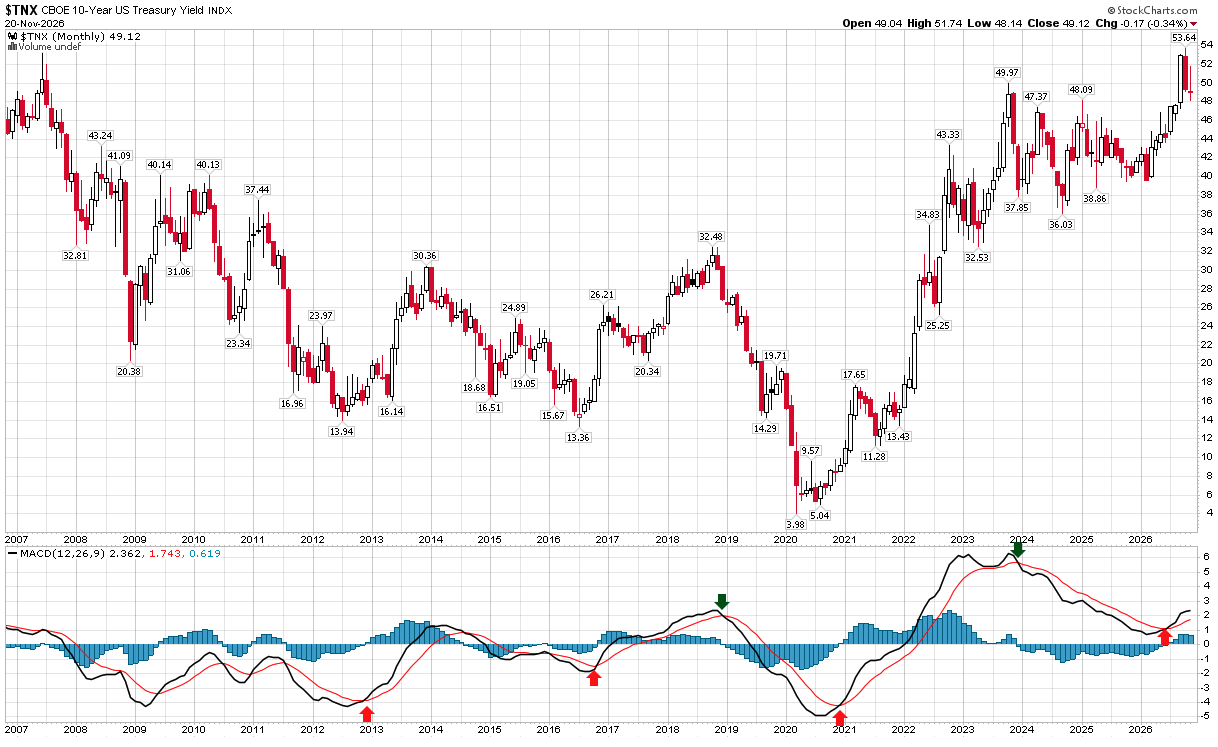
When viewing the MACD signals, keep the following in mind. The Monthly MACD signals the dominant trend over the next 8 to 20 months from the signal date. Nothing is perfect in investing. The idea is to understand what price activity (actual buyers and sellers) is telling us.
The Daily (short-term) MACD Trend: ~8 days to 20 days
The Weekly (intermediate-term) MACD Trend: ~8 weeks to 20 weeks
The Monthly (long-term) MACD Trend: ~8 months to 20 months
Updated charts with brief notes follow:
The 10-Year Treasury - Monthly MACD
Source: StockCharts.com, CMG annotations (arrows)
The Yen:
The Bank of Japan needs the yen to be higher to fight off inflation.
It would prefer not to raise interest rates, as that would increase the interest costs it pays on its debt and risk unwinding the leveraged yen carry trade (borrowing at near 0% and investing in higher-yielding assets globally, including the U.S.).
When the borrow-for-free spread goes away, the leverage likely unwinds.
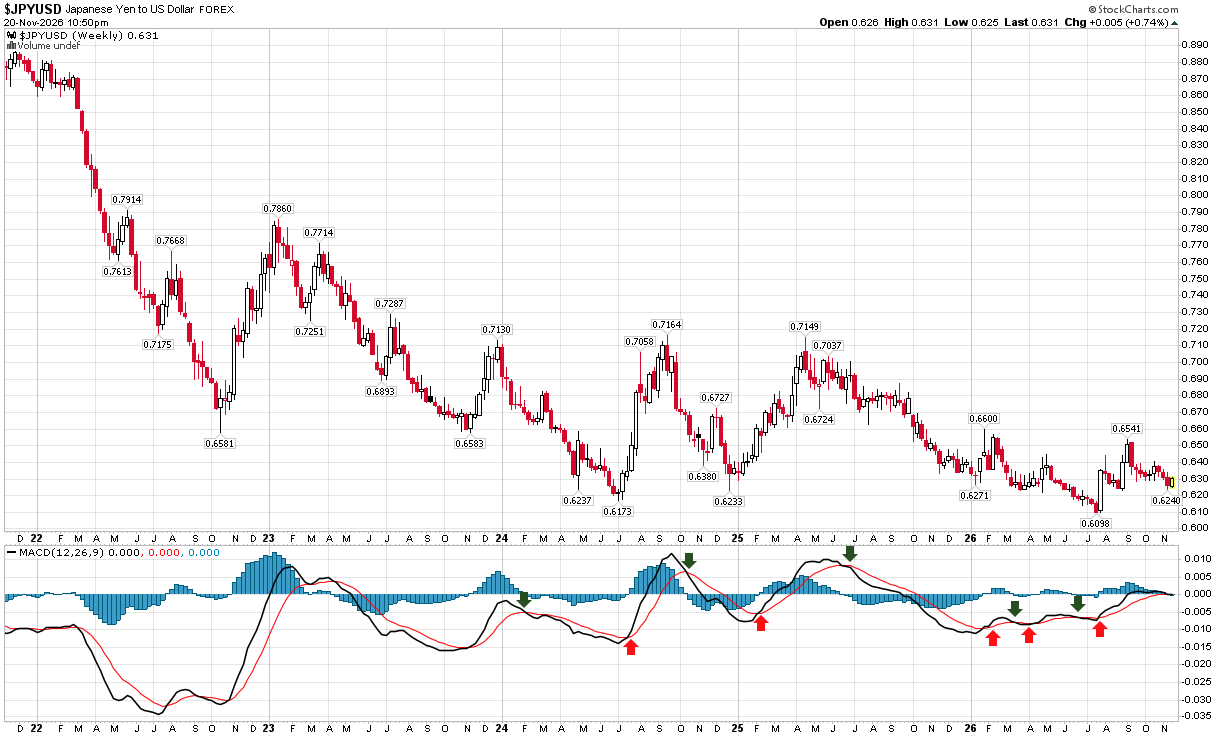
The current trend, as measured by the weekly MACD, points to a higher yen. A rising yen is bearish for global liquidity. A declining yen is bullish.
Bottom line: The Weekly MACD trend indicator is nearing a bullish, declining-yen signal. Bullish for global liquidity.
Japanese yen, weekly MACD
Source: StockCharts.com, CMG annotations
The Dollar:
The Weekly MACD trend signal is pointing to a higher dollar.
Remember, we are looking at the yen vs. the dollar. So, a rising dollar relative to the yen is bullish for global liquidity.
Bottom line: There is currently a low risk of the yen carry trade unwinding.
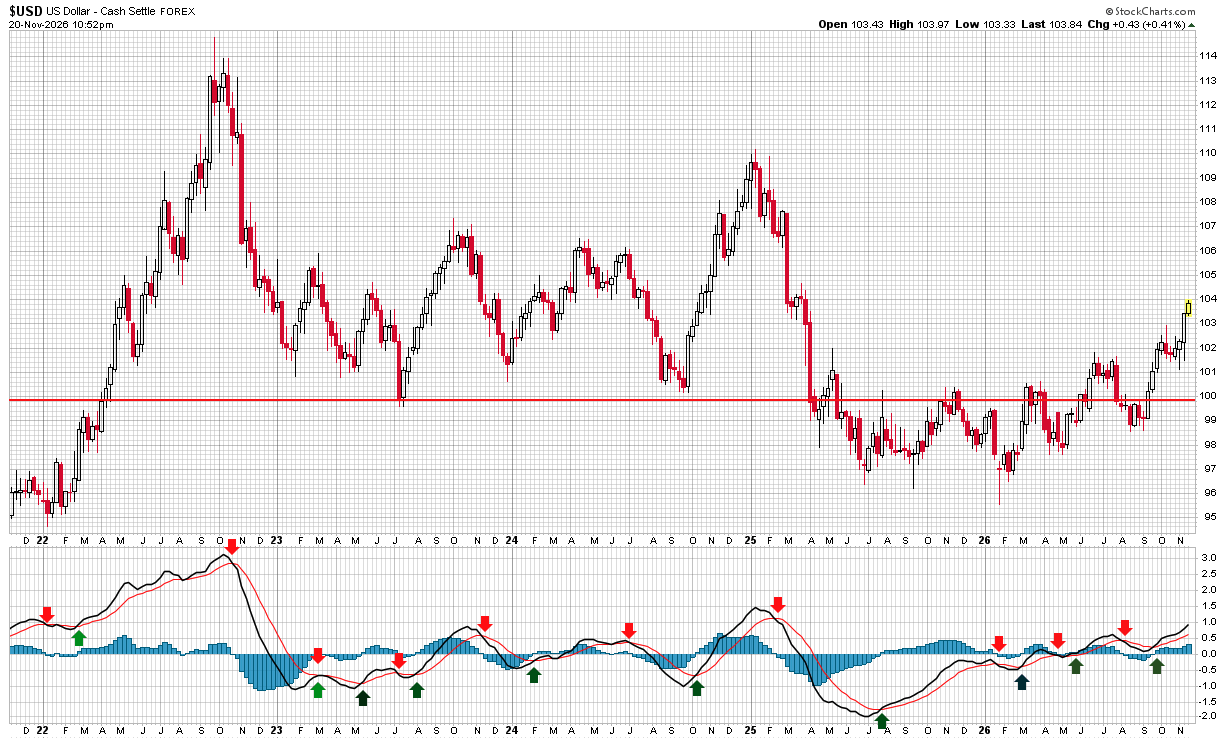
Source: StockCharts.com, CMG Investment Research
High-Yield Bonds - Weekly MACD Bear Trend Signal
Next is the “canary in the coal mine” indicator I’ve been using since 1992.
The long-term monthly MACD price trend remains bearish (the monthly MACD is the dominant long-term trend; the weekly is the intermediate-term trend).
The high-yield market tends to lead the equity market, which in turn leads the economy.
Bottom line: The red down arrow (bottom right) is a major warning. Risk is high.
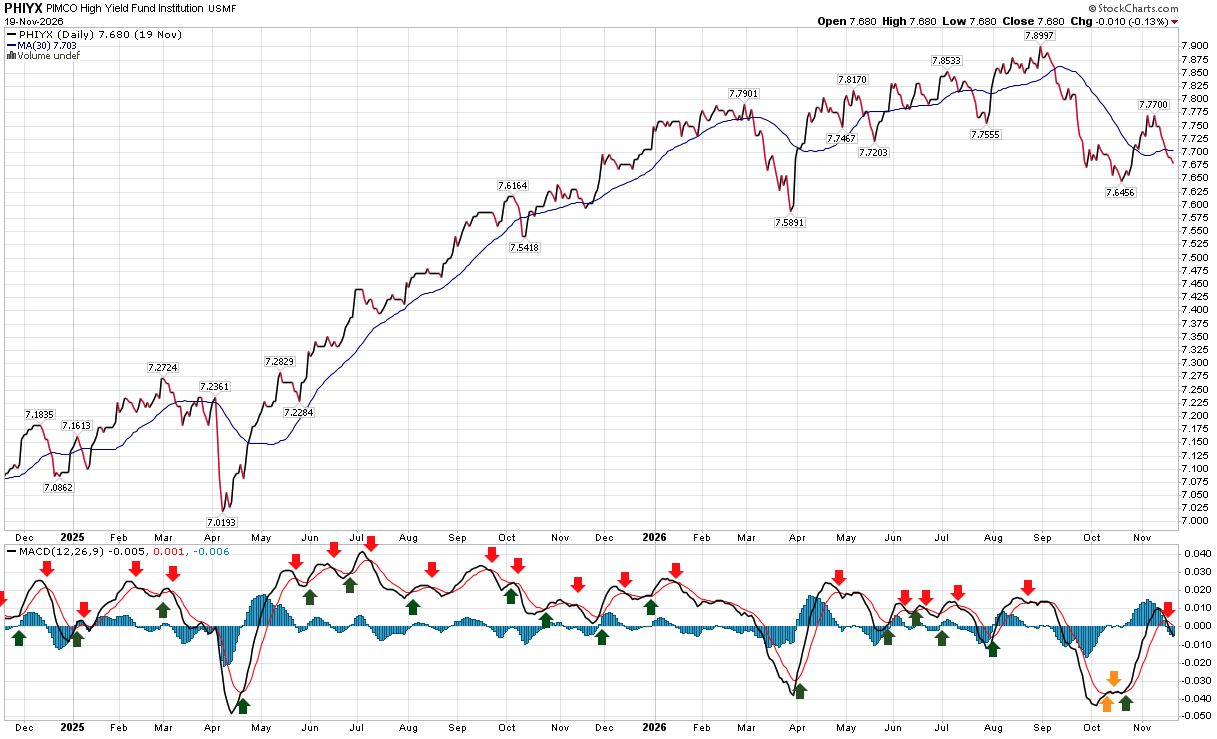
Source: StockCharts.com, CMG arrows
When prices decline, yields rise. Rising high-yield yields are a concern.
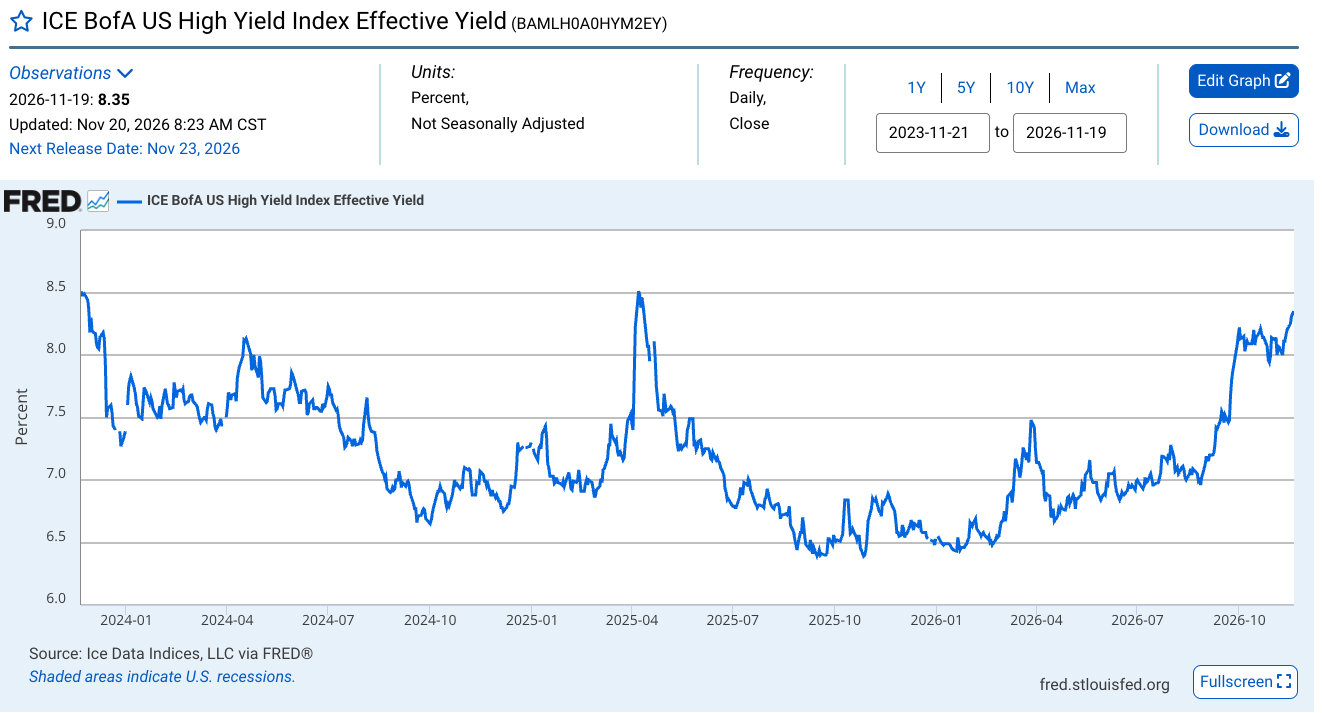
And here is what is happening in the riskiest junk-bond category, CCC. You would naturally see risk rise first in the weakest companies, so this is an important warning sign to watch for.
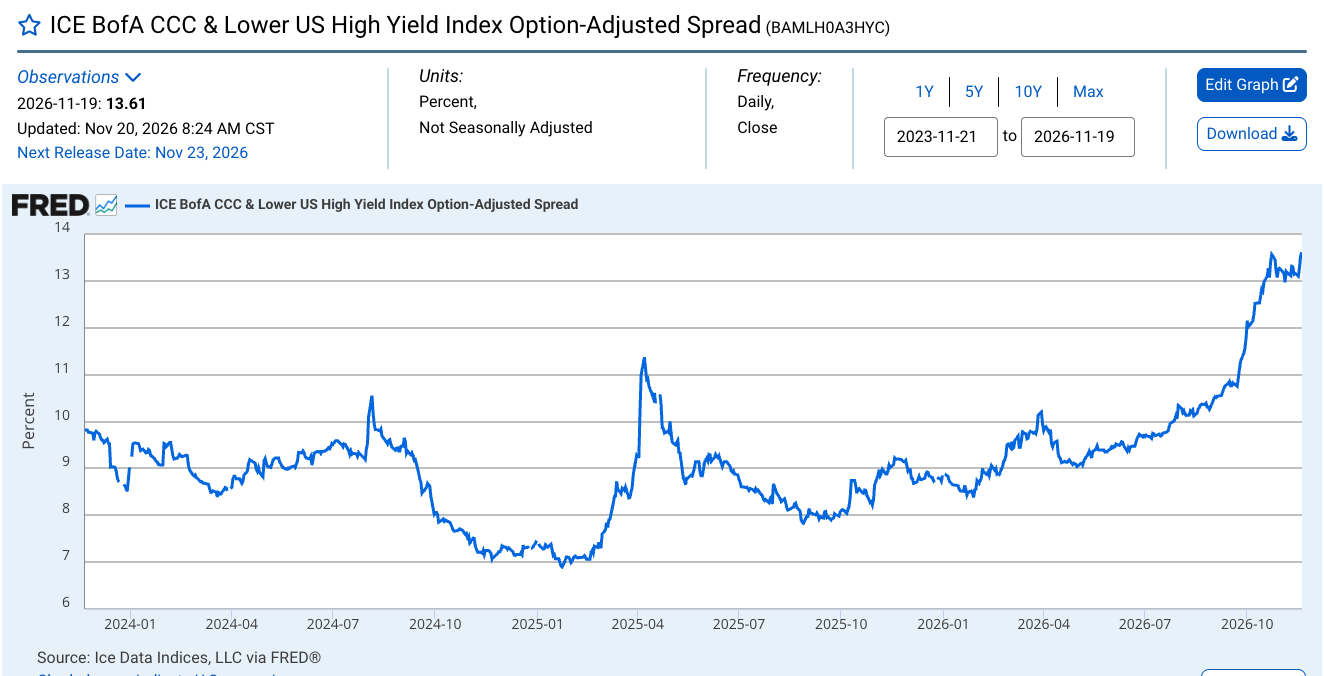
Source: FRED - https://fred.stlouisfed.org/series/BAMLH0A3HYC
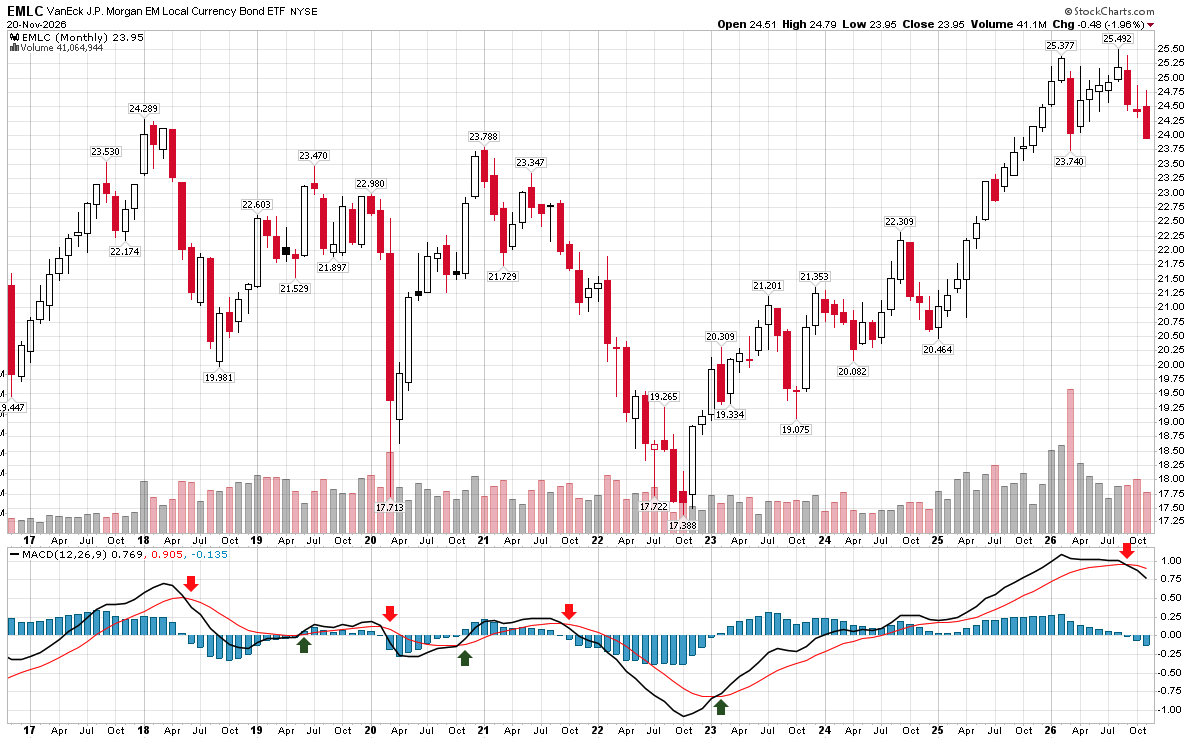
Emerging Market Local Currency Bond ETF - Monthly MACD Bear Trend Signal
Another signal to watch: emerging market (EM) debt, where some of the carry-trade leverage sits (borrow cheaply in yen, invest in higher-yielding EM bonds).
How to read the chart:
Calm and steady is good; a sharp price decline is a warning. Prices down mean yields are up.
The Monthly MACD trend signal is a sell signal (indicating a downward price trend). This is the first signal since the buy signal in early 2023.
Bottom line: The Monthly MACD trend is down. More sellers than buyers push prices lower, and when bond prices fall, yields rise. This is another warning sign of an unwinding of the leveraged yen carry trade.
Source: StockCharts.com, CMG Investment Research
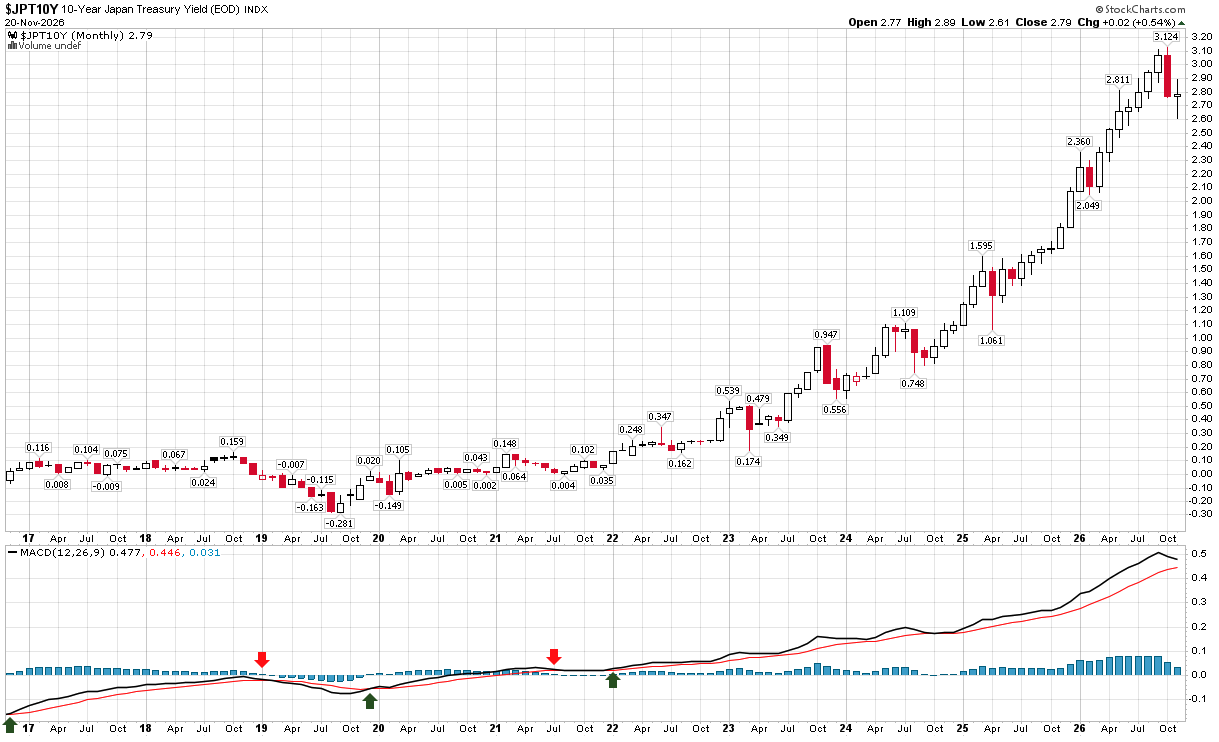
Japan 10-Year Government Bond (JGB) Yield - Monthly MACD Signaling Higher Yields (Bearish for Global Liquidity)
Higher JGB yields reduce the benefit of the yen carry trade. Lower JGB yields encourage borrowing in yen at low rates and investing elsewhere at higher yields to capture the spread.
The Monthly MACD is signaling higher yields, which is bearish for the carry trade. However, yields are down from 3.12% to 2.79%, easing worry of the carry trade unwinding.
Bottom line: Japanese yields have moved lower off the recent highs. Lower is generally bullish for the carry trade because borrowing costs come down. Overall - Remain on high alert.
Japan 10-year JGB yield, monthly MACD
Source: StockCharts.com
I’ll keep posting this section most weeks, along with the charts I’m monitoring for a potential unwind in the yen carry trade. It’s about leverage, and I believe it is always leverage that blows things up.
Opinions are subject to change. Not a recommendation to buy or sell any security. Provided for discussion and educational purposes only. Past performance is not indicative of future results.
If you like what you are reading, click on the link and share it with a friend (it’s free).
CLICK HERE TO SUBSCRIBE TO ON MY RADAR
Trade Signals: November 20, 2026 Update
Market Commentary
Trade Signals is free for CMG clients and a paid subscription service for others. Selfishly, I write it for myself each week, and have for years, with the goal of staying disciplined in the markets.
Trade Signals
The Indicators Dashboard - Stocks, Investor Sentiment, Bonds, Commodities, Currencies, and Gold
Valuations and Subsequent 10-year Returns
Supporting Charts with Explanations

TRADE SIGNALS SUBSCRIPTION ACKNOWLEDGEMENT / IMPORTANT DISCLOSURES
About Trade Signals - Trade Signals is a paid subscription service that posts daily, weekly, and monthly market trends (and more). Free for CMG clients. Not a recommendation to buy or sell any security. For discussion purposes only.
The views expressed herein are solely those of Steve Blumenthal as of the date of this report and are subject to change without notice. Please note that the information provided is not recommended for buying or selling any security and is provided for discussion purposes only.
Personal Note: Thanksgiving, West Palm Beach and Austin, TX
The weather here in the Philadelphia area is sunny, with clear skies and temps in the low 60s. I plan to play golf at Stonewall tomorrow with friends and make sure we have plenty of wood for the fire pit. Four of our six children are coming home for Thanksgiving. Really looking forward to the time together, the Turkey, stuffing, mashed potatoes, and gravy, along with some fine red wine. Best holiday of the year. Grateful!
I’ll be hosting dinners in West Palm Beach and Austin in early December for clients and readers. I’ll let you know the dates as soon as we nail them down.
There will be no letter next Friday.
Wishing you and your family a warm and wonderful Thanksgiving.
With kind regards,
Steve
CLICK HERE TO SUBSCRIBE TO ON MY RADAR - IT’S FREE
You can share this letter on X by clicking here.
You can share this letter on LinkedIn by clicking here.
Subscribe to OMR for free by clicking the photo.
Stephen B. Blumenthal
Founder and CEO
CMG Capital Management Group, Inc.
75 Valley Stream Parkway, Suite 201
Malvern, PA 19355
CMG Customer Relationship Summary (Form CRS)
Metric-Financial, LLC Customer Relationship Summary (Form CRS)

Stephen Blumenthal founded CMG Capital Management Group in 1992 and serves today as its CEO. Steve authors a free weekly e-letter entitled, “On My Radar.” Steve shares his views on macroeconomic research, valuations, portfolio construction, asset allocation and risk management. Author of Forbes Book: On My Radar, Navigating Stock Market Cycles.
Follow Steve on X @SBlumenthalCMG and LinkedIn.
IMPORTANT DISCLOSURE INFORMATION
This document is prepared by CMG Capital Management Group, Inc. (“CMG”) and is circulated for informational and educational purposes only. There is no consideration given to the specific investment needs, objectives, or tolerances of any of the recipients. Additionally, CMG’s actual investment positions may, and often will, vary from its conclusions discussed herein based on any number of factors, such as client investment restrictions, portfolio rebalancing, and transaction costs, among others. Recipients should consult their own advisors, including tax advisors, before making any investment decision. This material is for informational and educational purposes only and is not an offer to sell or the solicitation of an offer to buy the securities or other instruments mentioned. This material does not constitute a personal recommendation or take into account the particular investment objectives, financial situations, or needs of individual investors which are necessary considerations before making any investment decision. Investors should consider whether any advice or recommendation in this research is suitable for their particular circumstances and, where appropriate, seek professional advice, including legal, tax, accounting, investment, or other advice. The views expressed herein are solely those of Steve Blumenthal as of the date of this report and are subject to change without notice.
Investing involves risk.
This letter may contain forward-looking statements relating to the objectives, opportunities, and future performance of the various investment markets, indices, and investments. Forward-looking statements may be identified by the use of such words as; “believe,” anticipate,” “planned,” “potential,” and other similar terms. Examples of forward-looking statements include, but are not limited to, estimates with respect to financial condition, results of operations, and success or lack of success of any particular market, index, investment, or investment strategy. All are subject to various factors, including, but not limited to, general and local economic conditions, changing levels of competition within certain industries and markets, changes in legislation or regulation, Federal Reserve policy, and other economic, competitive, governmental, regulatory, and technological factors affecting markets, indices, investments, investment strategy and portfolio positioning that could cause actual results to differ materially from projected results. Such statements are forward-looking in nature and involve a number of known and unknown risks, uncertainties, and other factors, and accordingly, actual results may differ materially from those reflected or contemplated in such forward-looking statements. Investors are cautioned not to place undue reliance on any forward-looking statements or examples. All statements made herein speak only as of the date that they were made. Investing is inherently risky and all investing involves the potential risk of loss.
Past performance does not guarantee or indicate future results. Different types of investments involve varying degrees of risk, and there can be no assurance that the future performance of any specific investment, investment strategy, or product (including the investments and/or investment strategies recommended or undertaken by CMG), or any non-investment related content, made reference to directly or indirectly in this commentary will be profitable, equal any corresponding indicated historical performance level(s), be suitable for your portfolio or individual situation or prove successful. Due to various factors, including changing market conditions and/or applicable laws, the content may no longer be reflective of current opinions or positions. Moreover, you should not assume that any discussion or information contained in this commentary serves as the receipt of, or as a substitute for, personalized investment advice from CMG. Please remember to contact CMG, in writing, if there are any changes in your personal/financial situation or investment objectives for the purpose of reviewing/evaluating/revising our previous recommendations and/or services, or if you would like to impose, add, or to modify any reasonable restrictions to our investment advisory services. Unless, and until, you notify us, in writing, to the contrary, we shall continue to provide services as we do currently. CMG is neither a law firm, nor a certified public accounting firm, and no portion of the commentary content should be construed as legal or accounting advice.
No portion of the content should be construed as an offer or solicitation for the purchase or sale of any security. References to specific securities, investment programs or funds are for illustrative purposes only and are not intended to be, and should not be interpreted as recommendations to purchase or sell such securities.
This presentation does not discuss, directly or indirectly, the amount of the profits or losses realized or unrealized, by any CMG client from any specific funds or securities. Please note: In the event that CMG references performance results for an actual CMG portfolio, the results are reported net of advisory fees and inclusive of dividends. The performance referenced is that as determined and/or provided directly by the referenced funds and/or publishers, has not been independently verified, and does not reflect the performance of any specific CMG client. CMG clients may have experienced materially different performance based upon various factors during the corresponding time periods. See in links provided citing limitations of hypothetical back-tested information. Past performance cannot predict or guarantee future performance. Not a recommendation to buy or sell. Please talk to your advisor.
Information herein has been obtained from sources believed to be reliable, but we do not warrant its accuracy. This document is general communication and is provided for informational and/or educational purposes only. None of the content should be viewed as a suggestion that you take or refrain from taking any action nor as a recommendation for any specific investment product, strategy, or other such purposes.
In a rising interest rate environment, the value of fixed-income securities generally declines, and conversely, in a falling interest rate environment, the value of fixed-income securities generally increases. High-yield securities may be subject to heightened market, interest rate, or credit risk and should not be purchased solely because of the stated yield. Ratings are measured on a scale that ranges from AAA or Aaa (highest) to D or C (lowest). Investment-grade investments are those rated from highest down to BBB- or Baa3.
NOT FDIC INSURED. MAY LOSE VALUE. NO BANK GUARANTEE.
Certain information contained herein has been obtained from third-party sources believed to be reliable, but we cannot guarantee its accuracy or completeness.
In the event that there has been a change in an individual’s investment objective or financial situation, he/she is encouraged to consult with his/her investment professional.
Written Disclosure Statement. CMG is an SEC-registered investment adviser located in Malvern, Pennsylvania. Stephen B. Blumenthal is CMG’s founder and CEO. Please note: The above views are those of CMG and its CEO, Stephen Blumenthal, and do not reflect those of any sub-advisor that CMG may engage to manage any CMG strategy, or exclusively determines any internal strategy employed by CMG. A copy of CMG’s current written disclosure statement discussing advisory services and fees is available upon request or via CMG’s internet web site at www.cmgwealth.com/disclosures. CMG is committed to protecting your personal information. Click here to review CMG’s privacy policies.
See CMG Disclosures at the bottom of this page.
For more information about NDR, please visit at www.ndr.com.
NDR, Inc. (NDR), d.b.a. Ned Davis Research Group (NDRG), any NDRG affiliates or employees, or any third-party data provider, shall not have any liability for any loss sustained by anyone who has relied on the information contained in any NDRG publication. The data and analysis contained herein are provided "as is." NDRG disclaims any and all express or implied warranties, including, but not limited to, any warranties of merchantability, suitability or fitness for a particular purpose or use. NDRG's past recommendations and model results are not a guarantee of future results. This communication reflects our analysts' opinions as of the date of this communication and will not necessarily be updated as views or information change. All opinions expressed herein are subject to change without notice. NDRG or its affiliated companies or their respective shareholders, directors, officers and/or employees, may have long or short positions in the securities discussed herein and may purchase or sell such securities without notice. For NDRG's important additional disclaimers, refer to www.ndr.com/invest/public/copyright.html. Further distribution prohibited without prior permission. Copyright 2025 © NDR, Inc. All rights reserved.
The opinions are mine. Please know that there are no guarantees the above will prove correct, and that views are subject to change. See essential disclosures further below.